Why DOE Is Intervening in PJM and MISO
Forced outages eroded PJM’s maintenance relief. MISO met its current capacity requirements but expects faster demand growth. Emergency orders give both grids time; the underlying problems need more than operating permission.
Ongoing story. Reporting through October 15, 2026. PJM operating data through October 14; MISO capacity results cover June 2026–May 2027.
The U.S. Department of Energy is using emergency powers to keep more power plants available, in two very different places. In PJM, which runs the grid from Chicago to the Mid-Atlantic, a warm October has met plants taken offline for maintenance and transmission lines that cannot carry power where it is needed. In MISO, which covers much of the Midwest, DOE has stopped three coal plants from closing on schedule.
The two situations call for different readings. The data suggest PJM is trying to get through a few stressed evenings, while MISO's orders are about keeping supply around until new construction catches up with demand. Neither order tells us how much extra electricity was actually produced.
Why PJM needed another tool#
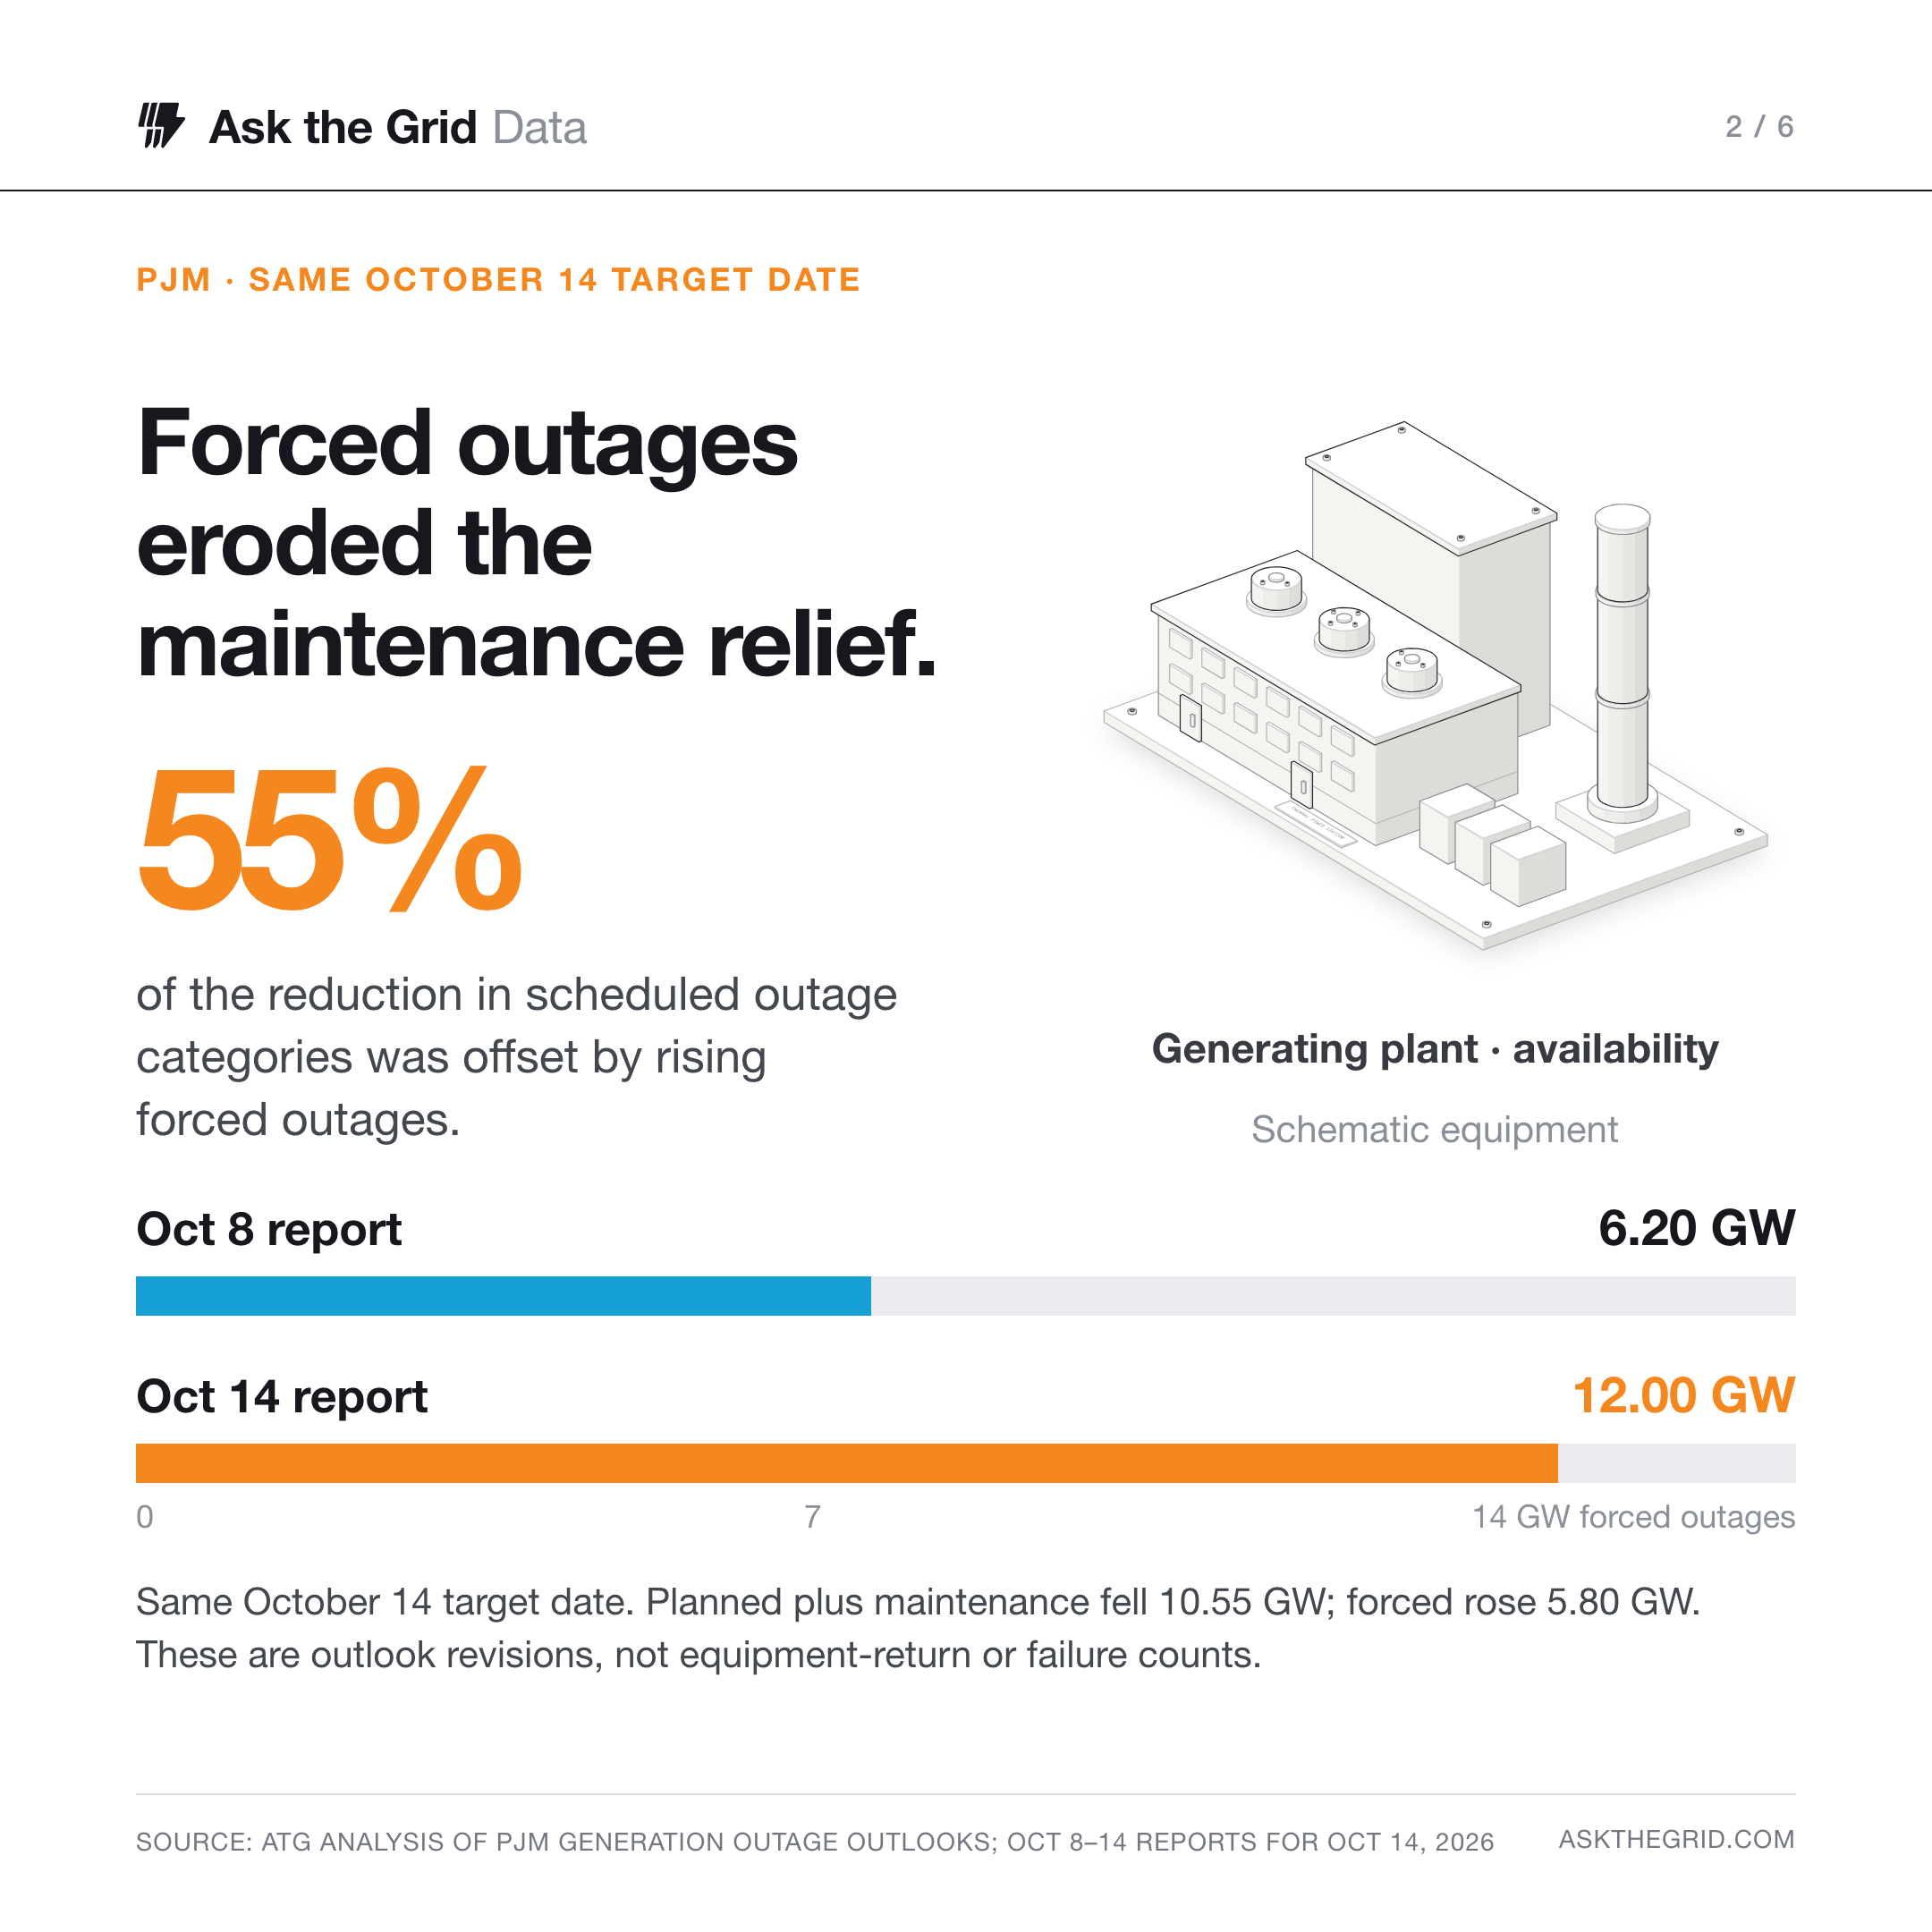
The revealing number is inside PJM's outage outlook. Across the October 8–14 reports for the same October 14 operating date, planned and maintenance outages fell by 10,550 MW. But forced outages, the unplanned breakdowns that cannot be scheduled around, rose from 6,198 MW to 11,996 MW, offsetting 55% of that reduction. The total improved while the less predictable part nearly doubled. These are changes in reported outlooks, rather than a count of equipment that returned or newly failed. The underlying dataset preserves those vintages.
PJM's outage total improved while its forced outages nearly doubled
Outage outlook for the same operating date, October 14 · October 8 report against October 14 report · GW
Forced outages rose from 6.20 GW to 12.00 GW, offsetting 55% of the reduction in the scheduled categories.
PJM: generation outage outlooks, October 8 and 14 reports for the same October 14 date; GW. Scheduled combines planned and maintenance categories. These are changes between outlooks, not a count of equipment that returned or newly failed, and not a reserve calculation.
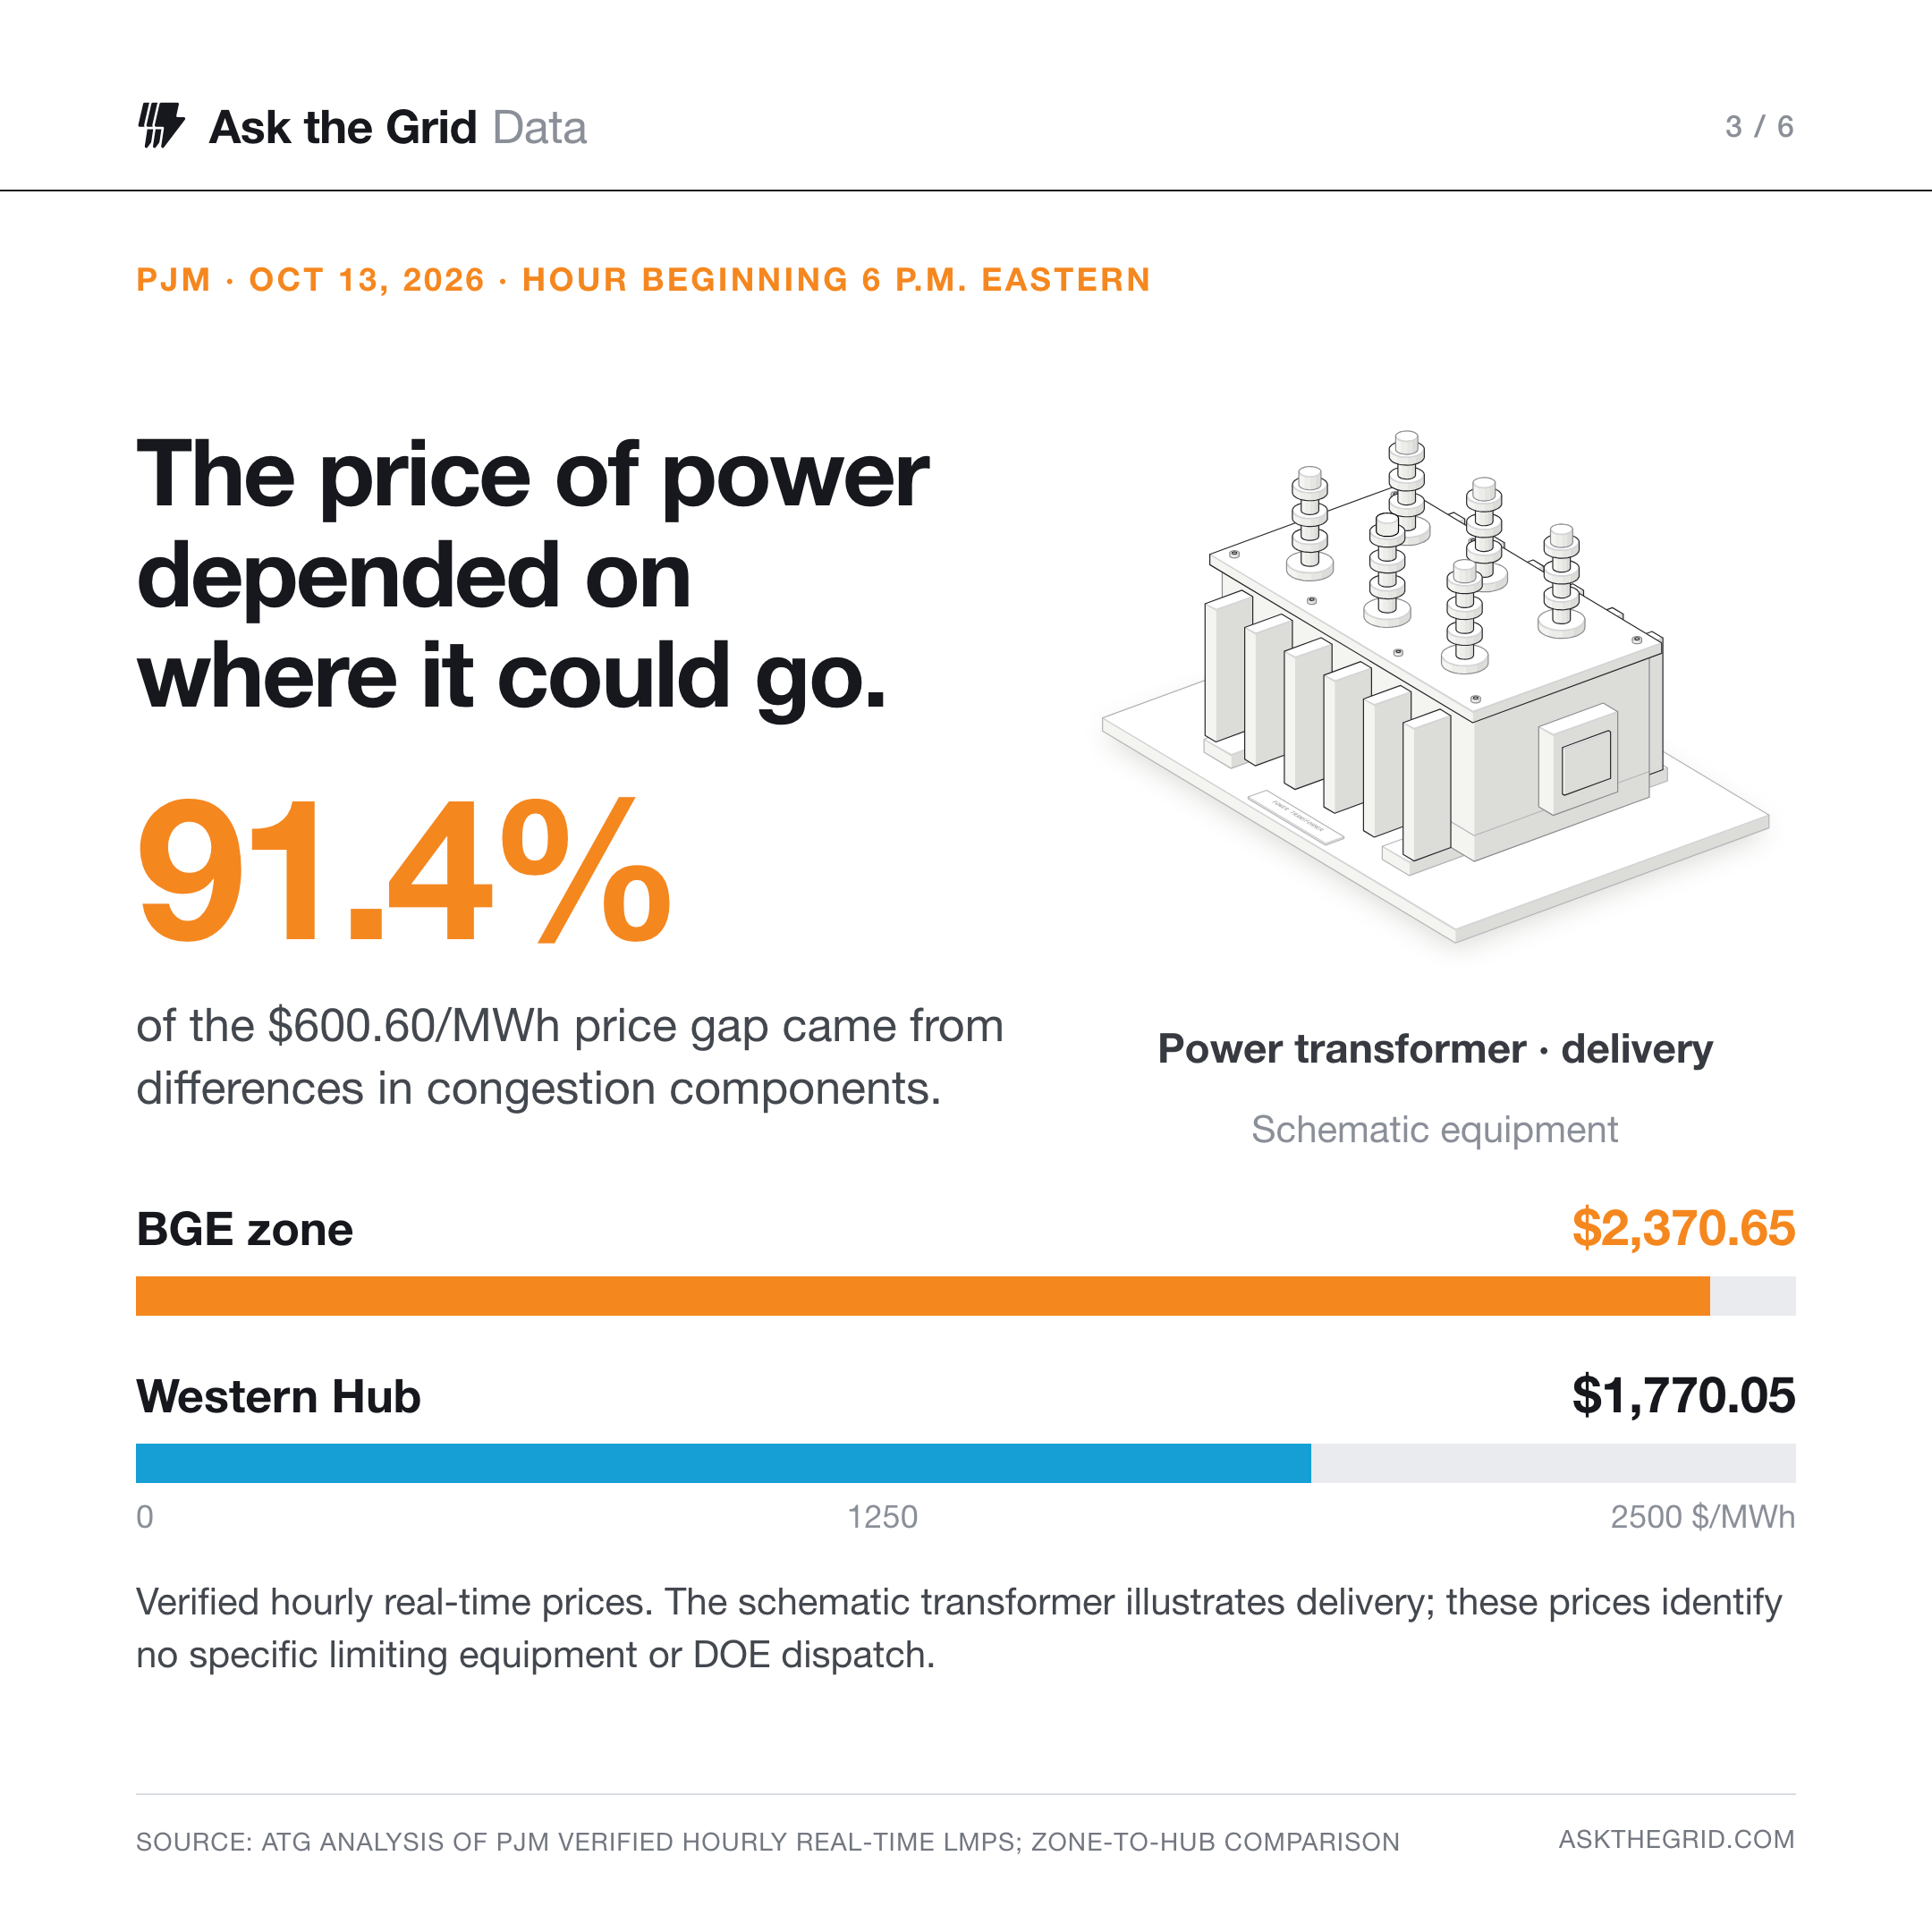
Location compounds the problem. In the hour beginning 6 p.m. Eastern on October 13, BGE's verified real-time hourly price was $2,370.65/MWh, against $1,770.05/MWh at Western Hub. Congestion, the price of squeezing power through limited transmission lines, explained 91% of the gap. The hourly price record separates the energy, congestion and loss components. Additional generation matters only if the network can deliver it where and when it is needed.
One energy price, five different prices by 6 p.m.
October 13, 2026 · hour beginning 6 p.m. Eastern · verified real-time $/MWh, split into its three components
BGE exceeded Western Hub by $600.60/MWh; the difference in congestion components, $548.90/MWh, accounts for 91.4% of it.
PJM verified hourly real-time LMPs by pricing node, hourly price record. BGE, Dominion, Pepco and ComEd are zones; Western Hub is a trading hub. Components can differ from totals by source rounding. This is a zone-to-hub price comparison, not an attribution to a particular transmission facility.
DOE's October 13–16 order gives PJM conditional operating relief for listed generators and last-resort access to eligible backup resources. PJM used demand response on October 13 and 14; its October 14 update said large-load backup generation had not been needed to that point. The order expands the operator's options without establishing how much extra generation those options delivered.
Why MISO's story is different#
DOE's MISO orders hold Campbell available through November 14, and Schahfer Units 17–18 and Culley Unit 2 through December 18, 2026. DOE cites continuing resource-adequacy risk to justify retaining these plants.
PJM's order runs four days; MISO's hold plants for months
DOE Federal Power Act section 202(c) orders in effect on October 15, 2026
PJM
Order 202-26-50
Oct. 13–16
Listed units and last-resort backup
Campbell · MISO
Michigan · 202-26-39
Aug. 17 – Nov. 14
Held available beyond planned shutdown
Schahfer 17–18 · MISO
Indiana · 202-26-46
Sep. 20 – Dec. 18
Held available
Culley 2 · MISO
Indiana · 202-26-47
Sep. 20 – Dec. 18
Held available
PJM
Order 202-26-50
- Oct 13, 2026 – Oct 16, 2026
Oct. 13–16 · Listed units and last-resort backup
Campbell · MISO
Michigan · 202-26-39
- Aug 17, 2026 – Nov 14, 2026
Aug. 17 – Nov. 14 · Held available beyond planned shutdown
Schahfer 17–18 · MISO
Indiana · 202-26-46
- Sep 20, 2026 – Dec 18, 2026
Sep. 20 – Dec. 18 · Held available
Culley 2 · MISO
Indiana · 202-26-47
- Sep 20, 2026 – Dec 18, 2026
Sep. 20 – Dec. 18 · Held available
Windows are the dates DOE states for each order. DOE's index of 2026 section 202(c) orders lists the operative orders; PJM 202-26-50, Campbell 202-26-39, Schahfer 202-26-46, Culley 202-26-47. An order's window states authority, not output: it does not measure generation delivered under it.
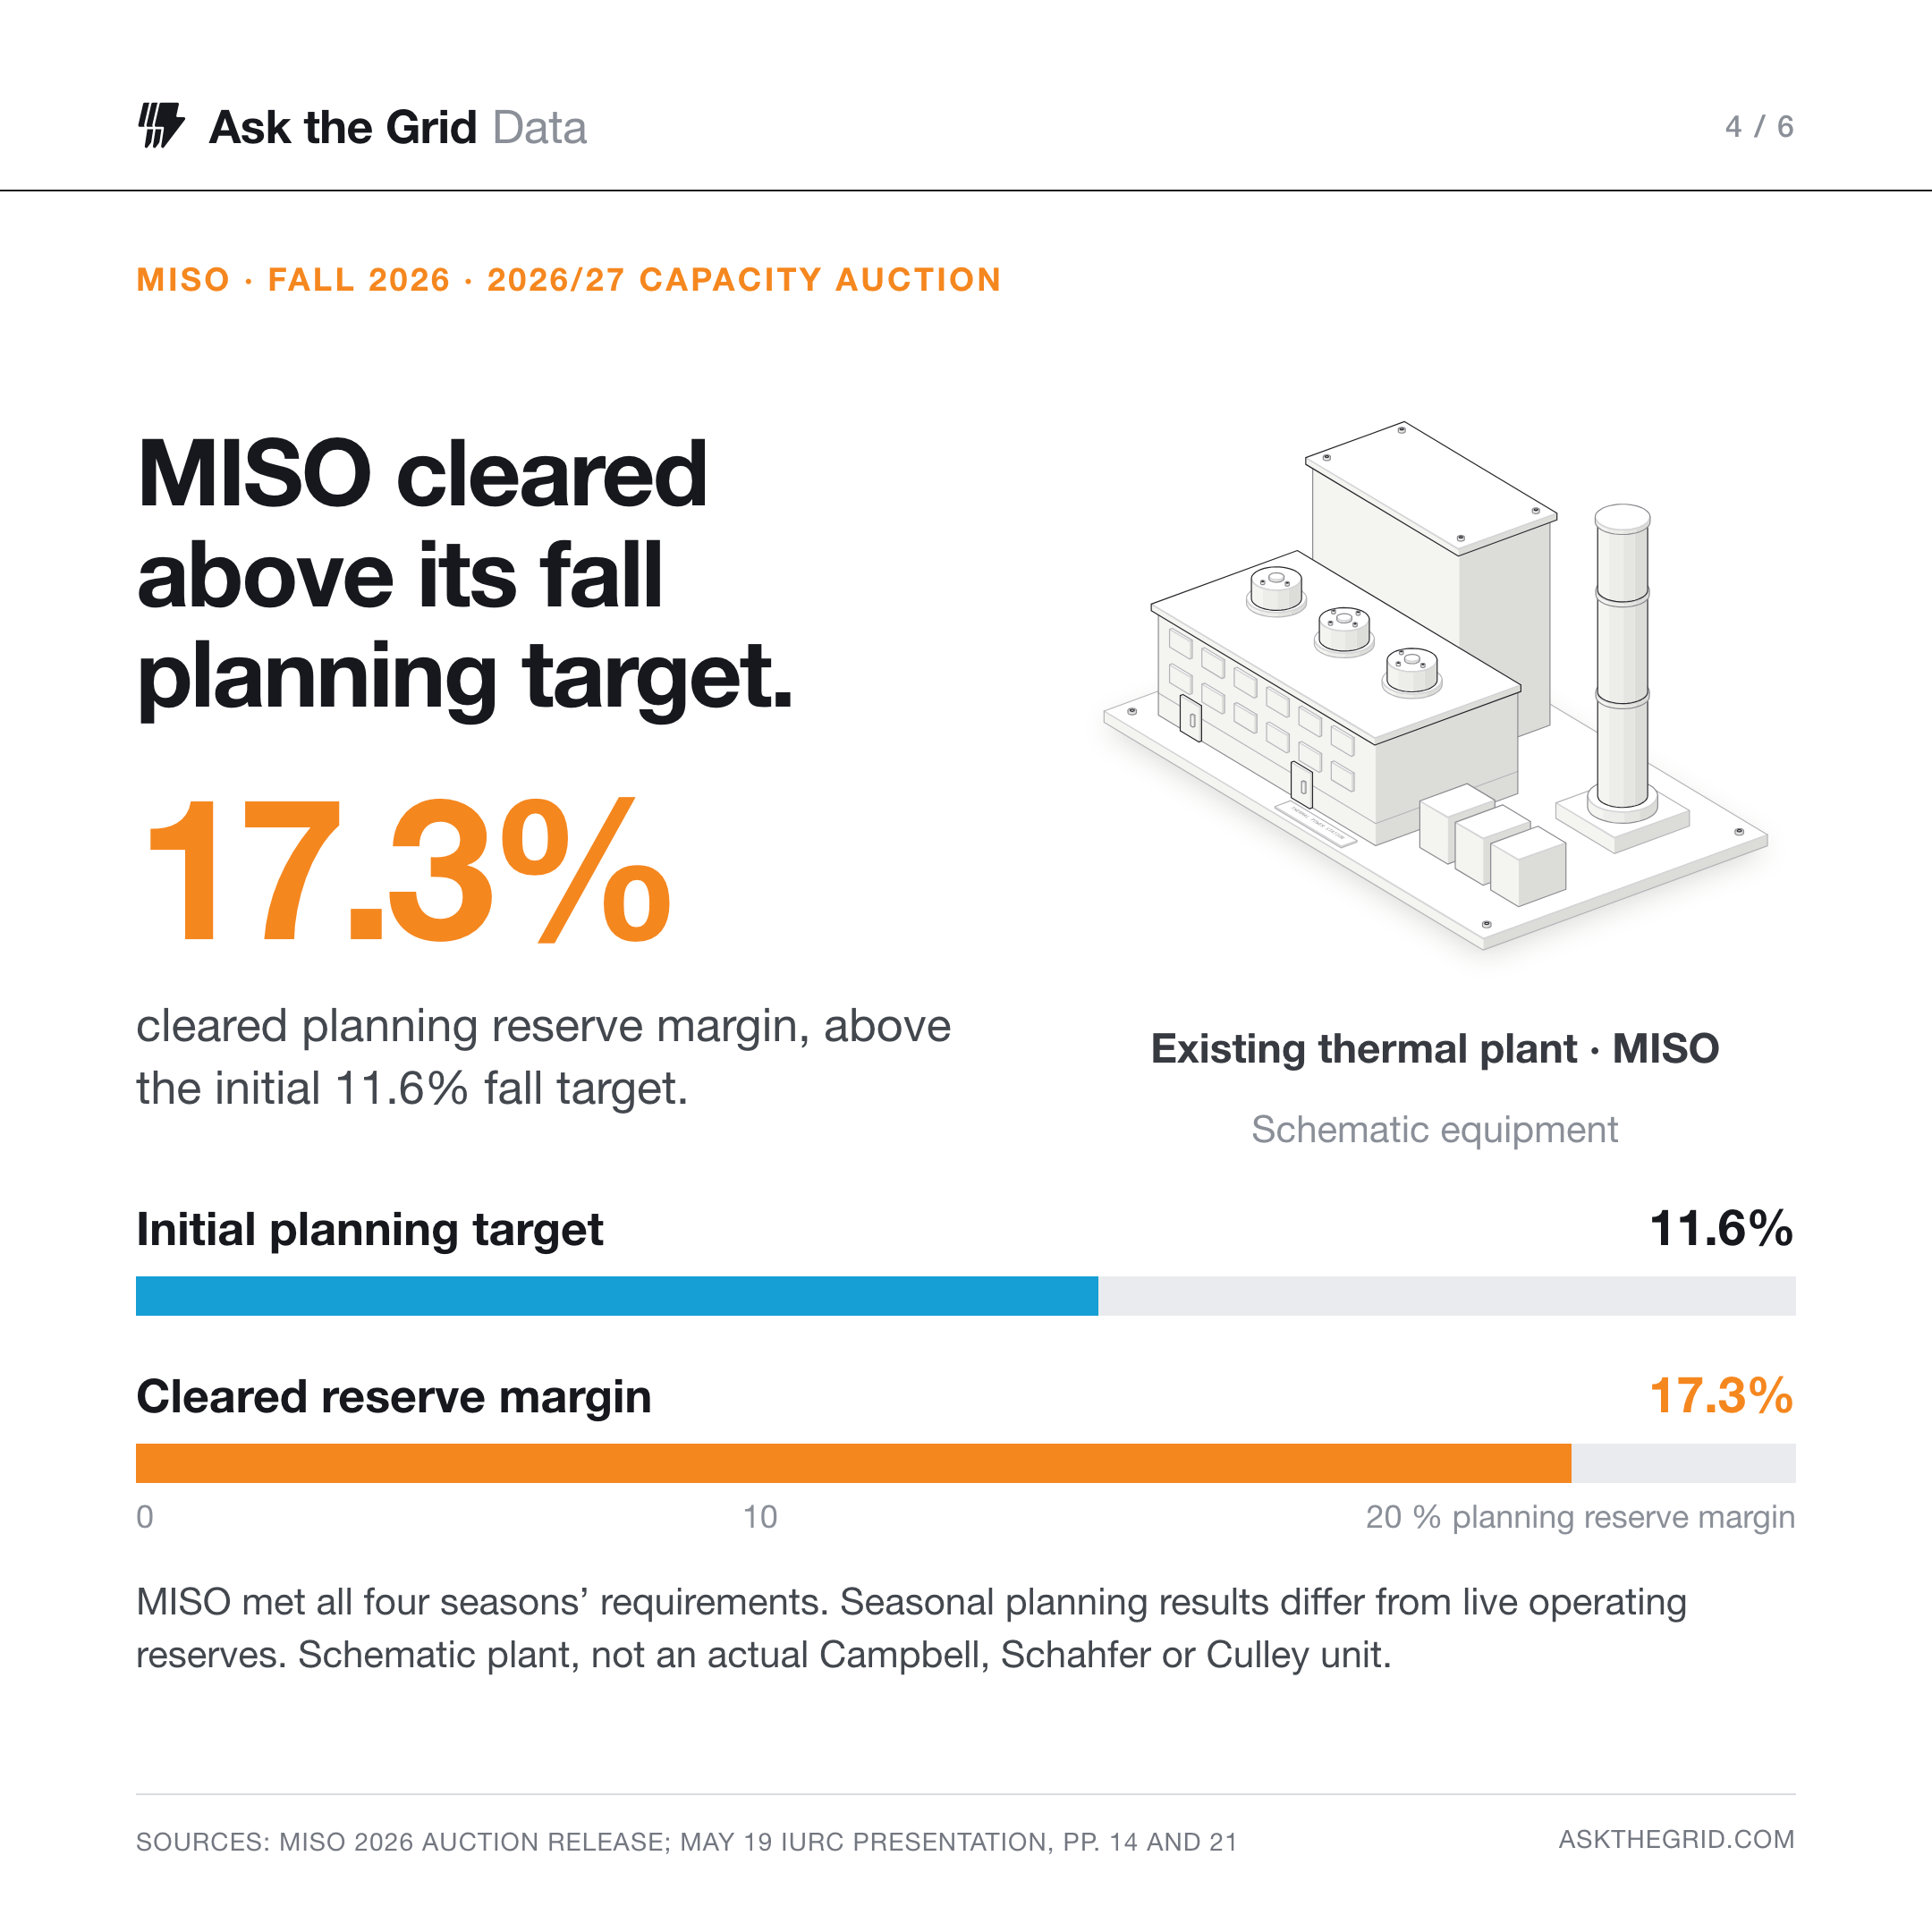
There is important counterevidence to a blanket shortage narrative. MISO's 2026/27 auction met its capacity requirements across all four seasons. Its fall planning reserve margin, the cushion of supply above expected peak demand, cleared at 17.3%, above an initial 11.6% target. That is a seasonal planning result, not a live reserve reading. MISO's own winter-storm review describes reserves stranded in the South and emergency assistance from PJM: capacity on paper and power deliverable during a particular emergency are different tests.
MISO cleared above its fall planning target
2026/27 Planning Resource Auction · fall planning reserve margin, % of seasonal peak demand basis
The auction cleared 5.7 points above its target. It met the seasonal target; it does not establish what is available and deliverable in any particular hour.
MISO: May 19 presentation, p. 21; 2026/27 auction, fall planning reserve margin as a percentage of the seasonal peak demand basis. This is a seasonal planning result, not live operating reserves, and does not measure generation delivered under DOE orders.
What to expect next#
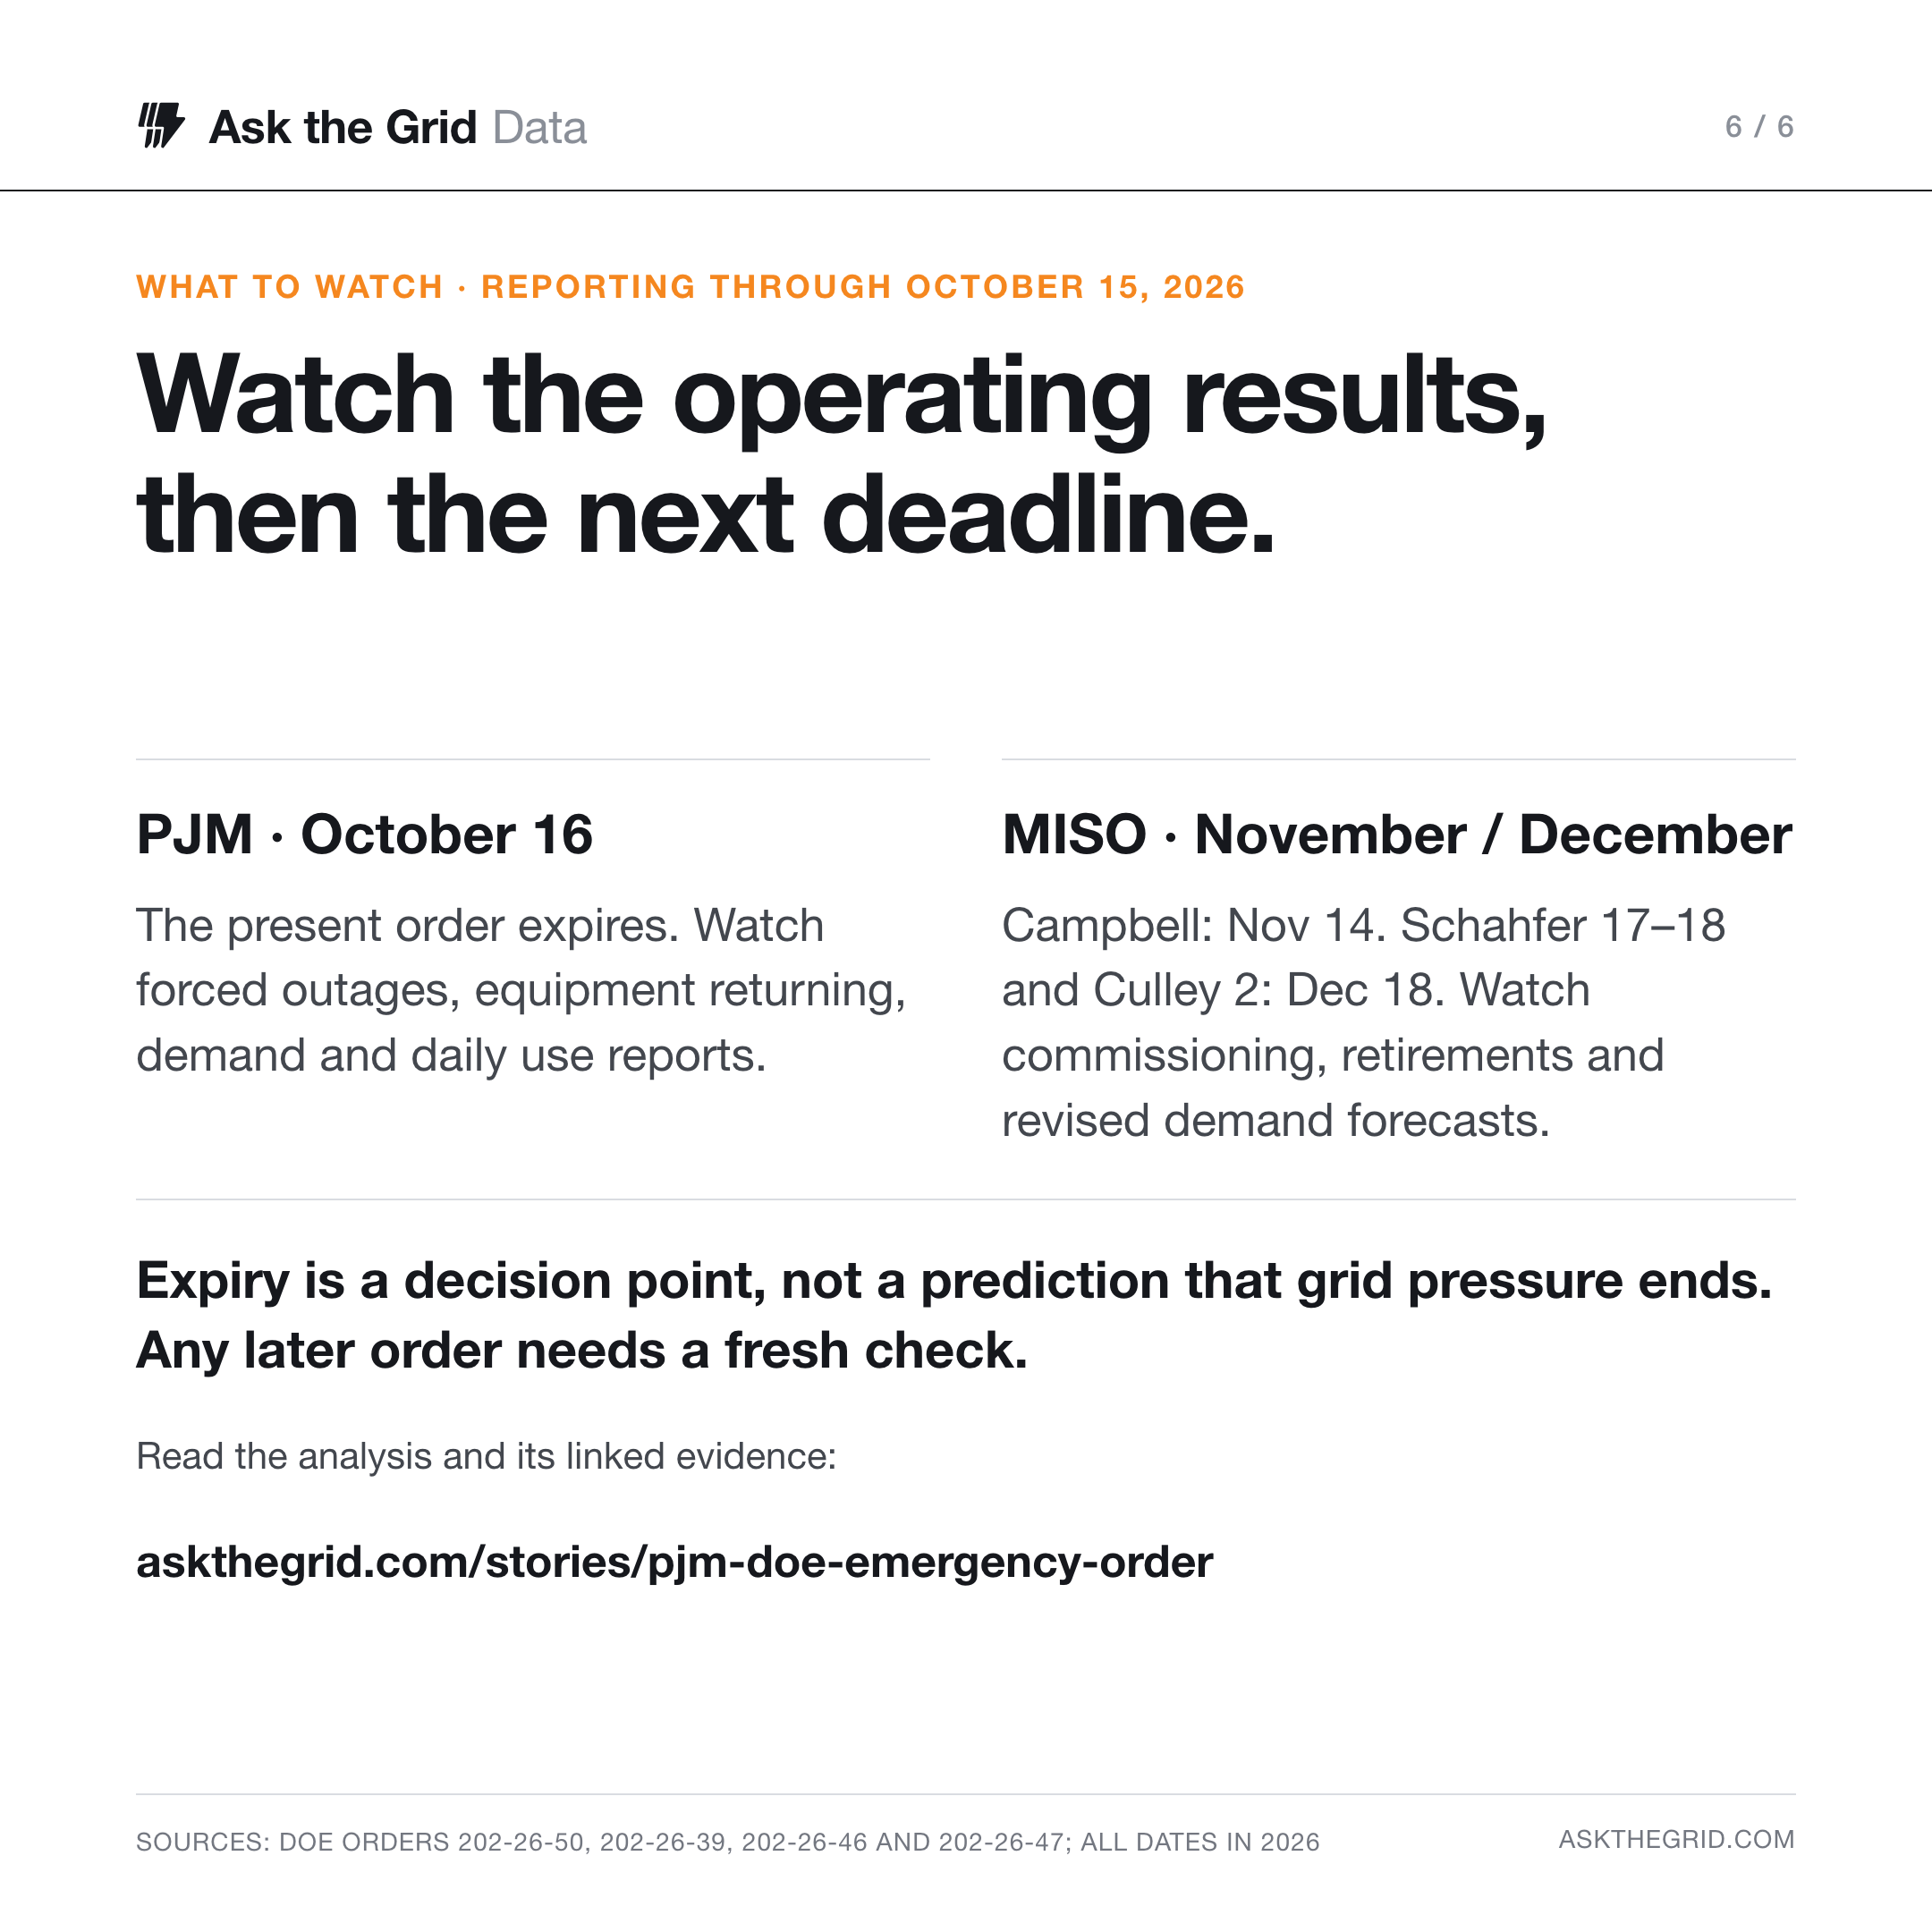
For PJM, the near-term question is whether equipment returns fast enough for the demand it must serve. Finishing maintenance should help, but the rising forced-outage outlook shows why a falling scheduled-outage total alone is insufficient reassurance. The October 16 expiry is the next decision point for the present order; daily use reports and any extension will show whether PJM still needs the additional authority. This is an operating test, not a forecast that the pressure ends on that date.
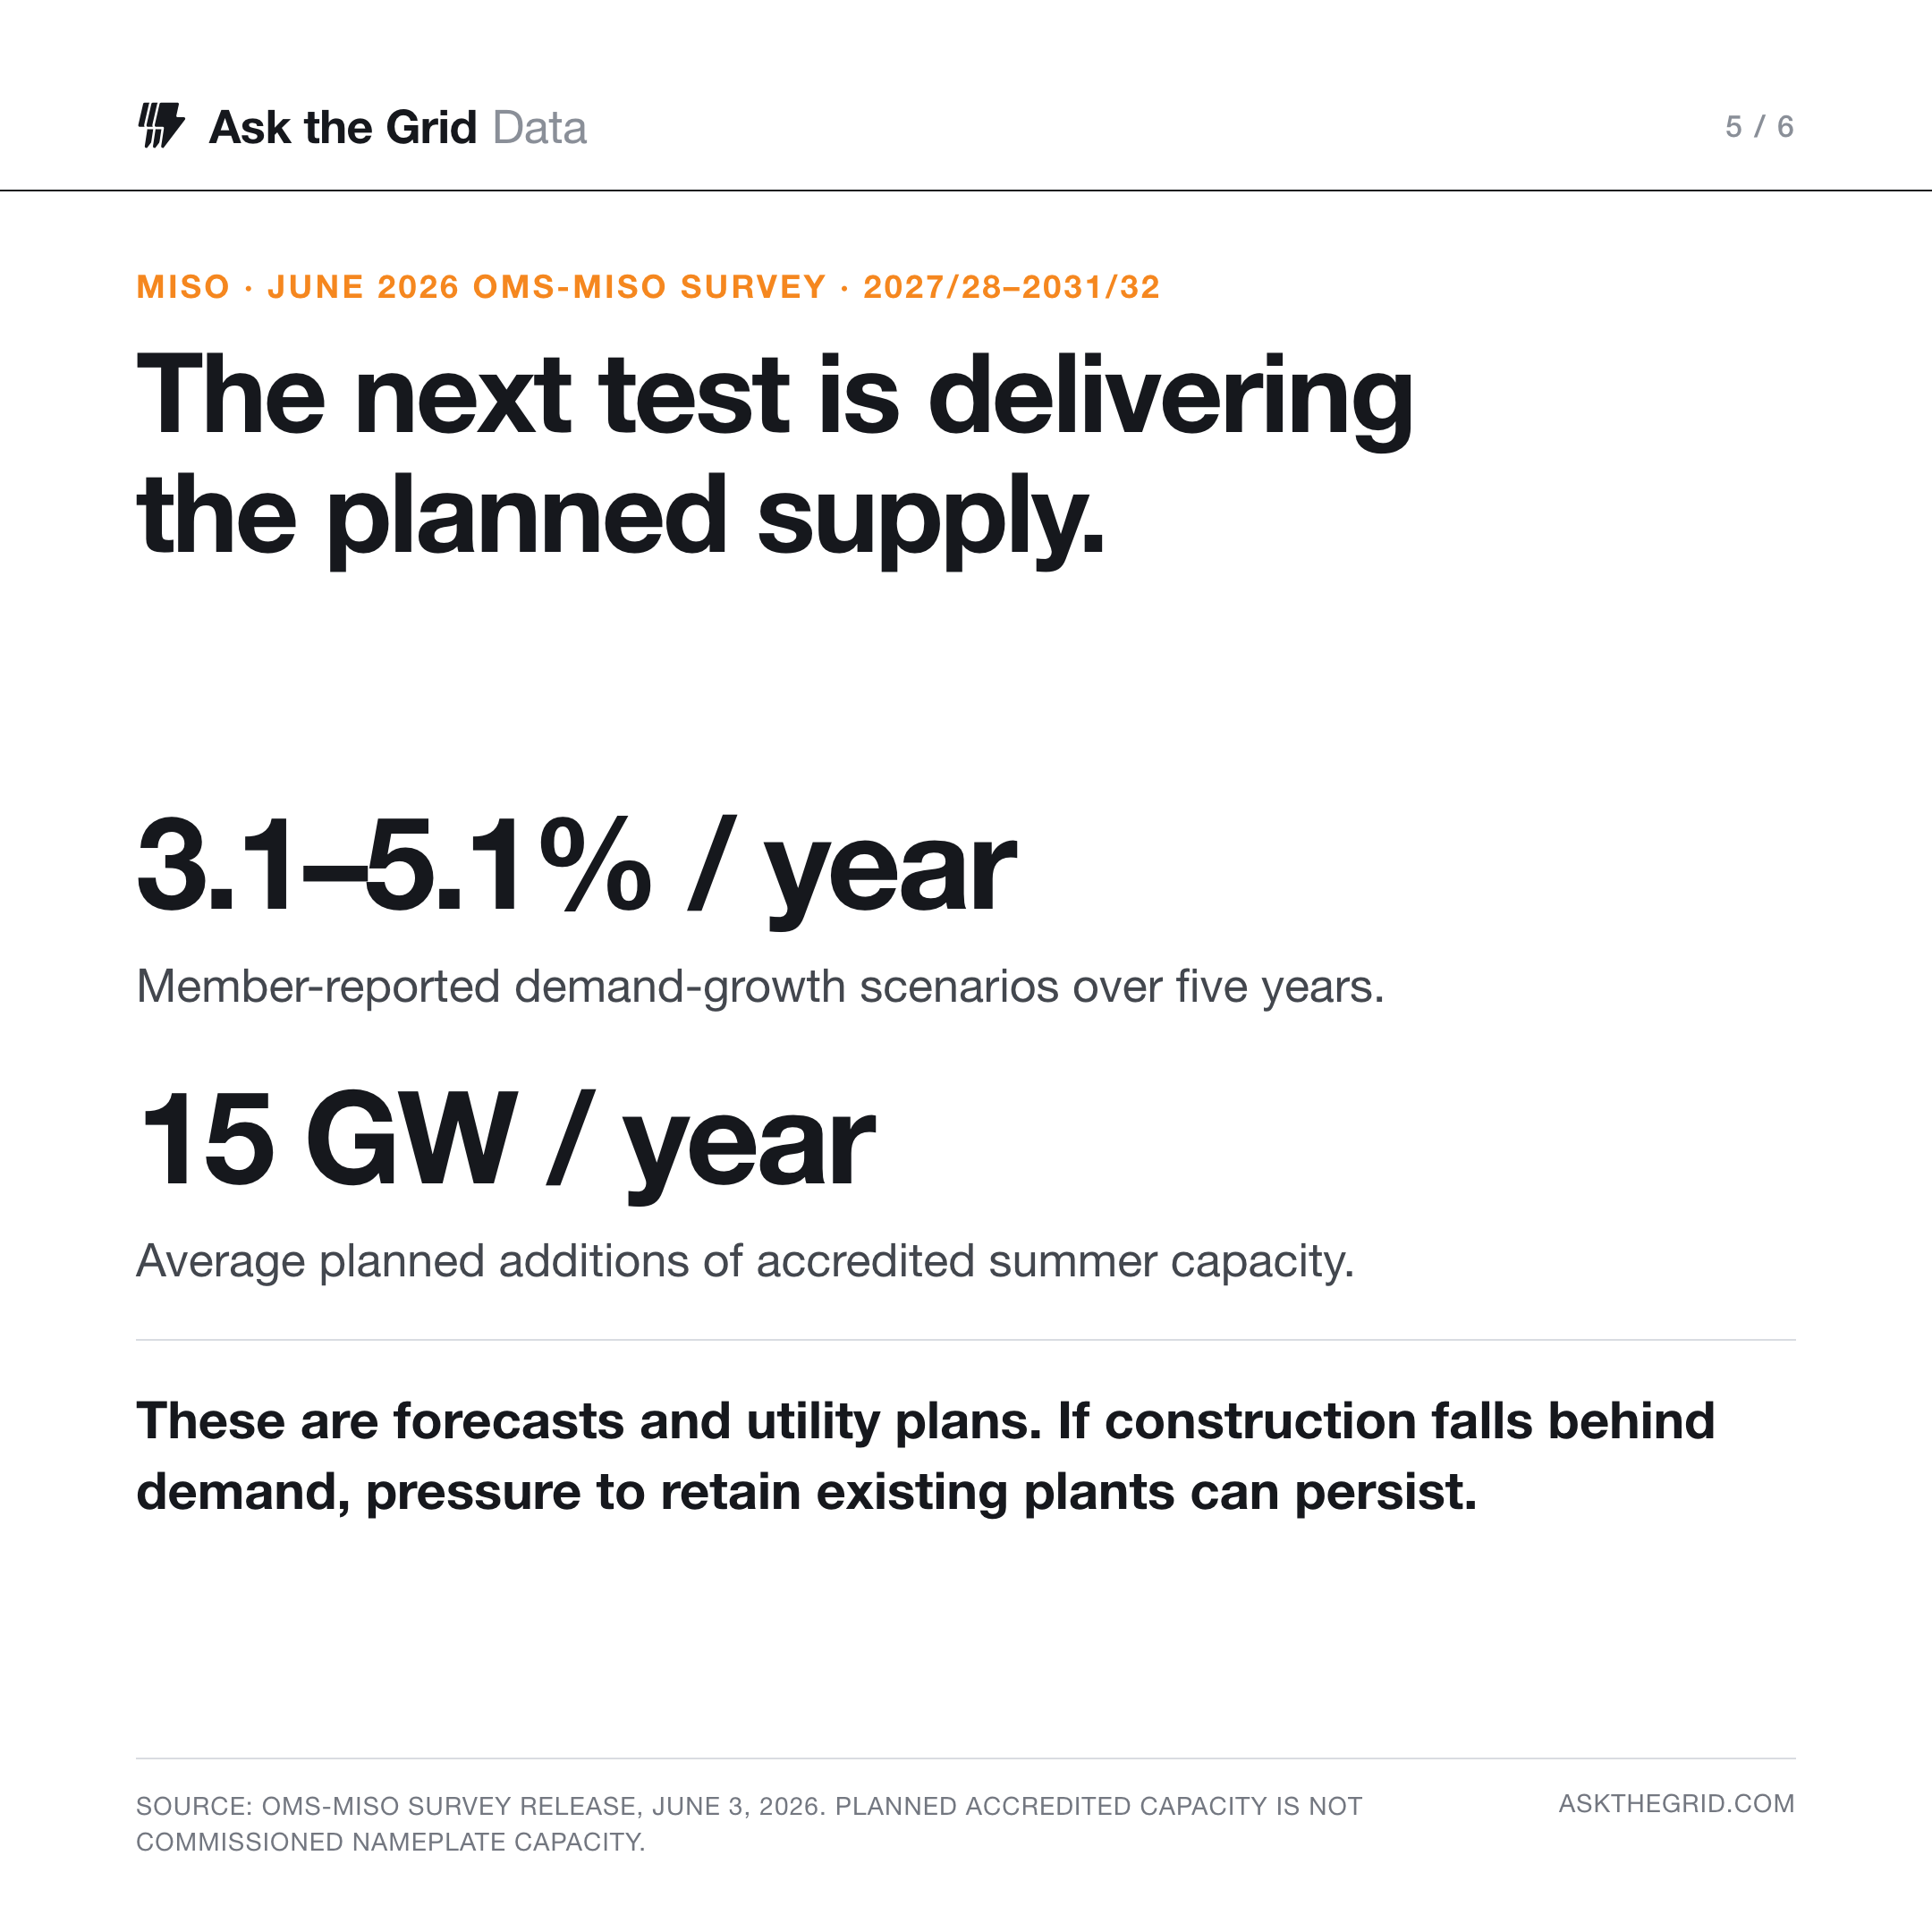
MISO's longer test is whether proposed supply arrives as demand grows. The June OMS-MISO survey reports five-year demand-growth scenarios of 3.1%–5.1% annually, alongside utility plans averaging 15 GW of new accredited summer capacity per year over its 2027/28–2031/32 horizon. Those are plans and forecasts. If construction falls behind, pressure to retain existing plants can persist; delivery would reduce that pressure. Commissioning, retirements and revised demand forecasts will tell us more than the next order announcement alone.
Follow PJM Radar, MISO Radar and the MISO Energy Wire. Our September demand-response reconstruction examines another episode of operating pressure.
Share the analysis#