SPP's Grid Emergency Looked Very Different East and West
A series of federal emergency orders covered one integrated market. Ask the Grid data shows two balancing areas, a $2,054/MWh marginal-energy divide, and a resource stack that changed shape daily.
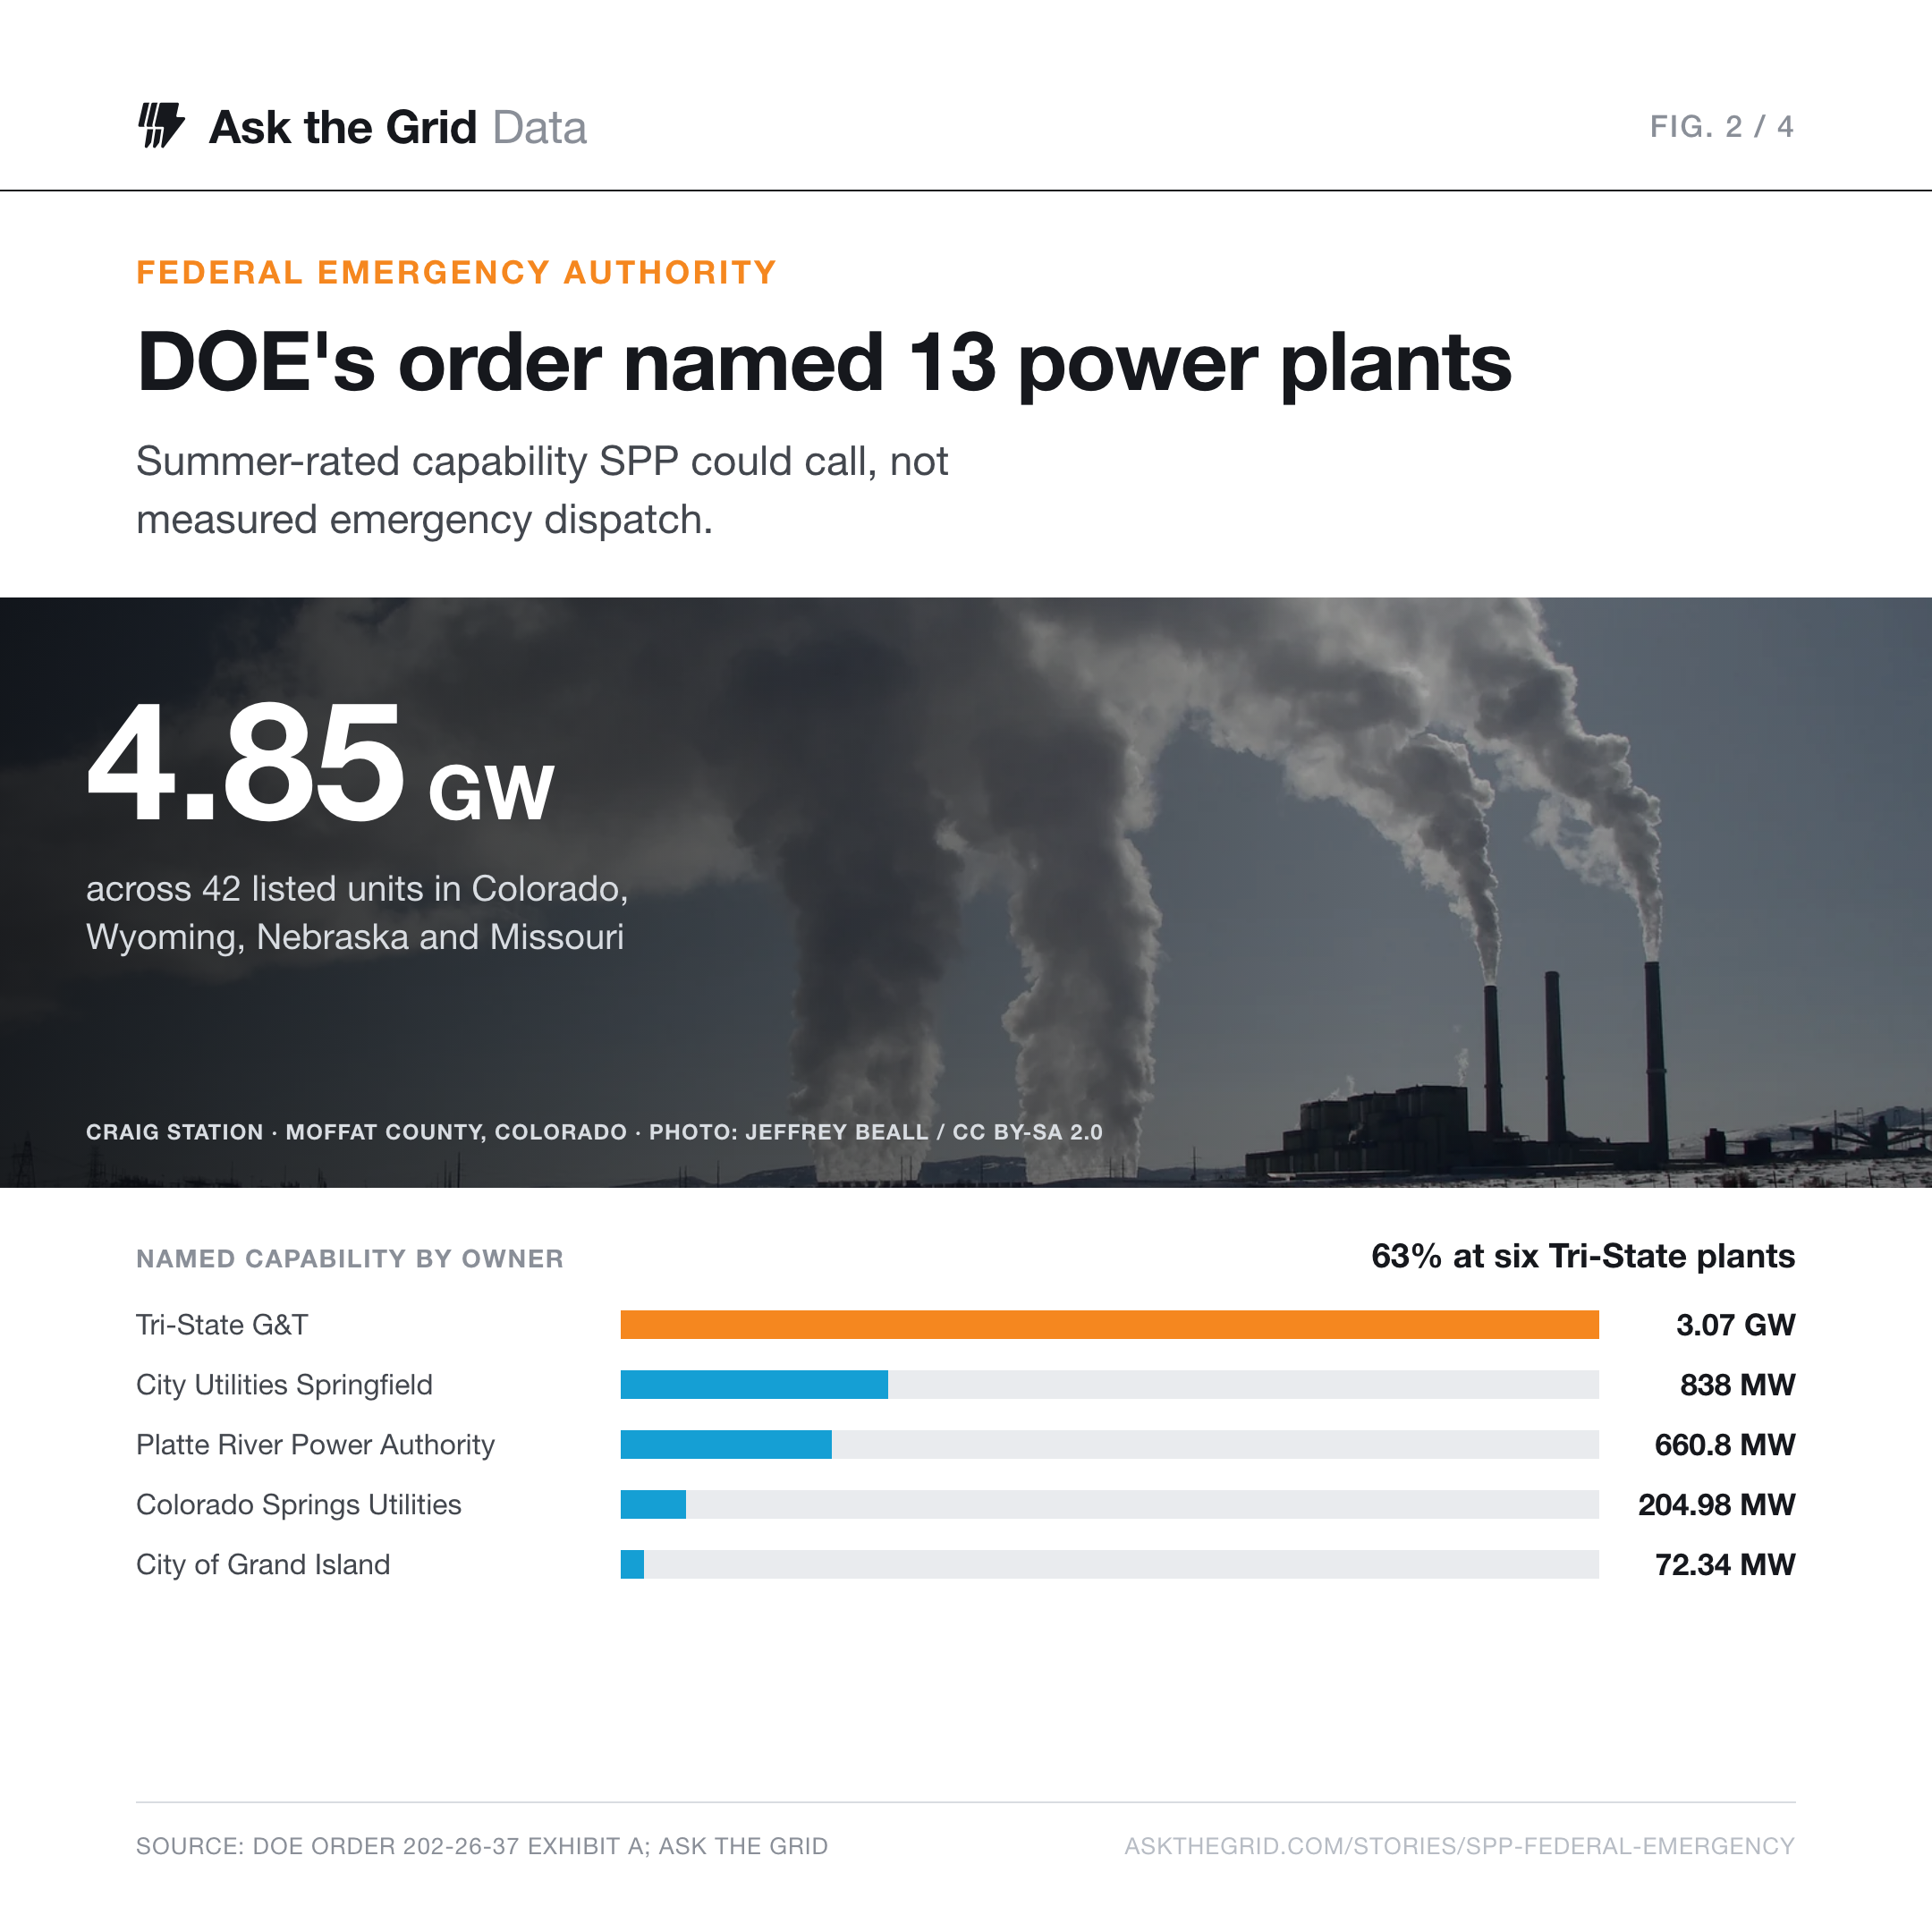
From July 19 through August 10, the Southwest Power Pool moved from conservative operations to its highest level of emergency, then through three phases of federal emergency authority. The headline number was 4,845 MW: the summer-rated capability of 42 generating units that the Department of Energy authorized SPP to call beyond specified operating or environmental limits.
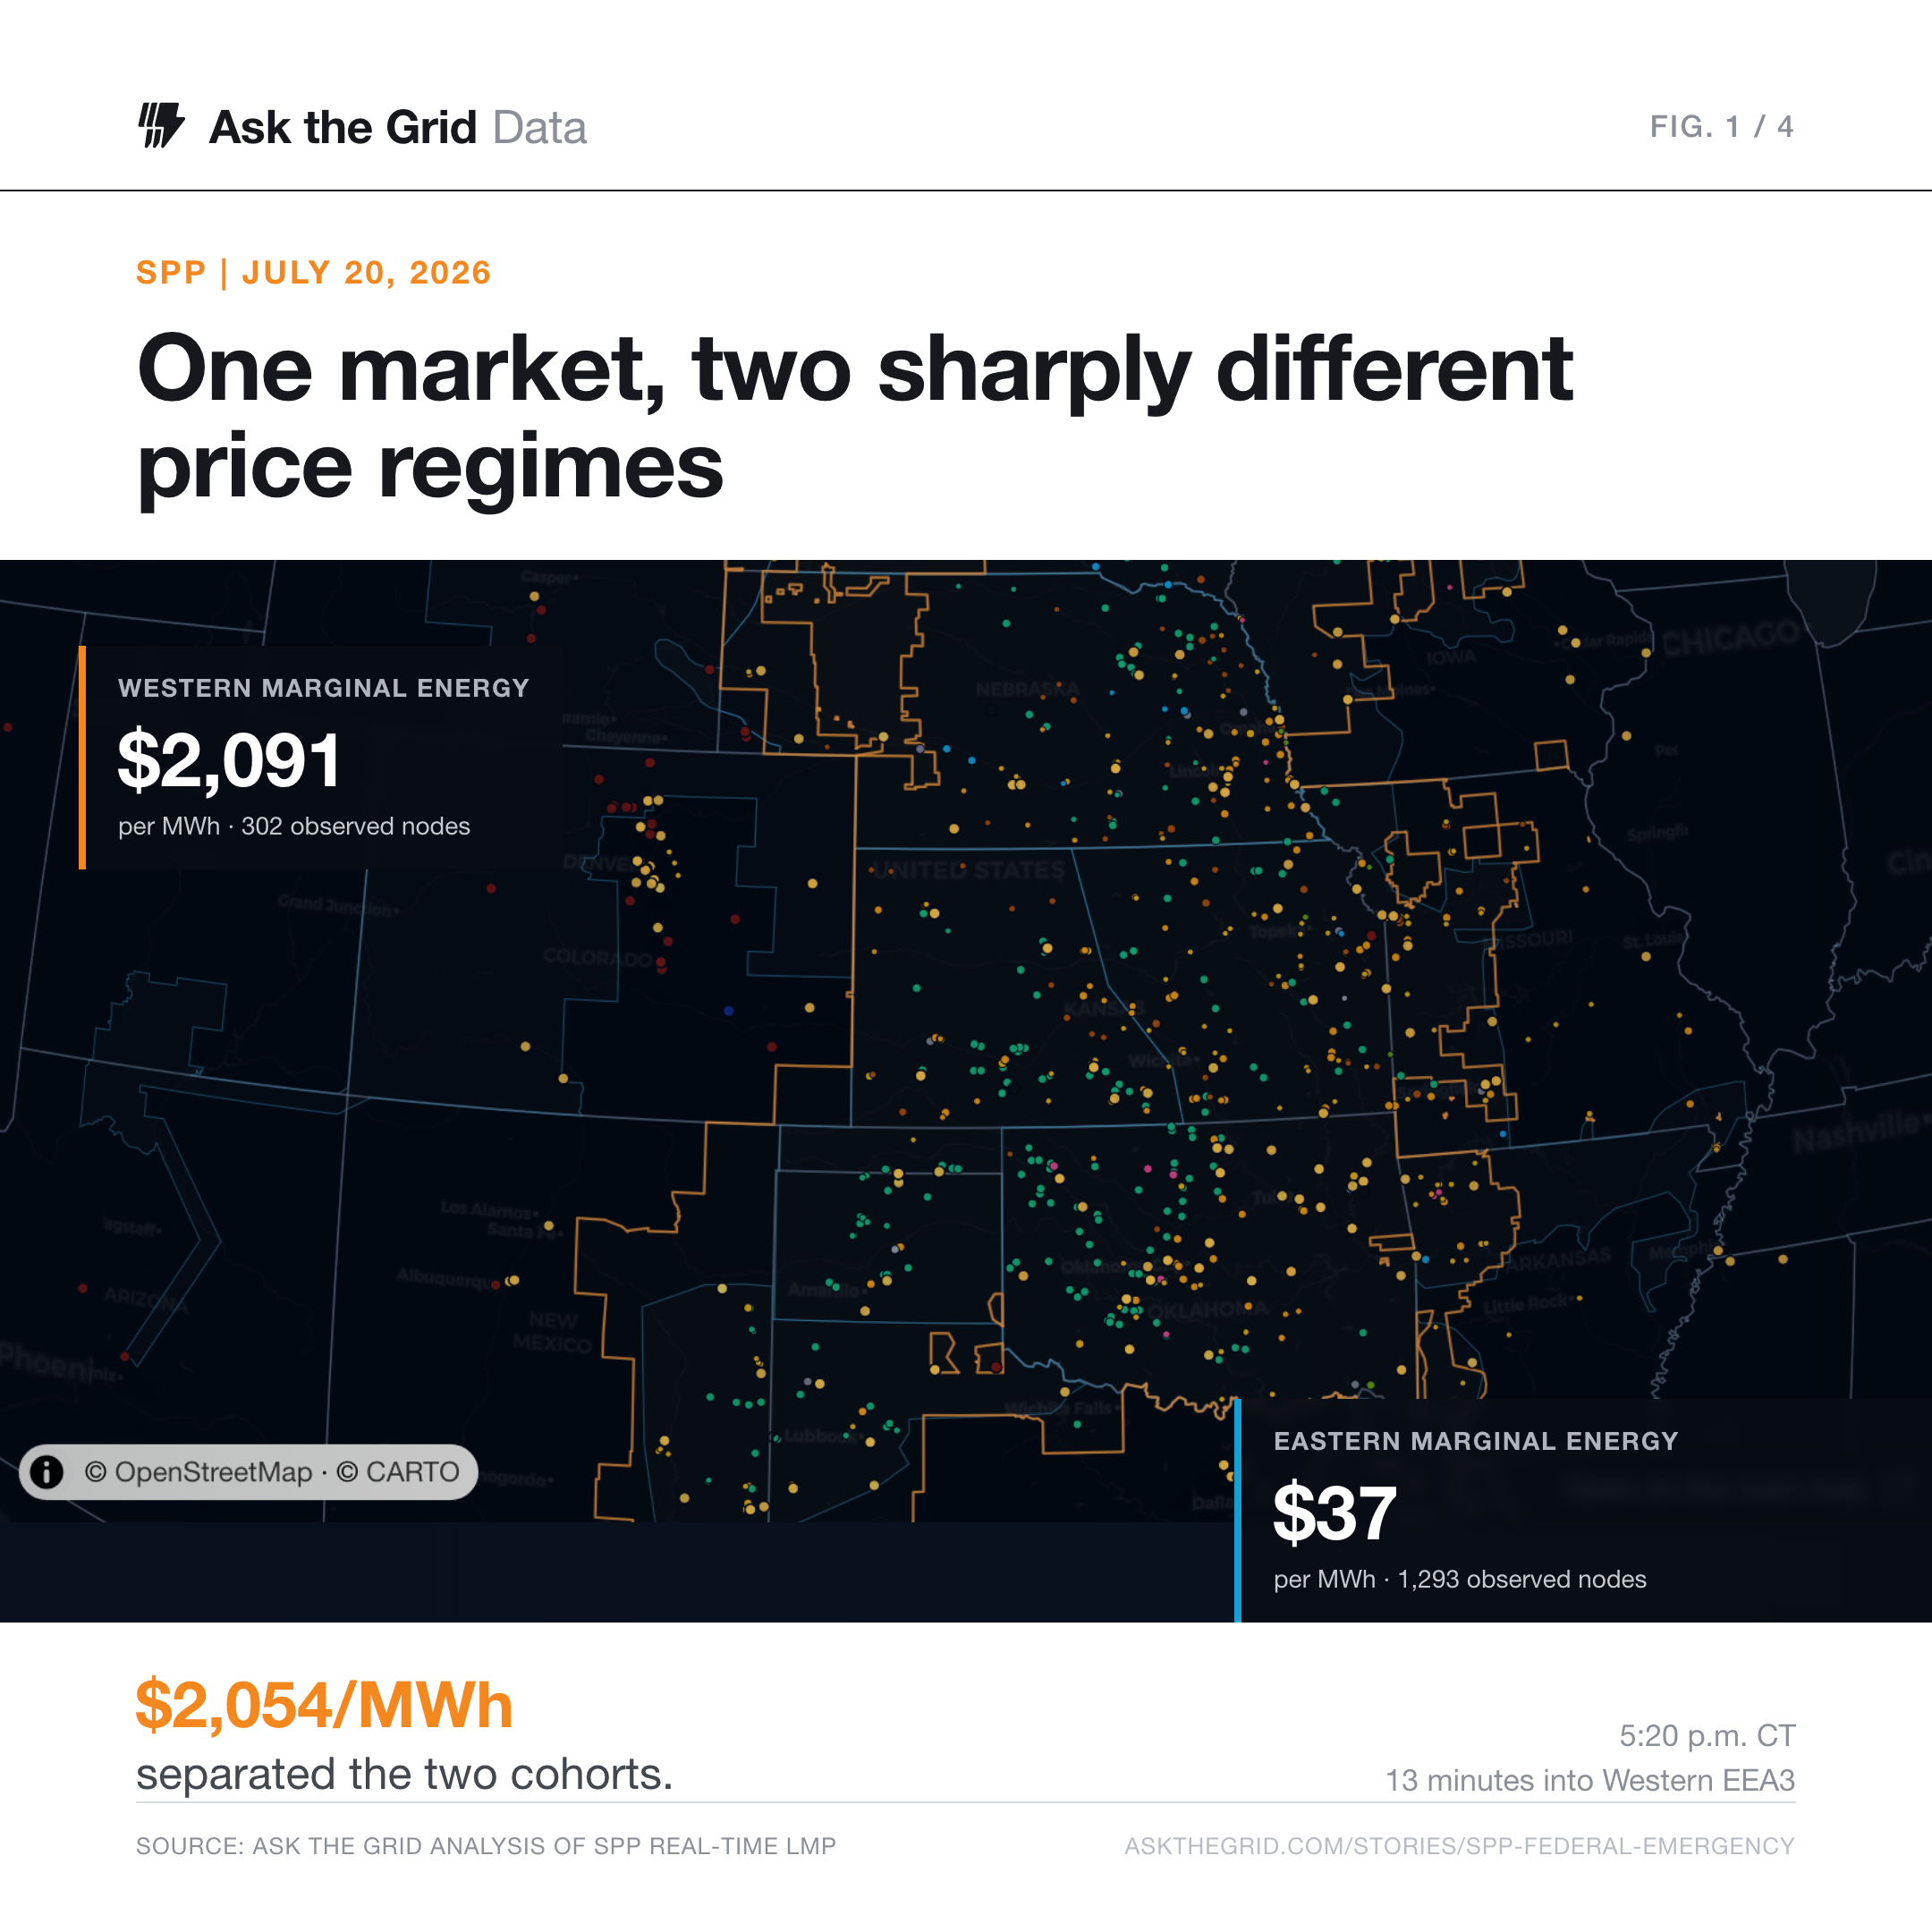
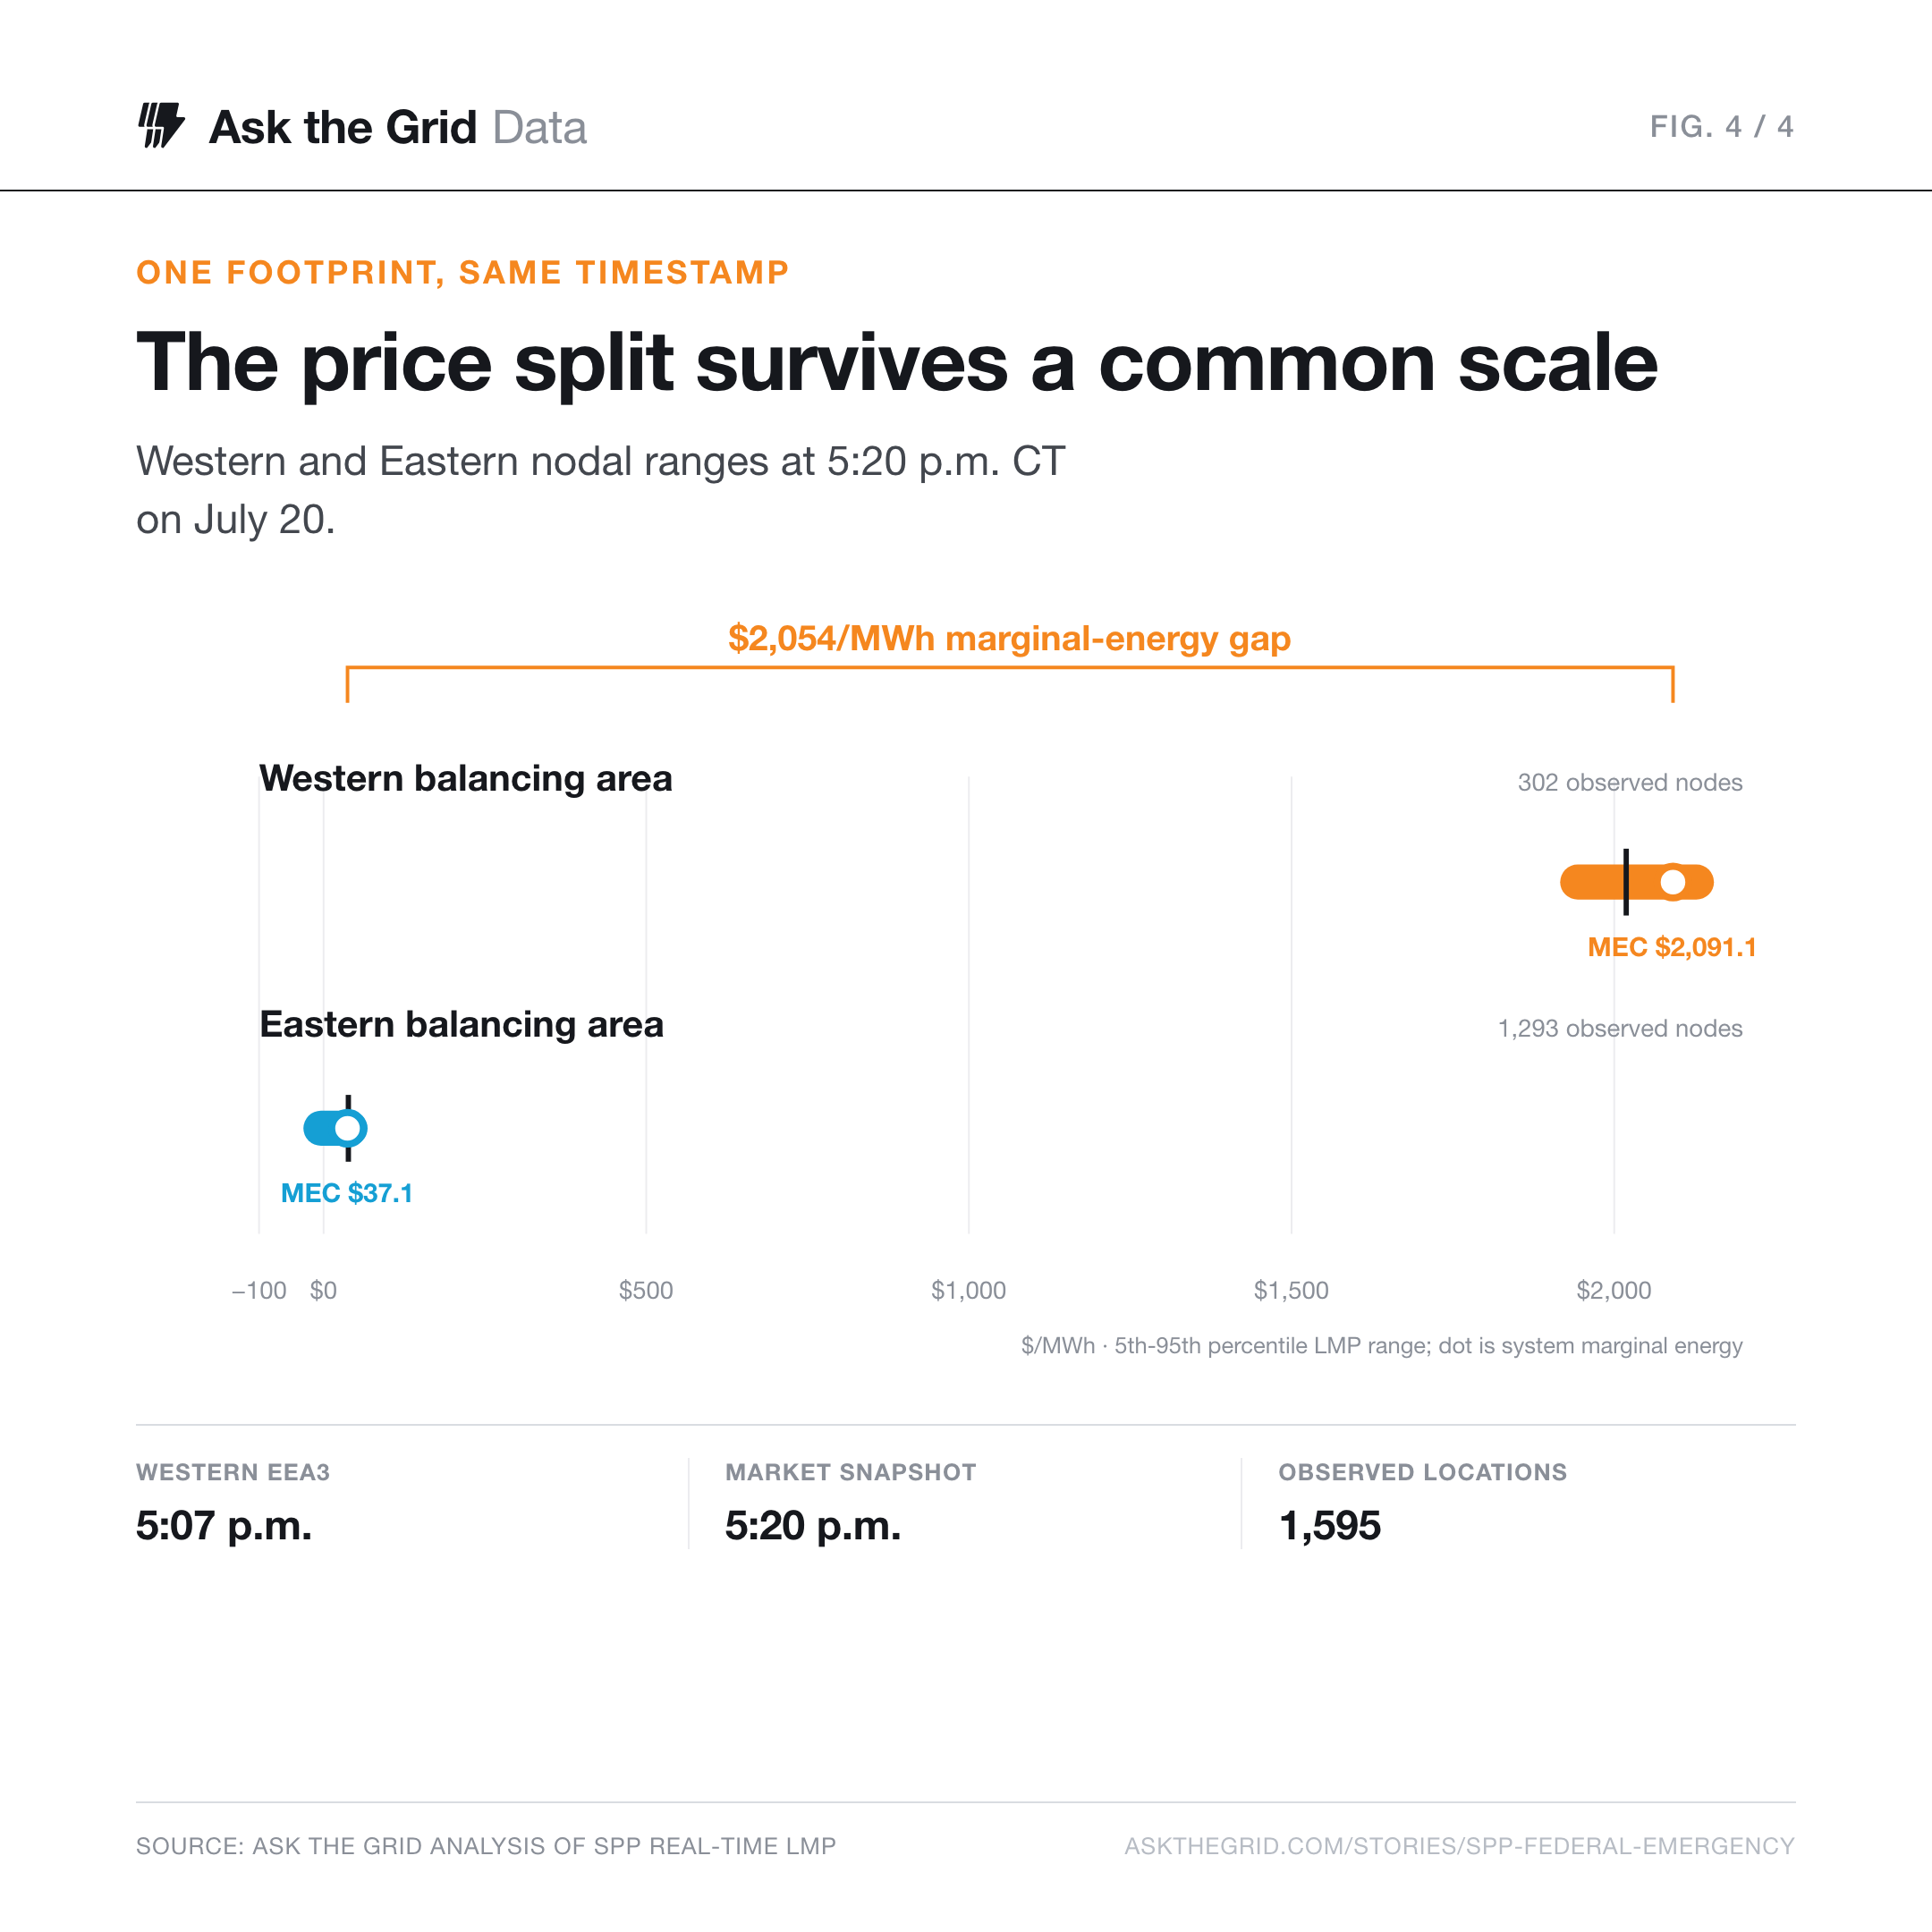
The more revealing number was $2,054/MWh. At 5:20 p.m. Central on July 20, during an Energy Emergency Alert 3 in SPP's Western balancing area, the system marginal-energy component was $2,091.10/MWh across 302 Western price locations and $37.10/MWh across 1,293 Eastern locations. One integrated market was producing two sharply different marginal-energy regimes.
The emergency started in the West#
SPP issued a conservative-operations advisory for its Western balancing area on July 19, effective July 20 at 11 a.m. Central. That afternoon, it escalated from an Energy Emergency Alert 1 at 4:38 p.m. to EEA3 at 5:07 p.m. EEA3 is SPP's highest emergency level: operating reserves had fallen below the required minimum, and firm-load interruption was possible. SPP later reported that it did not direct a controlled service interruption.
The factors SPP identified were familiar but simultaneous: high peak loads, widespread heat, generation outages, and low output from wind and other variable resources. Four days later, the West reached EEA2 again.
The price divide was energy, not congestion#
At the July 20 snapshot, the two node cohorts separate on SPP's system marginal-energy component. Their congestion components were not what created the $2,054/MWh divide. The Western balancing area was short enough that its marginal energy cleared above $2,000/MWh while the East remained near $37/MWh.
Nodal prices within each balancing area still varied. The middle 90% of Western LMPs ran from $1,943.50 to $2,127.30/MWh. In the East, the same range ran from -$4 to $41/MWh. Treating either value as an SPP-wide price would erase the operational boundary that mattered most that afternoon.
The resource stack kept changing#
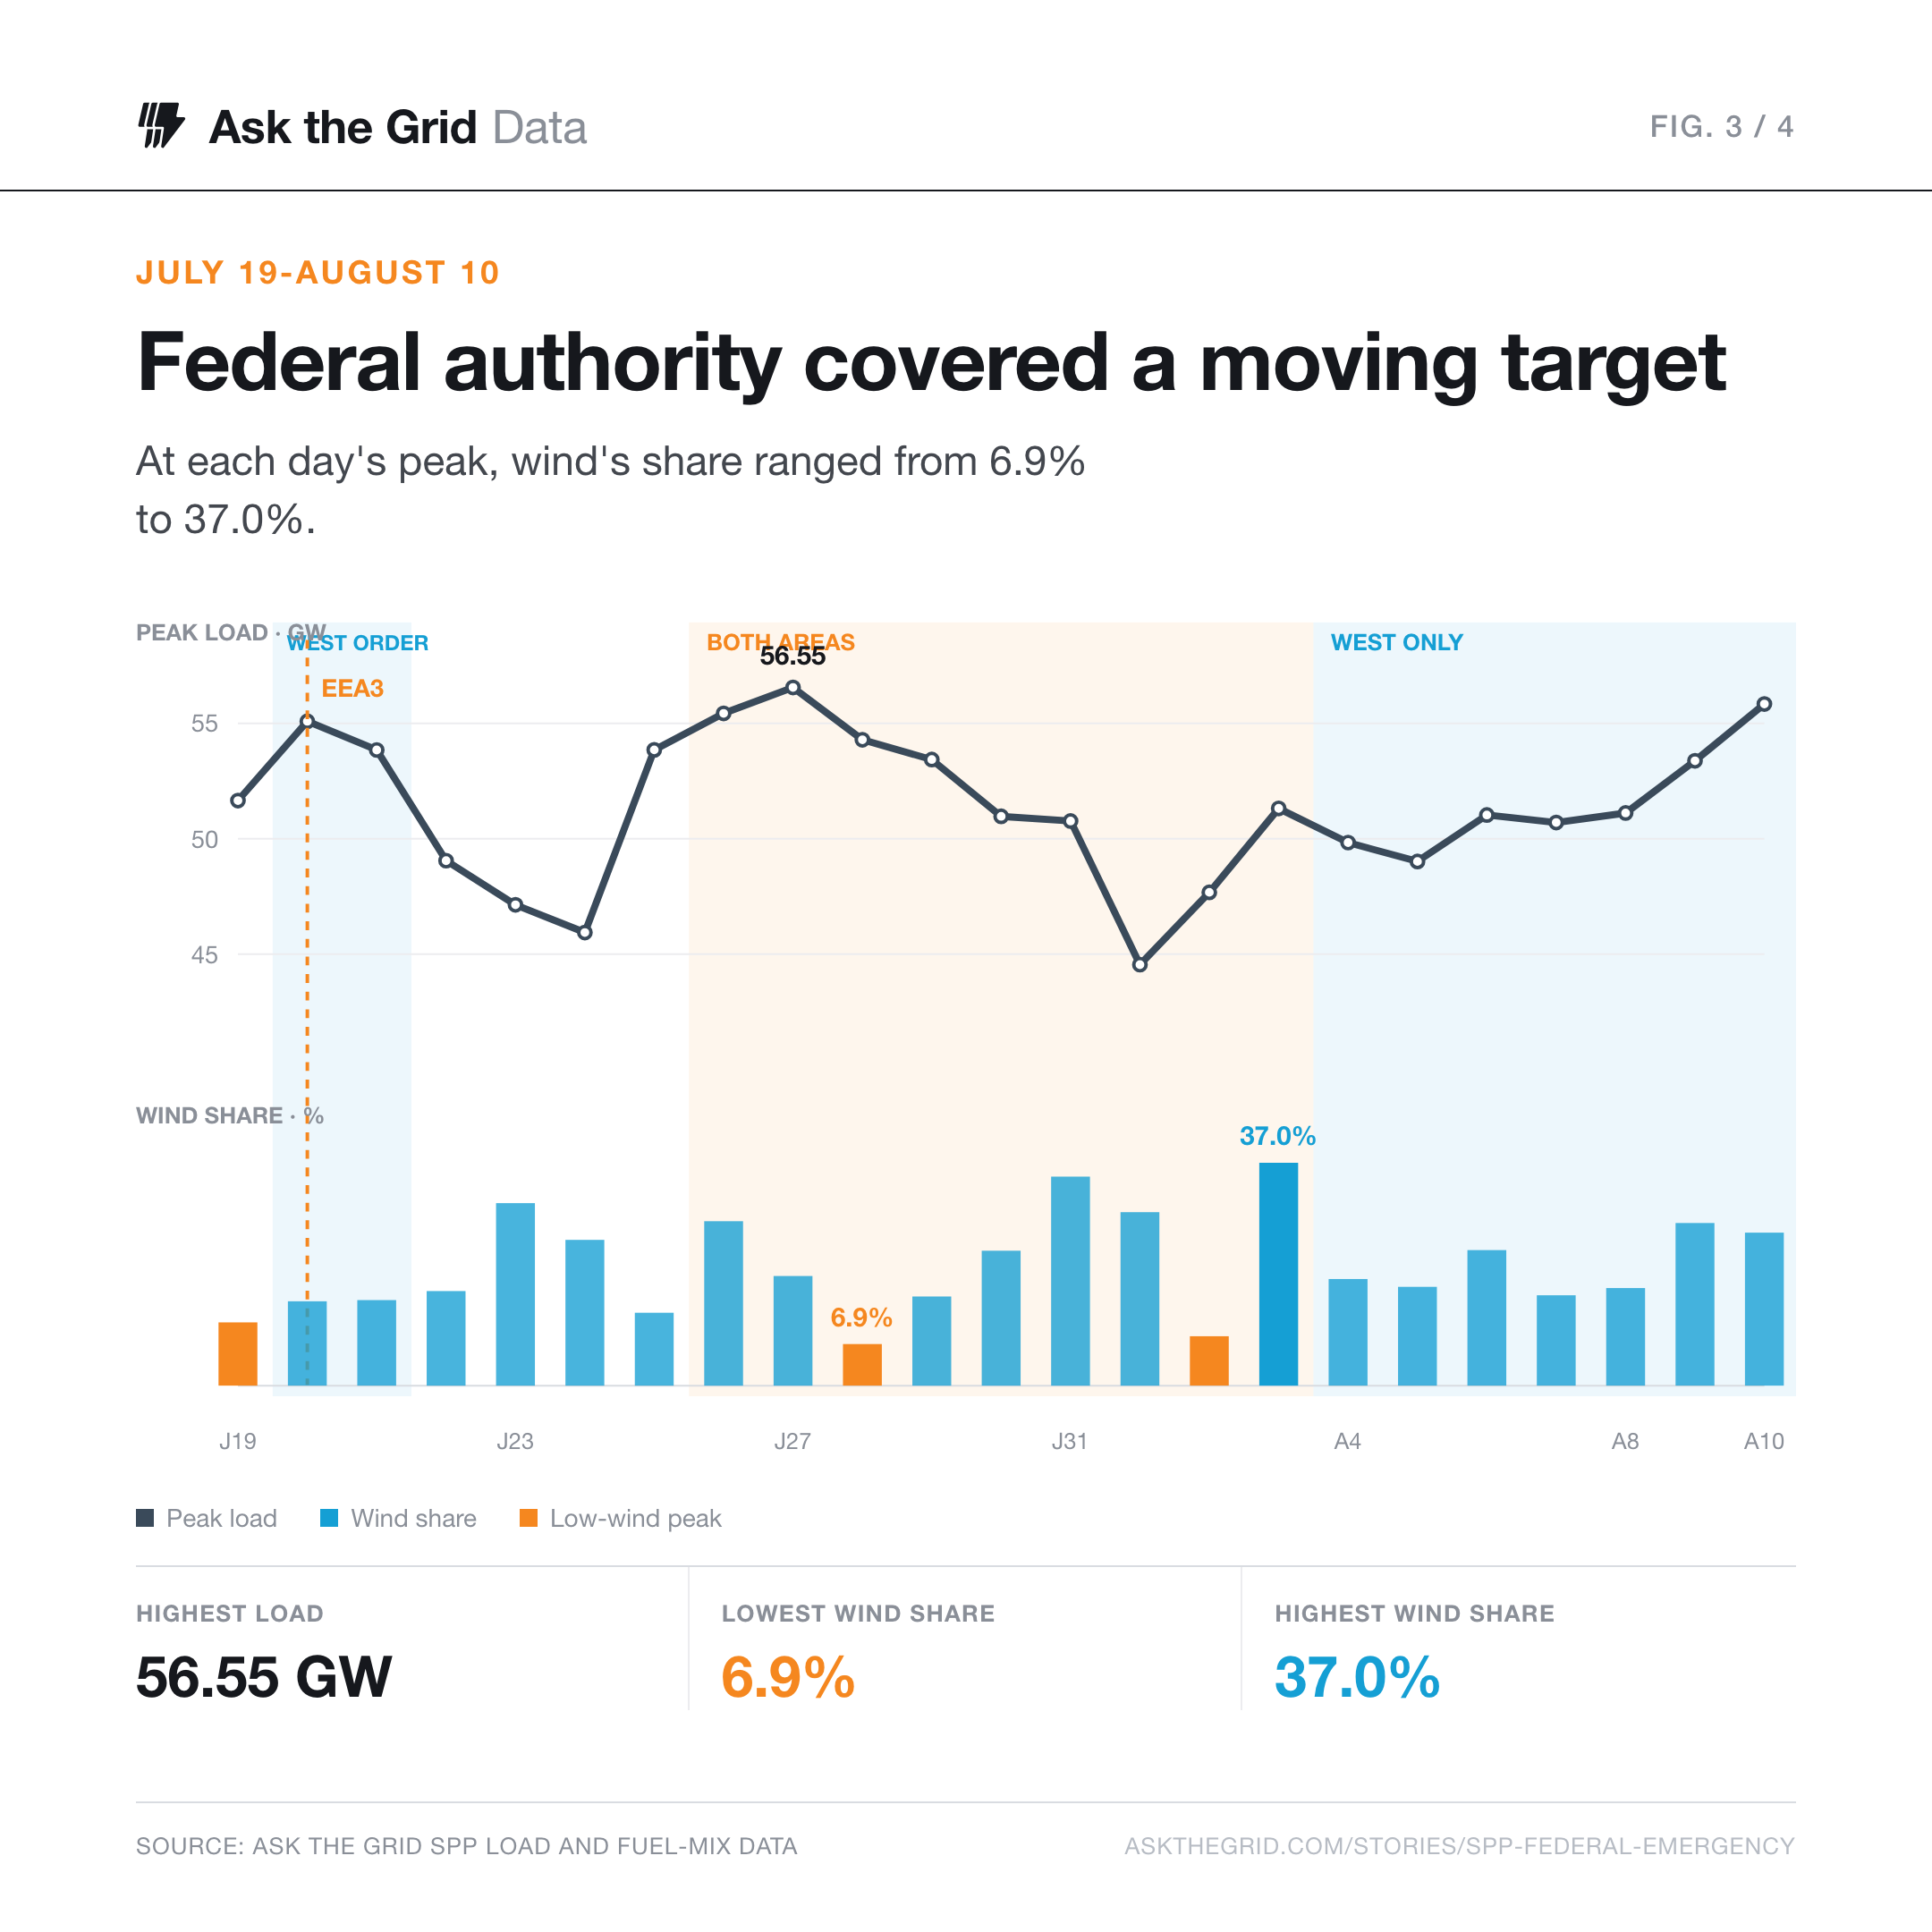
The first federal order was West-only on July 20. A July 26 order expanded the authority to both balancing areas; its August 4 extension returned to the West alone. The highest five-minute load during the July 26-August 3 order was 56,553 MW on July 27. That was not the day with the least wind. At the daily peak, wind supplied 10,309 MW, or 18.2% of load.
One day later, load was slightly lower at 54,286 MW, but wind output at the peak fell to 3,727 MW. Gas rose to 28,348 MW and coal to 15,637 MW. On August 3, the final day of the both-area order, wind supplied 18,978 MW, or 37% of peak load. The emergency authority was a contingency tool across a volatile period, not evidence that the system was equally scarce every hour.
The order named a concentrated plant portfolio#
DOE's July 26 resource exhibit listed 42 units at 13 physical sites in Colorado, Wyoming, Nebraska and Missouri. Six Tri-State Generation and Transmission plants accounted for 3,069 MW, 63% of the summer-rated capability on the list. Laramie River Station and Craig Station together represented half of the total.
Those megawatts describe the units SPP was authorized to dispatch under the order. They are not a measure of how much emergency generation ran. DOE required SPP to submit daily notices identifying every specified resource that used the order's allowances. As of publication, the public DOE page contained no daily notices identifying an activated resource.
Backup generation was authorized, not documented as used#
The order contained a separate provision for data centers, hyperscalers and other large industrial or commercial loads. SPP could direct auxiliary, standby, battery or other backup generation resources at those sites to operate as a last resort before EEA3, or during EEA3, when needed to maintain reliability. Critical facilities were excluded.
That provision turned behind-the-meter flexibility into an explicit reliability resource. It did not establish that a data center started a generator. The order required daily reporting for any backup resource that used the authority. As of publication, the public DOE page contained no daily notices identifying an activated backup resource.
The distinction matters for operators. A large load's location, telemetry, curtailment rights, transfer sequence, on-site fuel and emissions limits are no longer peripheral facility details when an operator can call that flexibility in an emergency. SPP is implementing its accelerated High Impact Large Load process. The July orders show the operational terms that will determine whether a project is merely large or genuinely useful to the grid.
What decision-makers should take from July#
For large-load developers, the commercial value of flexibility depends on where the project connects and whether SPP can observe and control it. A curtailment promise without telemetry, fuel assurance or enforceable operating rights is not the same resource during an EEA3.
For generators, the order's list is a map of locational reliability value. Summer capability, environmental constraints and startup availability can matter more than annual energy production during a short emergency window.
For SPP and regulators, East and West need to be evaluated as distinct operating systems even when they share an organization. Publishing the required daily resource notices would show which federal allowances were actually used and which remained insurance.
Ask the Grid analyzed deduplicated five-minute system load, fuel mix and real-time nodal prices from July 19 through August 10. Daily peak fuel mixes use the latest ingested observation for each timestamp. The July 20 price snapshot contains 1,595 locations and separates the two published marginal-energy components before calculating each cohort's LMP distribution. DOE resource totals use summer ratings in the July 26 exhibit; dual-fuel rows are counted once.
The figures are frozen at publication. Open SPP on the live map to inspect current plants, prices and grid conditions.