North Plains Connector Advances Toward Linking Two Divided Power Markets
DOE and Montana DEQ released the Final Environmental Impact Statement for a 3,000 MW line between the Eastern and Western grids. Across 14,511 matched hours, two Montana nodes about 120 miles apart on opposite sides of that boundary had weakly correlated hourly prices.
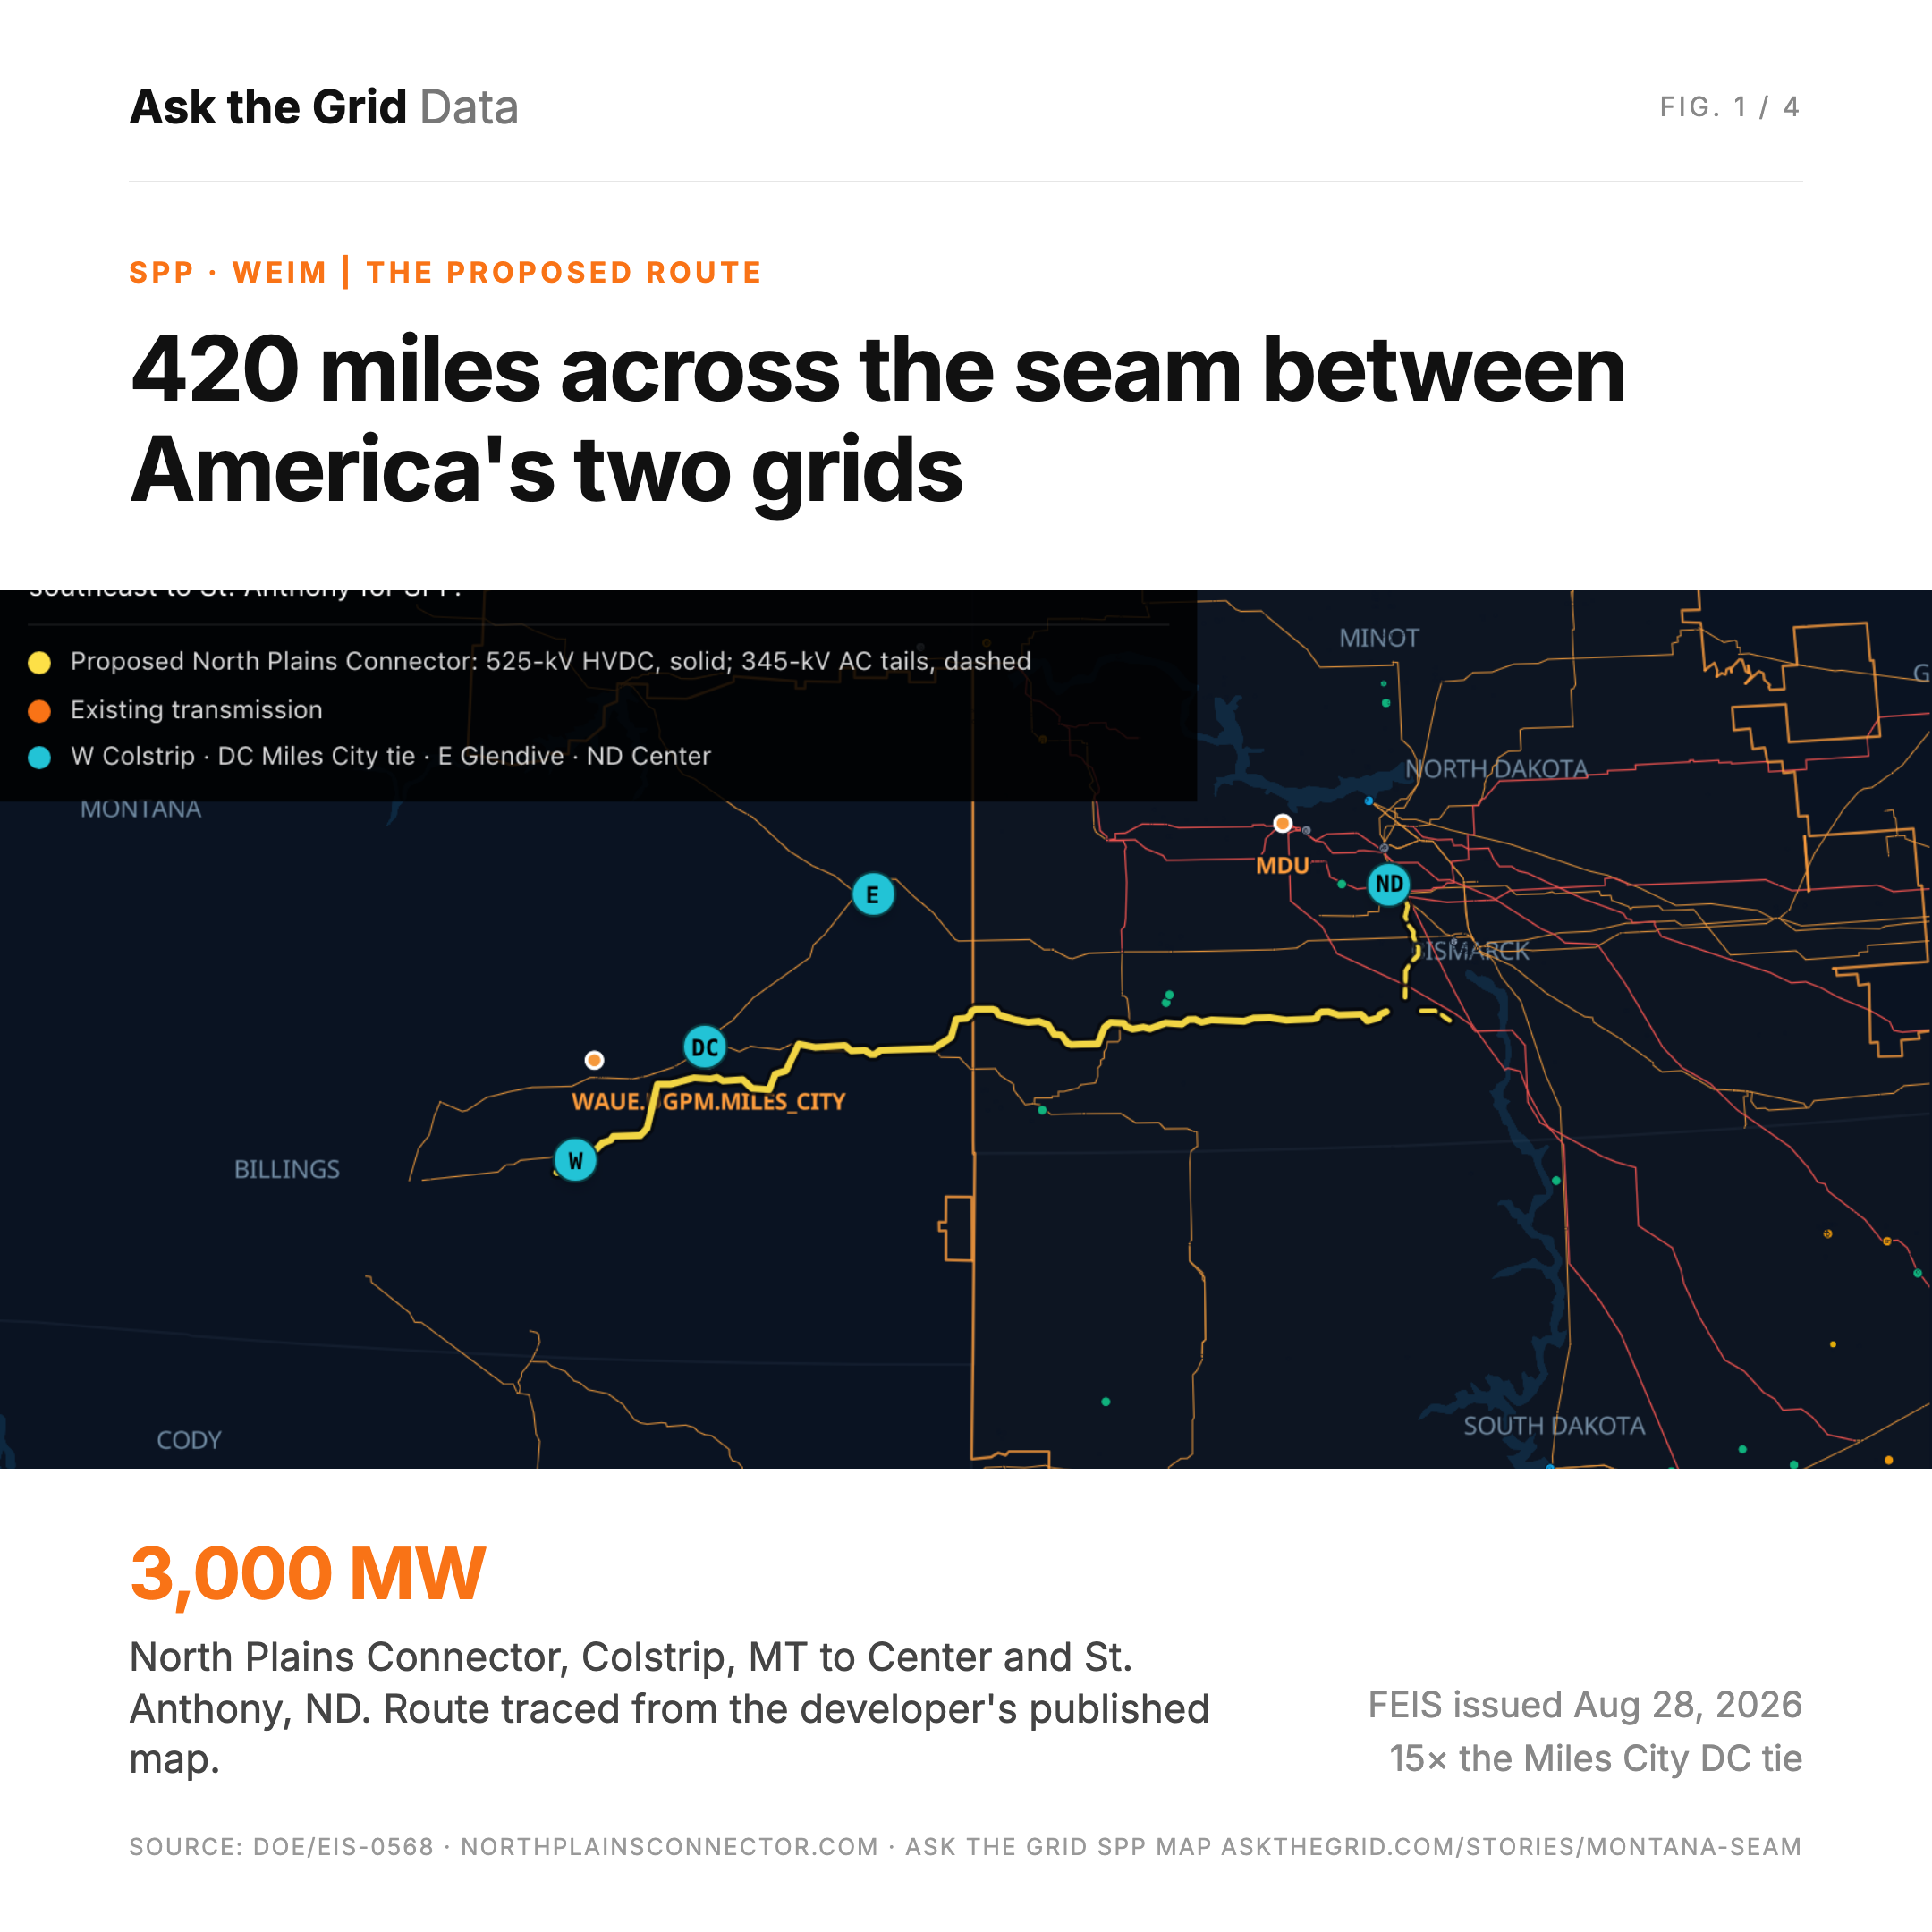
On August 28, the U.S. Department of Energy and the Montana Department of Environmental Quality released the Final Environmental Impact Statement for the North Plains Connector: a 420-mile, up-to-525-kV high-voltage direct-current line from a substation near Colstrip, Montana to two connection points in North Dakota, near Center and St. Anthony. The headline number is 3,000 MW of bidirectional transfer between the Eastern and Western Interconnections.
The more revealing number is 0.102. That is the correlation between hourly real-time prices at Colstrip and at Glendive, Montana, 124 miles to the northeast. Ask the Grid matched 14,511 hours across the two nodes from January 2025 through August 2026. Colstrip is priced in CAISO's Western Energy Imbalance Market; Glendive is priced in SPP. Against a Northern California trading hub more than 900 miles away, Colstrip correlates at 0.612; against Glendive, at 0.102. The two Montana nodes sit on opposite sides of the interconnection boundary the proposed line would cross.
The FEIS is a permitting step, not a shovel#
Grid United and ALLETE are the joint developers. The project is described as an approximately $6 billion investment, up from the $2.5 billion estimate in the 2023 development agreement. Major construction is expected to begin in 2028 and service in 2032. The FEIS closes the federal and state environmental review; it is not a Record of Decision, a financing award or a construction start.
What the connector would join is unusual by the standards of transmission projects. The United States runs on three largely independent alternating-current systems, and they cannot be tied together directly because they do not run in synchrony. Power crosses between the Eastern and Western Interconnections only through back-to-back DC converter stations. In Montana there is exactly one, the Western Area Power Administration's Miles City station, rated at up to 200 MW. Nationally, seven such links carry a combined 1,320 MW.
How wide the price gap became#
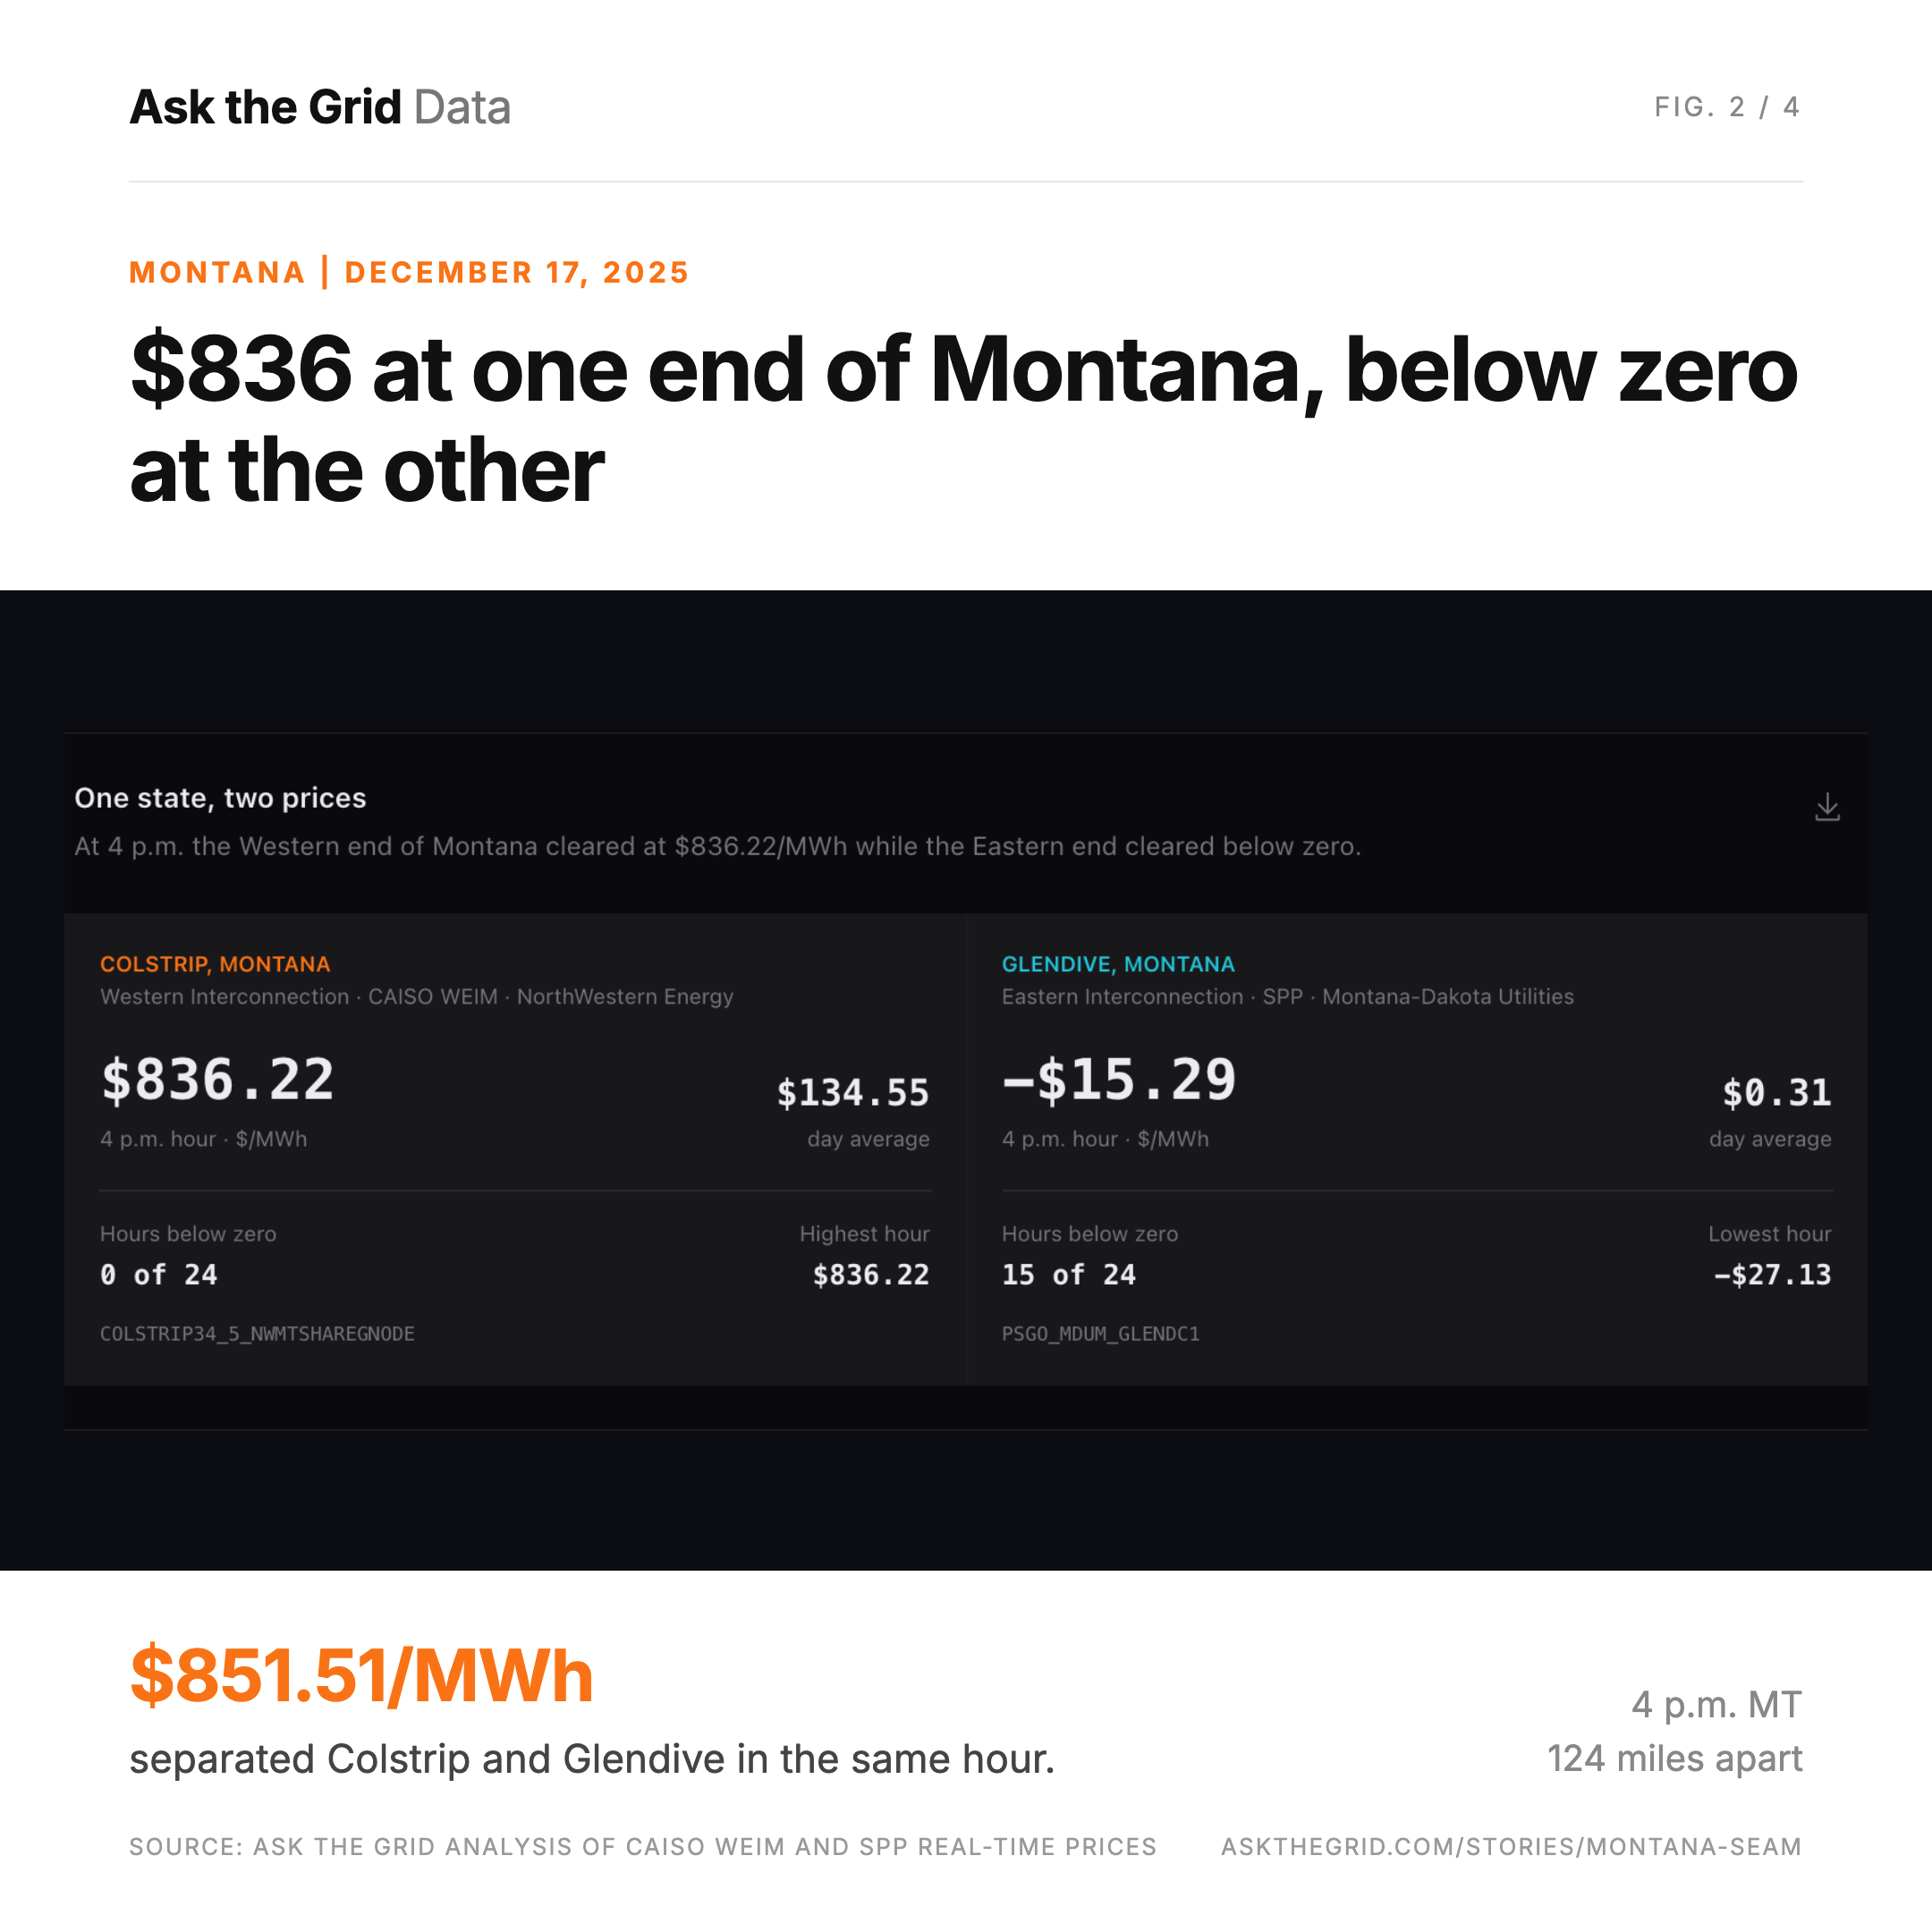
At 4 p.m. Mountain Time on December 17, 2025, the Colstrip node cleared at $836.22/MWh. In the same hour Glendive cleared at -$15.29/MWh: generators there were paying to keep producing. Across the Mountain-Time day, Colstrip averaged $134.55/MWh and Glendive averaged 31 cents. Glendive settled below zero in 15 of 24 hours.
The hourly gap reached $851.51/MWh at 4 p.m., the widest in the January 2025–August 2026 comparison. Colstrip rose sharply during the evening while Glendive remained at or below zero for much of the day, illustrating the different market conditions on the two sides of the seam.
Distance is not the explanation#
A price gap 120 miles wide can have ordinary causes: a binding constraint, an outage, a unit tripping. To separate those from the seam, Ask the Grid ran the same hourly correlation on six other pairs — two inside the Eastern Interconnection, two inside the Western, two more that cross the boundary. The Eastern comparators are Thunder Spirit Wind in North Dakota and the SPP North hub; the Western ones are CAISO's NP15 trading hub and the NorthWestern/Bonneville interface.
The comparison follows the interconnection boundary more closely than distance. Two Eastern nodes correlate at 0.958, while Colstrip and the distant NP15 hub correlate at 0.612. Colstrip and nearby Glendive correlate at 0.102. Across the tested pairs, prices on opposite sides were consistently less coupled than prices within either interconnection.
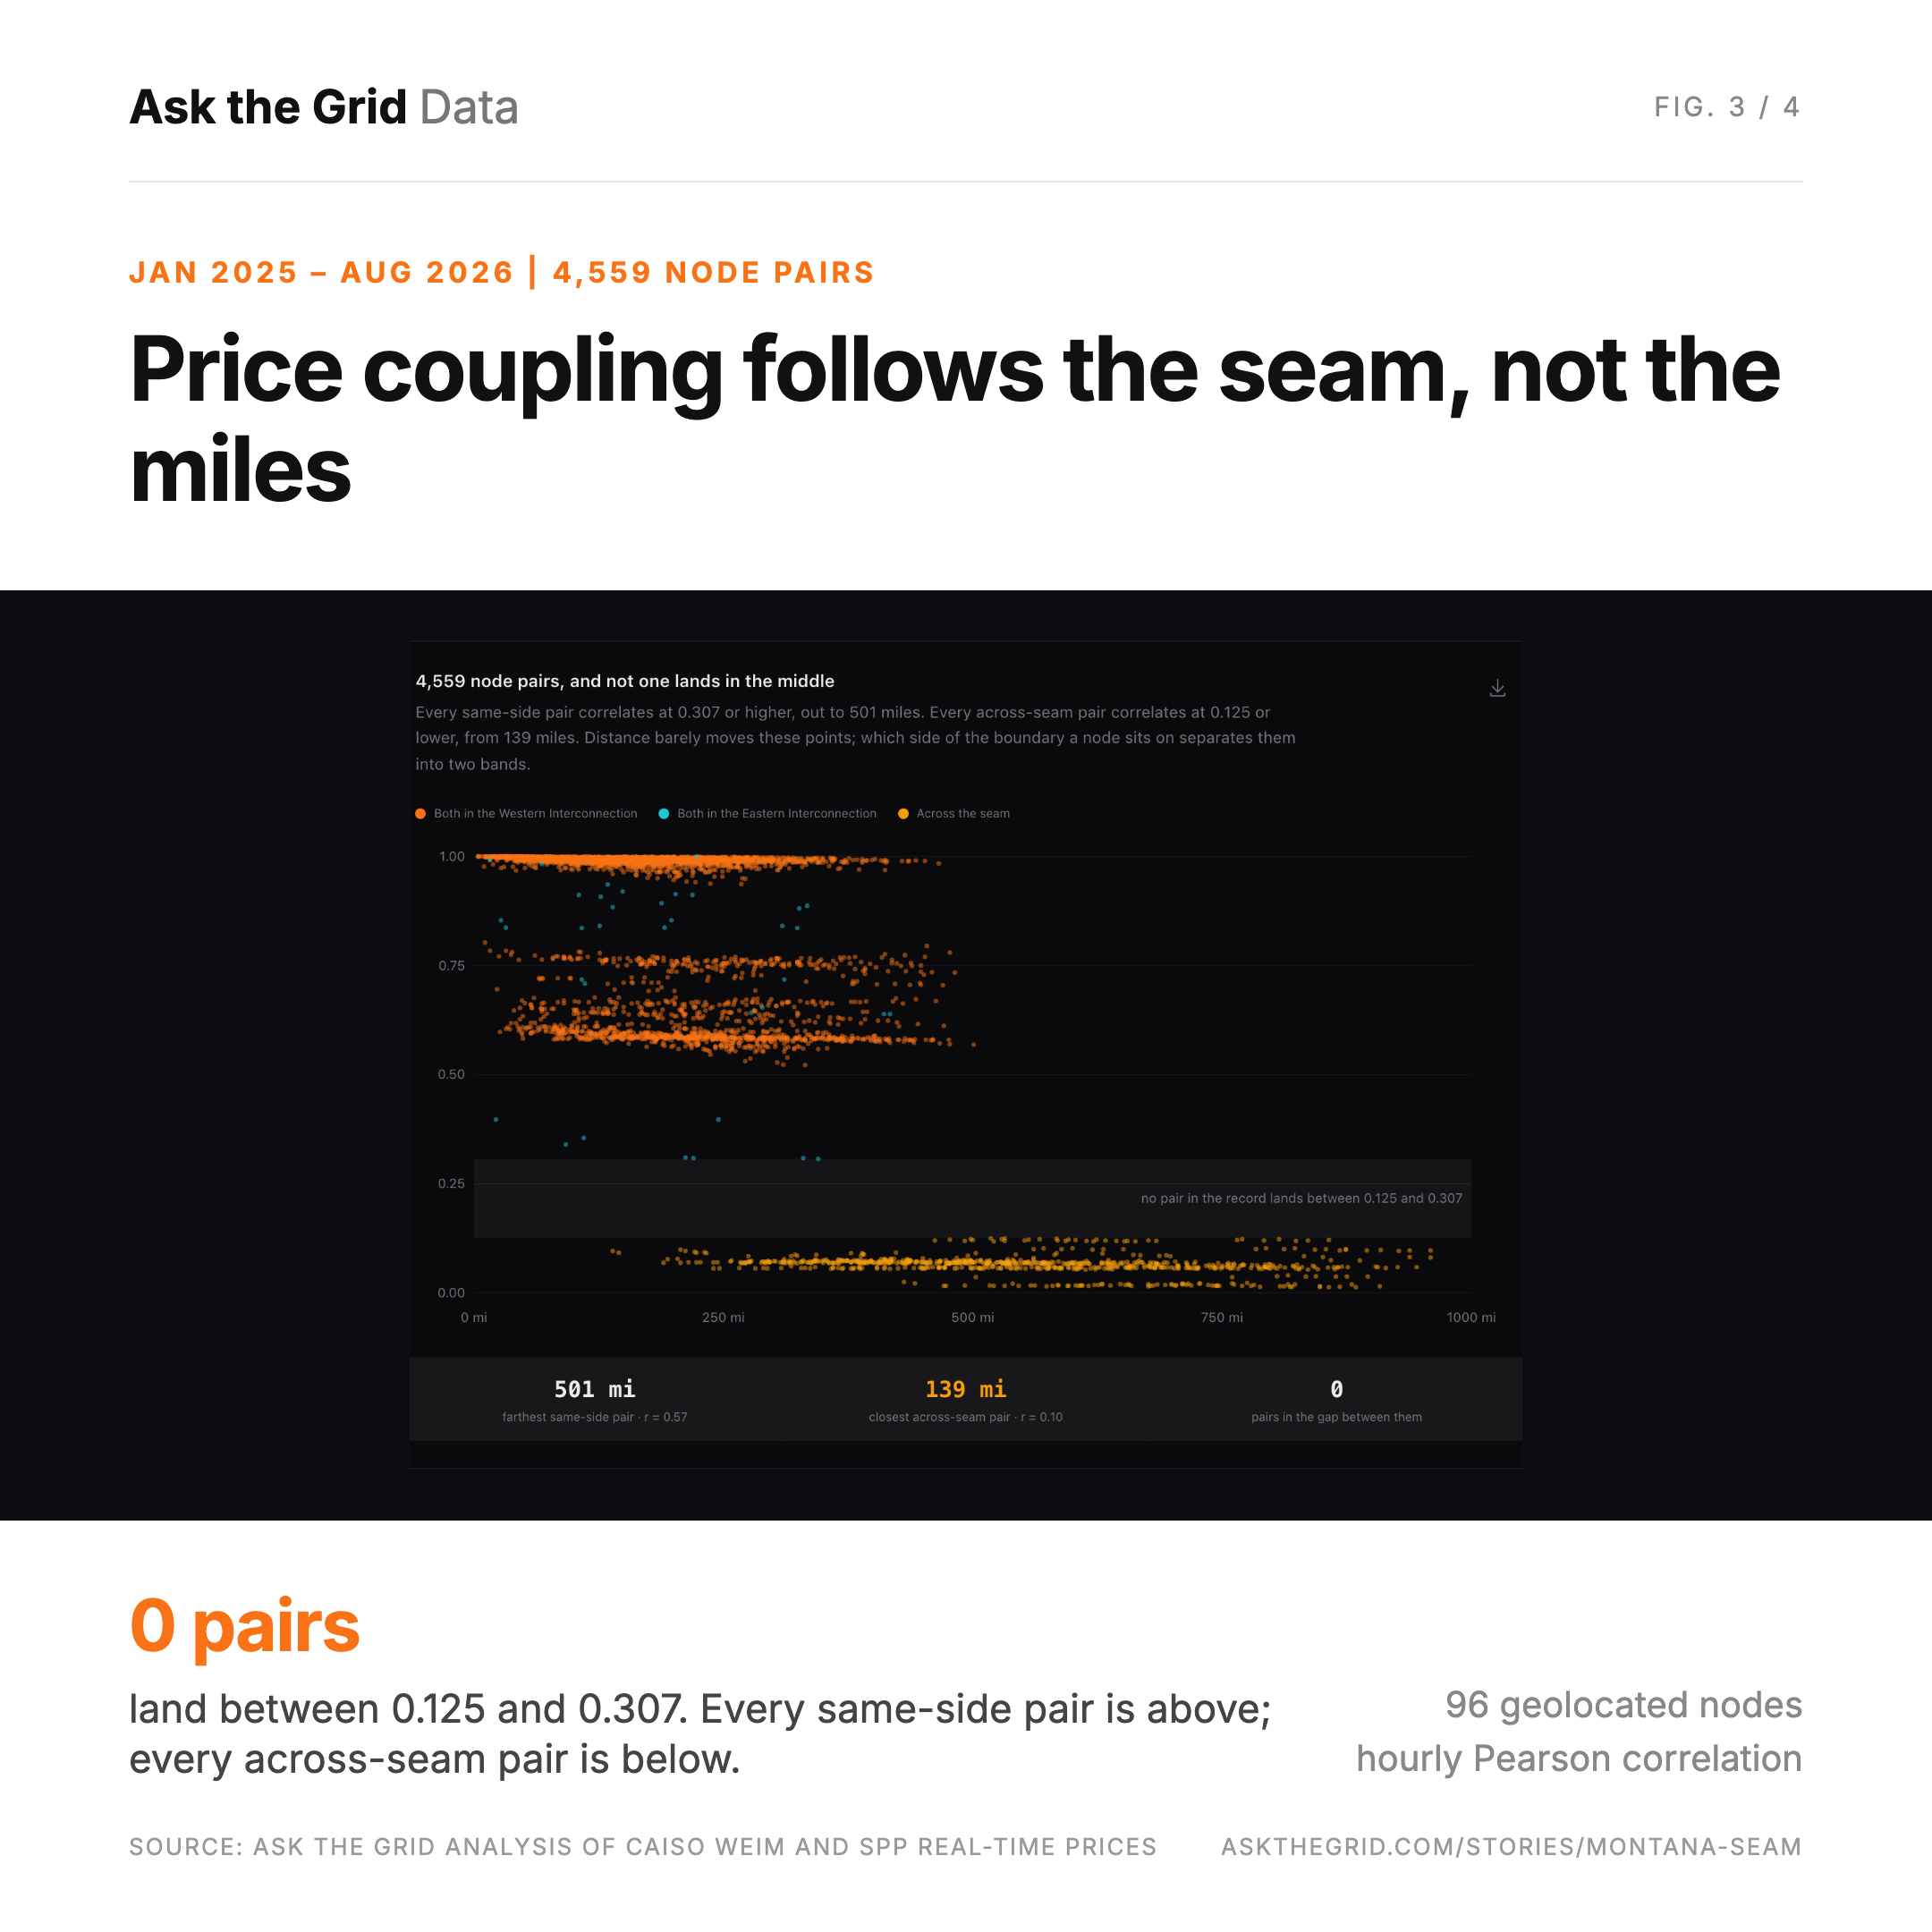
Seven pairs could still be a coincidence of which seven. So Ask the Grid widened it to every priced node in the corridor that carries a coordinate in its grid registry — 96 locations, one per half-degree cell, drawn from 604 Western Energy Imbalance Market nodes across Montana (atg.caiso_prices_rt) and 9 SPP nodes in eastern Montana and North Dakota (atg.spp_prices_rt) — and correlated all 4,559 pairs.
The two populations do not overlap anywhere. The weakest same-side pair in the sample correlates at 0.307; the strongest across-seam pair correlates at 0.125. Nothing lands between them. The farthest same-side pair in the sample, 501 miles apart inside the Western Interconnection, correlates at 0.57; the closest across-seam pair, 139 miles apart, correlates at 0.10. Distance moves these points hardly at all; which grid a node sits on separates them into two bands.
The average price spread changes direction over the day#
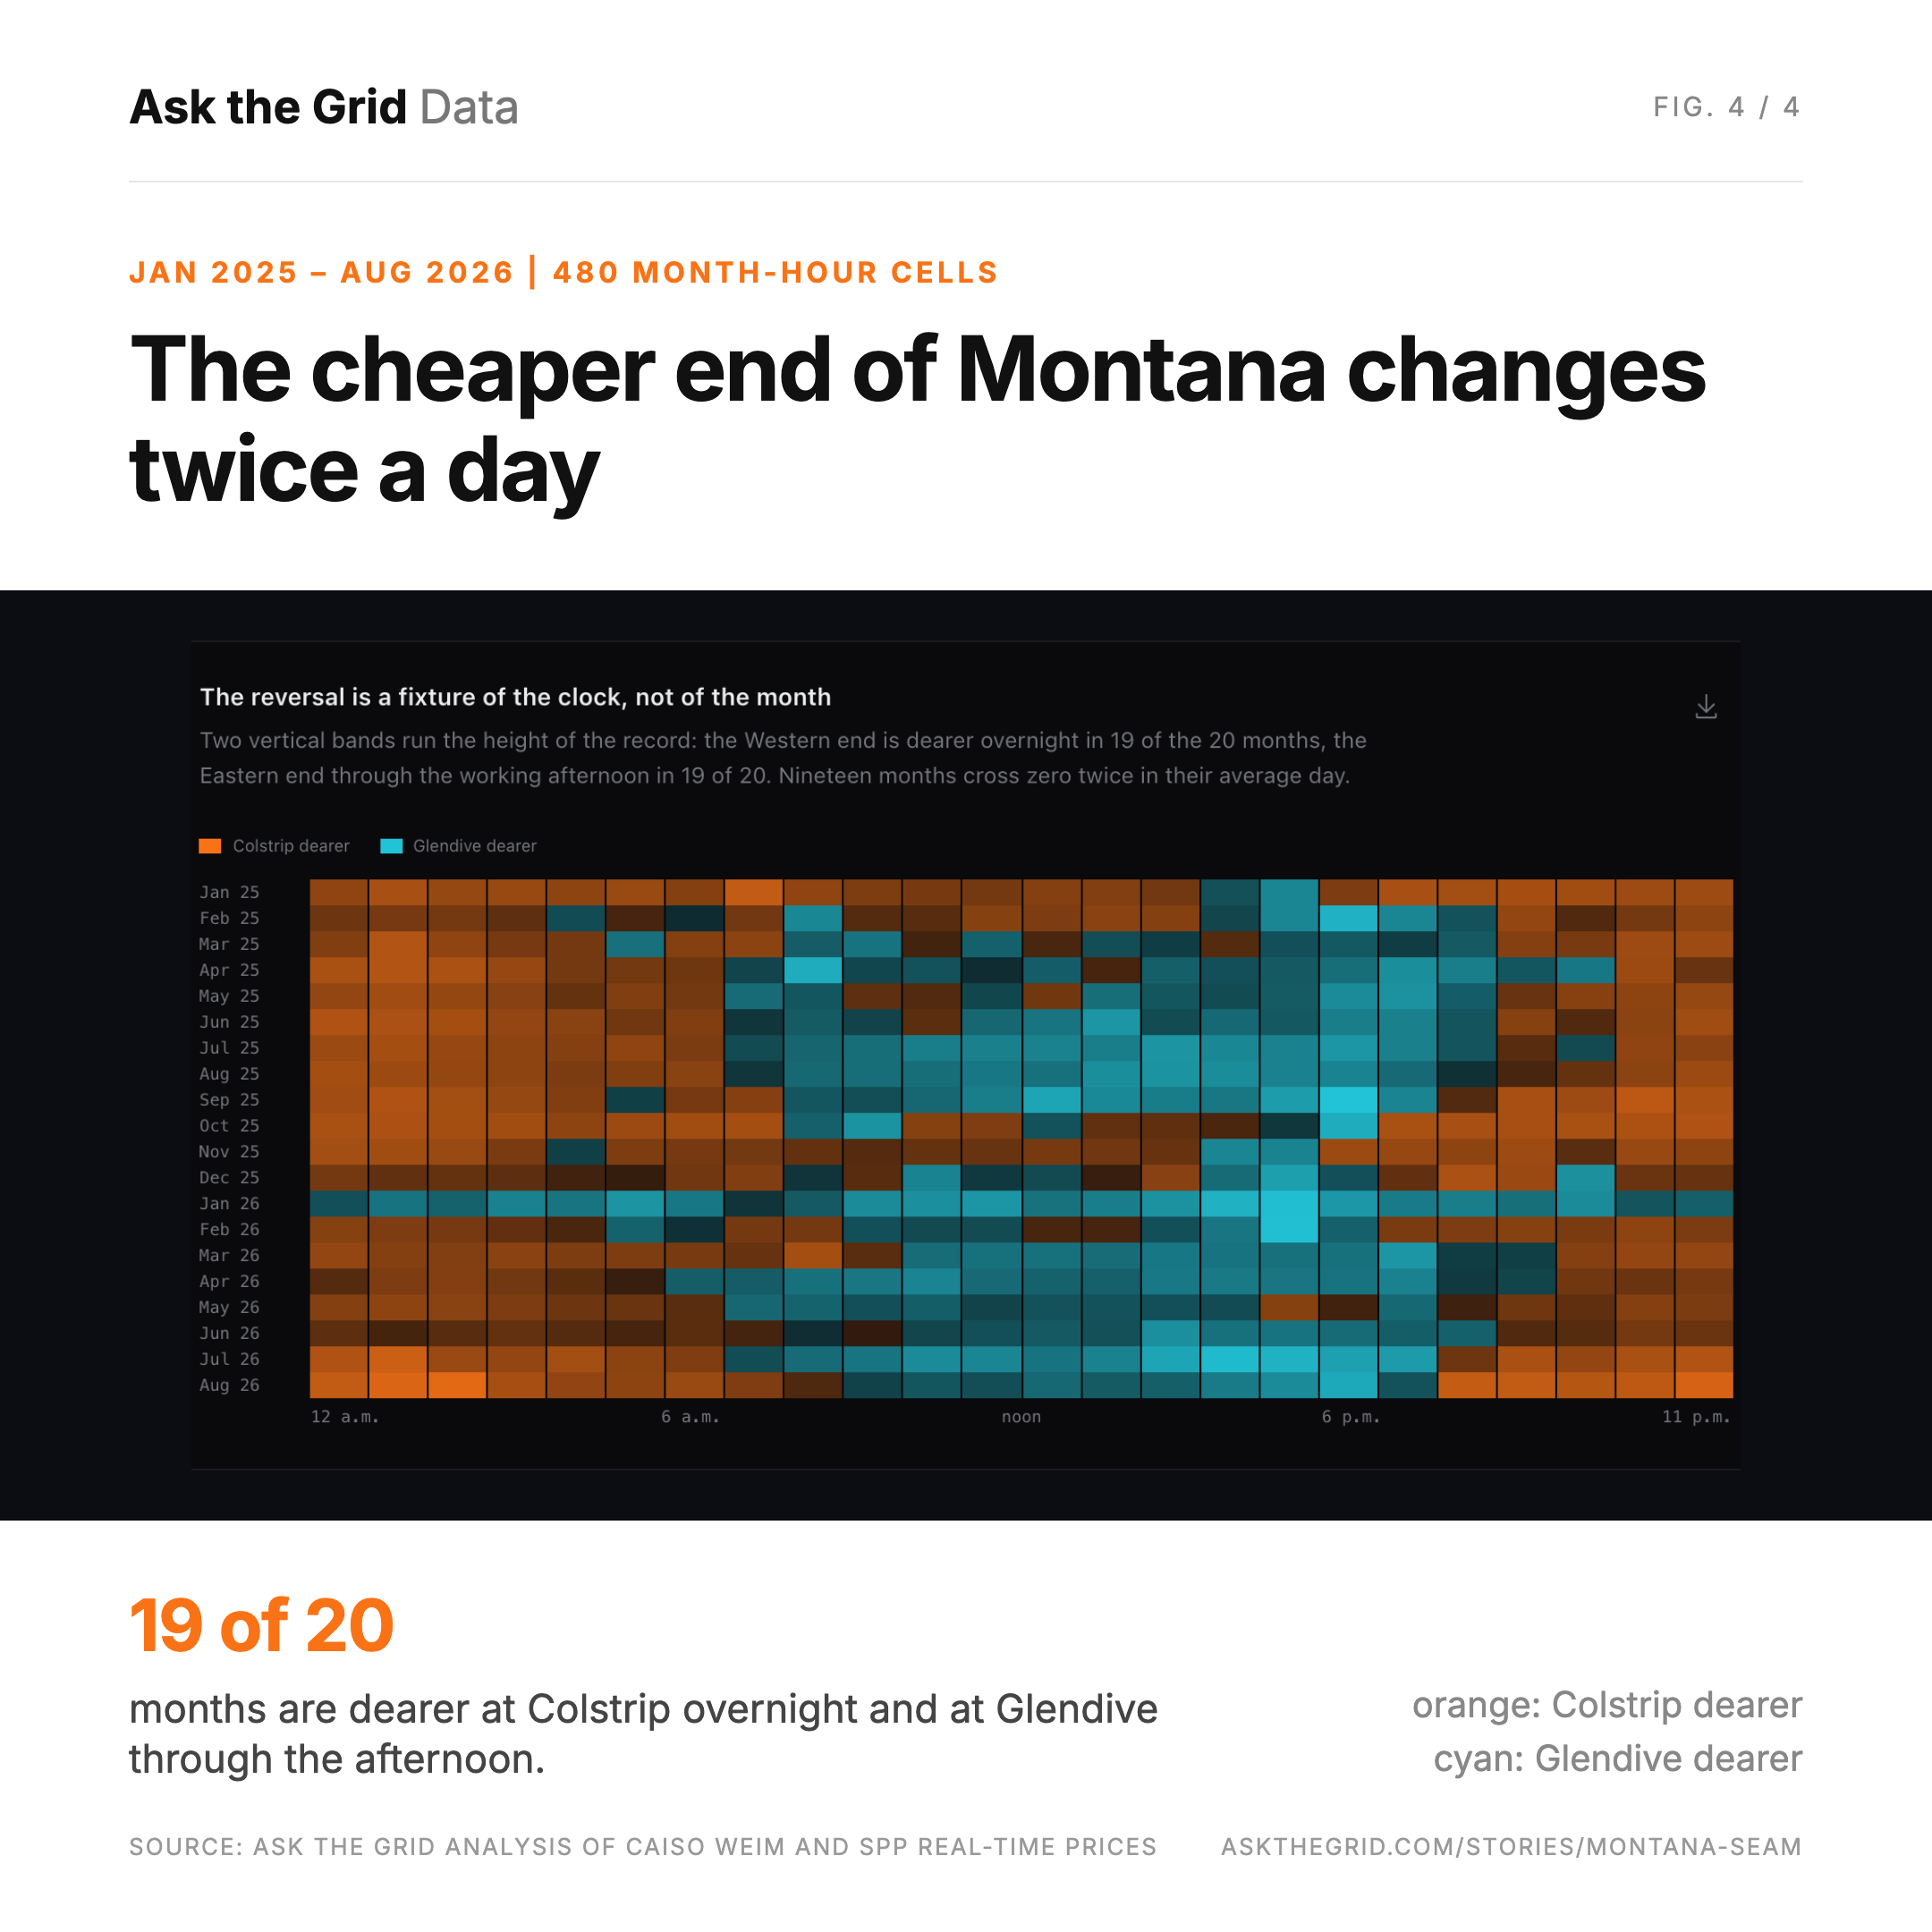
Averaged across all 14,511 matched hours, Colstrip runs $14 to $17/MWh above Glendive overnight, when Dakota wind is producing into low regional demand with limited ways out and the Western system still has load to serve. Through the late afternoon the sign reverses, and Glendive runs about $21/MWh above Colstrip at the 4 and 5 p.m. peak.
Broken out by month, the pattern is a fixture of the clock rather than of the season. Two vertical bands run the whole height of the record: the Western end is dearer overnight in nineteen of the twenty months, the Eastern end through the working afternoon in nineteen of twenty. Nineteen cross zero twice in their average day. January 2026 and May 2026 are the two exceptions, one in each direction.
The average price incentive changes direction with the day: from east to west overnight and west to east in the afternoon. That observed pattern gives the proposed connector's bidirectional capability a practical market context, while its eventual operation will depend on the network and resources available when it enters service.
Not a bad month, every month#
Counting only the starkest case — one node below zero while the other is above it — there were 1,719 hours with Glendive negative and Colstrip positive, and 571 hours the other way. Together that is 2,290 hours, 16 percent of the record. Over the same window Glendive settled below zero in 14.2 percent of five-minute intervals against Colstrip's 6.3 percent. Their averages across the matched hours are nearly identical — $26.99 at Colstrip, $26.76 at Glendive. Neither end is persistently cheap or persistently dear. They are persistently out of step.
Why this corridor#
Resource diversity provides a second part of the developers' case. ERA5 reanalysis for January–August 2026 gives hourly 100-meter wind speeds at Colstrip and Center, North Dakota a correlation of 0.373. North Dakota was windy while Montana was calm in 466 hours; the reverse occurred in 115 hours. Both ends were calm in 7.6 percent of hours. Those weather patterns identify complementary conditions for planners to evaluate alongside generation, demand and transmission during stressed hours.
The scale is also unusual relative to what it lands in. NorthWestern Energy's Montana balancing area peaked at 2,043 MW across the window (caiso.load_actual), so the connector is rated at roughly 1.5 times the peak demand of the system at its western end. It is continental infrastructure that happens to terminate at Colstrip.
What decision-makers should take from the FEIS#
For generators and developers on either side of the seam, the correlation table is a map of basis risk. A Dakota wind project's revenue and a Montana coal or gas unit's revenue are set by two markets that barely speak to each other today; a 3,000 MW link would make each side's afternoon and overnight prices a function of the other's, and hedges written against one hub would need to account for that.
For utilities and offtakers, the complementary wind and price patterns identify conditions worth testing in reliability studies. The contribution of an additional tie depends on whether usable generation is available on the supplying side when the receiving side needs it, with transfer capability available in the same hours.
For regulators and planners, the price comparison establishes persistence within the study window. Separation appears across months, changes direction over the day and remains pronounced in the same-side comparisons. The next permitting and planning decisions concern how the proposed line would address that pattern at its projected cost and operating scale.
Ask the Grid matched 14,511 hourly averages from January 1, 2025 through August 31, 2026 at Colstrip's NorthWestern share node and PSGO_MDUM_GLENDC1, using CAISO-operated real-time prices and SPP real-time prices. Correlations are Pearson on shared hours. Colstrip represents a generator share with local congestion; over the same hours, the NorthWestern/Avista and NorthWestern/Bonneville interface averages were $28.44/MWh and $28.98/MWh, compared with Colstrip's $26.99/MWh. The analysis compares observed prices; project dispatch and benefits depend on the system with the proposed line in place.
Explore the underlying datasets: CAISO real-time prices, SPP real-time prices, balancing-authority load and the ERA5 weather grid. The Western node has its own page at Colstrip 3 and 4, NorthWestern share. The figures are frozen at publication. Open SPP on the live map to inspect current plants, prices and transmission across eastern Montana and the Dakotas.