Where are the power outages in BPA's balancing area right now?
Every county across BPA's Northwest footprint with an active reported outage, ranked by meters out — then open the exact same live view on the map.
Every county across BPA's Northwest footprint with an active reported outage, ranked by meters out — then open the exact same live view on the map.
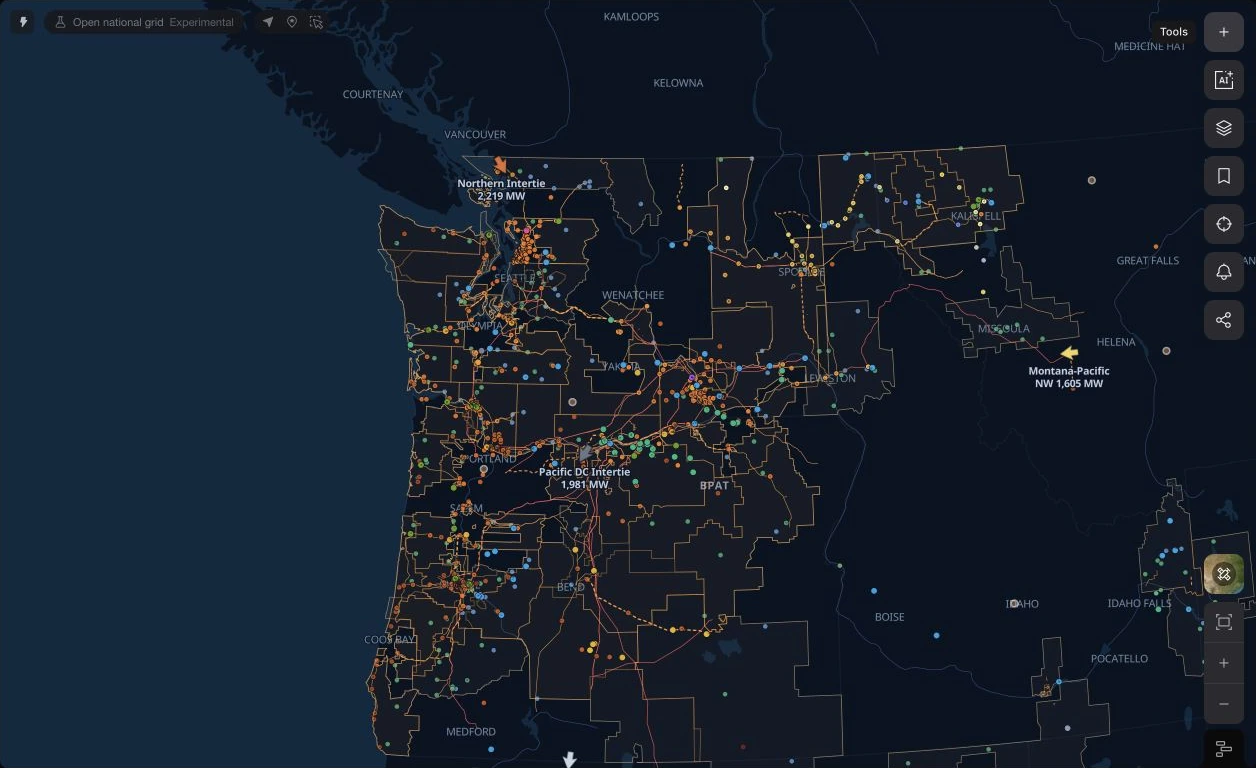
County-level power outage data from ODIN (Outage Data Initiative), the aggregator utilities inside BPA's four-state balancing area report into. Each county's active outage total is a snapshot from ODIN's most recent poll.
BPA does not sell power directly to retail customers — it is the region's federal transmission and wholesale hydro supplier, and the outages here belong to the utilities operating inside its balancing area, not to BPA itself. Reading them next to BPA's interface flows and hydro conditions surfaces the wider Northwest picture before official damage assessments catch up.
It's ODIN's own unit — a meter, not a person or household count. Treat it as a consistent relative measure across counties, not a precise customer-impact figure.
No. BPA does not serve retail customers, so a county shown here reflects the utility (or utilities) reporting outages inside that county — some of which sit in BPA's four-state footprint but are not themselves served by BPA.
It reflects ODIN's most recent poll of reporting utilities, typically updated every few minutes to a few hours depending on the utility. A county with no active outage row simply had none reported at the last poll.
Showing the top 30 of 30 counties with an active reported outage. Open the live map for the full, filterable view.
Yes. It carries the same layers, filters, viewport, and timeline state shown on this page into the live BPA workspace — the same save/restore system behind a personal saved view.