BPA grid conditions and transmission
Bonneville Power Administration · Pacific Northwest
Explore Bonneville Power Administration demand, generation and published transmission-path flows. Open the Northwest grid map to inspect dams, substations, lines and interconnection requests, with source data available to the agent.
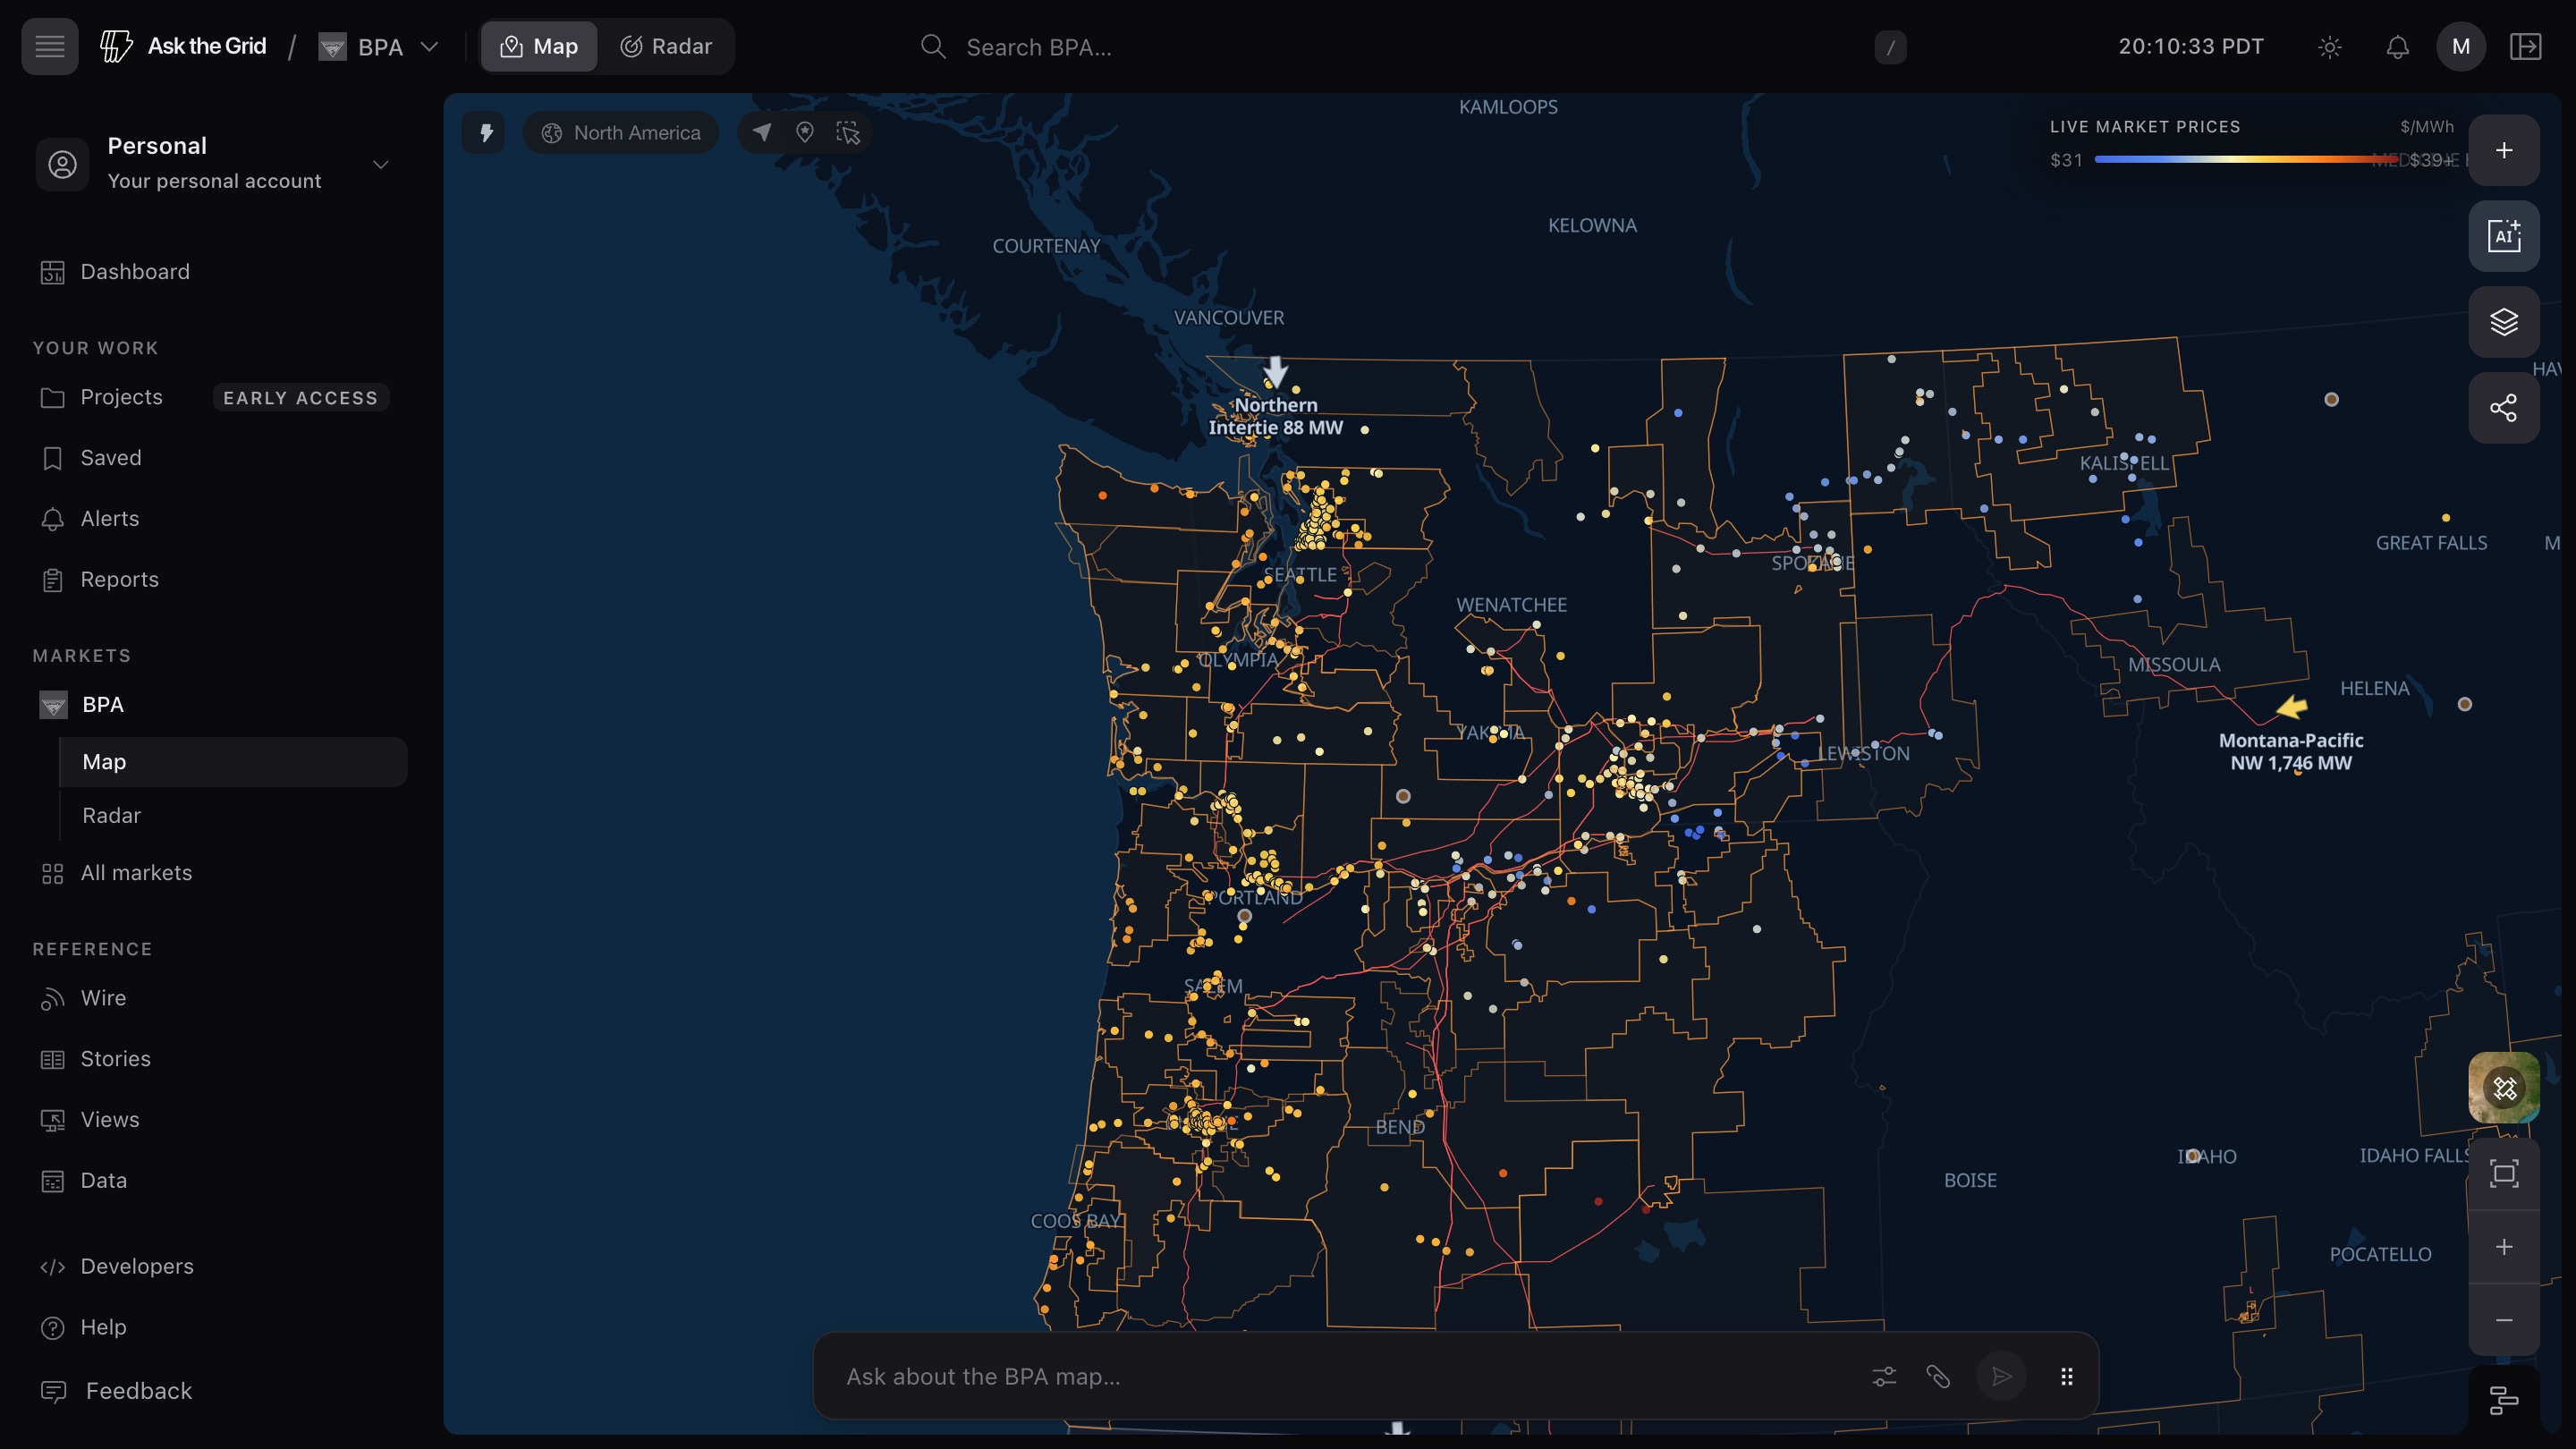
BPA on the live map
LiveWhat you can ask BPA
Open the agentClick any question to open it in the live agent with the market already selected. The answer keeps its sources attached.
What's live here
Every dataset, sourced8 coverage areas live today. Each row is backed by named source feeds in the public data catalog — cadence and provenance included.
| Coverage | Detail | Cadence | Status |
|---|---|---|---|
| Load & generation | Balancing-area load, hydro, wind, solar, thermal and nuclear output and net interchange, back to 2007 | 5-min | Live |
| Path flows & limits | Actual flow against the operating limit on the paths BPA operates, including the California-Oregon Intertie, the Pacific DC Intertie and the Northern Intertie | 5-min / 15-min | Live |
| Balancing reserves | Reserves deployed with the INC and DEC maxima available, plus wind-limit and oversupply-mitigation status | 5-min | Live |
| Dam operations | Generation, discharge, spill and forebay at the Columbia and Snake River projects, from Grand Coulee and Chief Joseph to Bonneville Dam | Hourly | Live |
| Snowpack & water supply | SNOTEL snow water equivalent against the 30-year median, river forecasts and seasonal streamflow volume forecasts at the basin's forecast points | Hourly – daily | Live |
| Prices | Western Energy Imbalance Market prices at BPA locations, with the Mid-Columbia daily peak index as the bilateral record | 5-min / daily | Live |
| Transmission outages | Planned outage plans with every revision kept, and the outage record for lines, transformers and customer service points | Every 3–6 hours | Live |
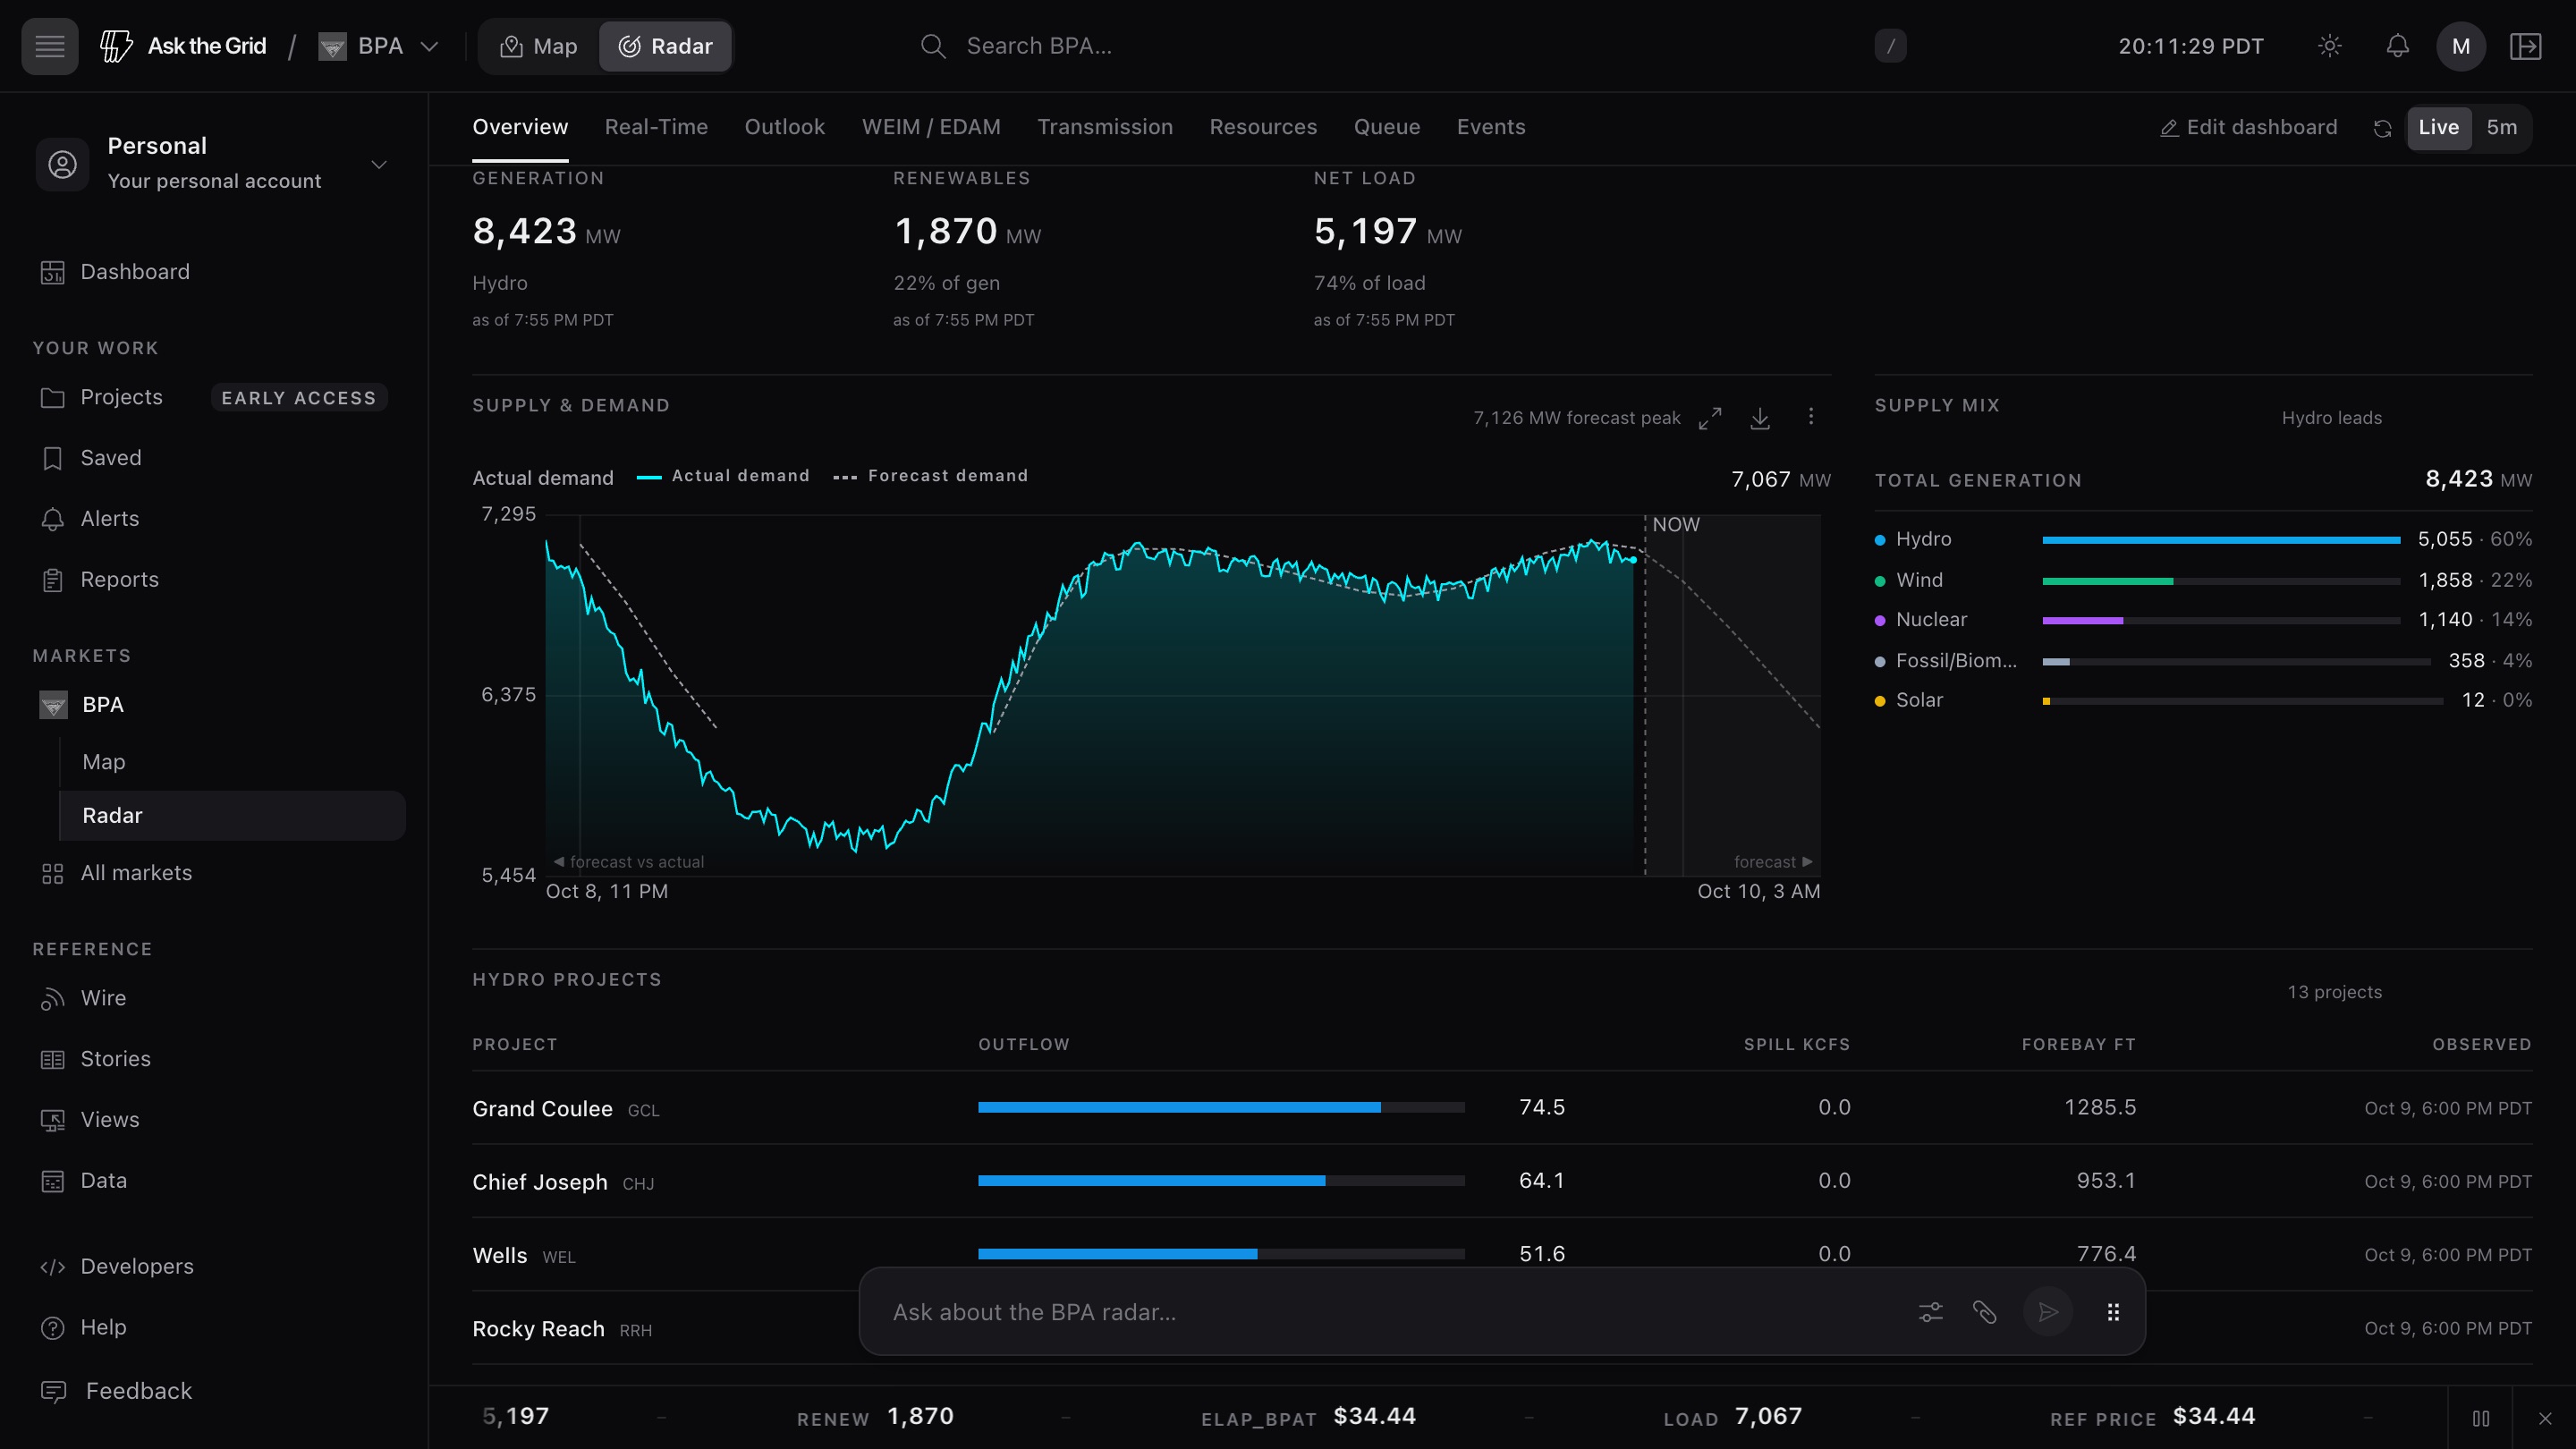
| Radar cockpit | The hydro-system board: fuel mix, hydro projects, balancing reserves, water supply, interface loading and planned interface outages on one wall | Streaming / 5-min | Live |
Live intelligence for BPA
Browse every live viewEverything Ask the Grid publishes on BPA, in one place — what the grid is doing now, where it is headed, and what has been written about it.
Live views
Coverage and analysis
Data and access
The product, as it runs
Real product screenshots, shown in full.
Read BPA hydropower, transmission and interchange
Bonneville Power Administration operates a balancing area and markets federal hydroelectric power in the Pacific Northwest. It does not operate an ISO or RTO nodal market of its own. Market prices at its locations retain the identity of the market that published them.
Read BPA demand and generation alongside reservoir observations, dam operations and published transmission-path flows. Compare flow with the corresponding path limit and time; a river observation and a market price are separate measurements.
Open the Northwest map to inspect dams, transmission lines, substations and published interconnection requests. The agent can investigate those records with the source and observation time attached.
Read the market's language
Full glossaryAsk BPA what changed.
Open the live market and begin with a question, a place, or an interval.