SPP East peak demand history
See SPP East's highest observed hourly demand each day, when it occurred, and how complete the record is. Inspect annual and seasonal records, separately labeled hourly forecasts, same-season year-earlier comparisons and all seven organized markets on one common UTC day.
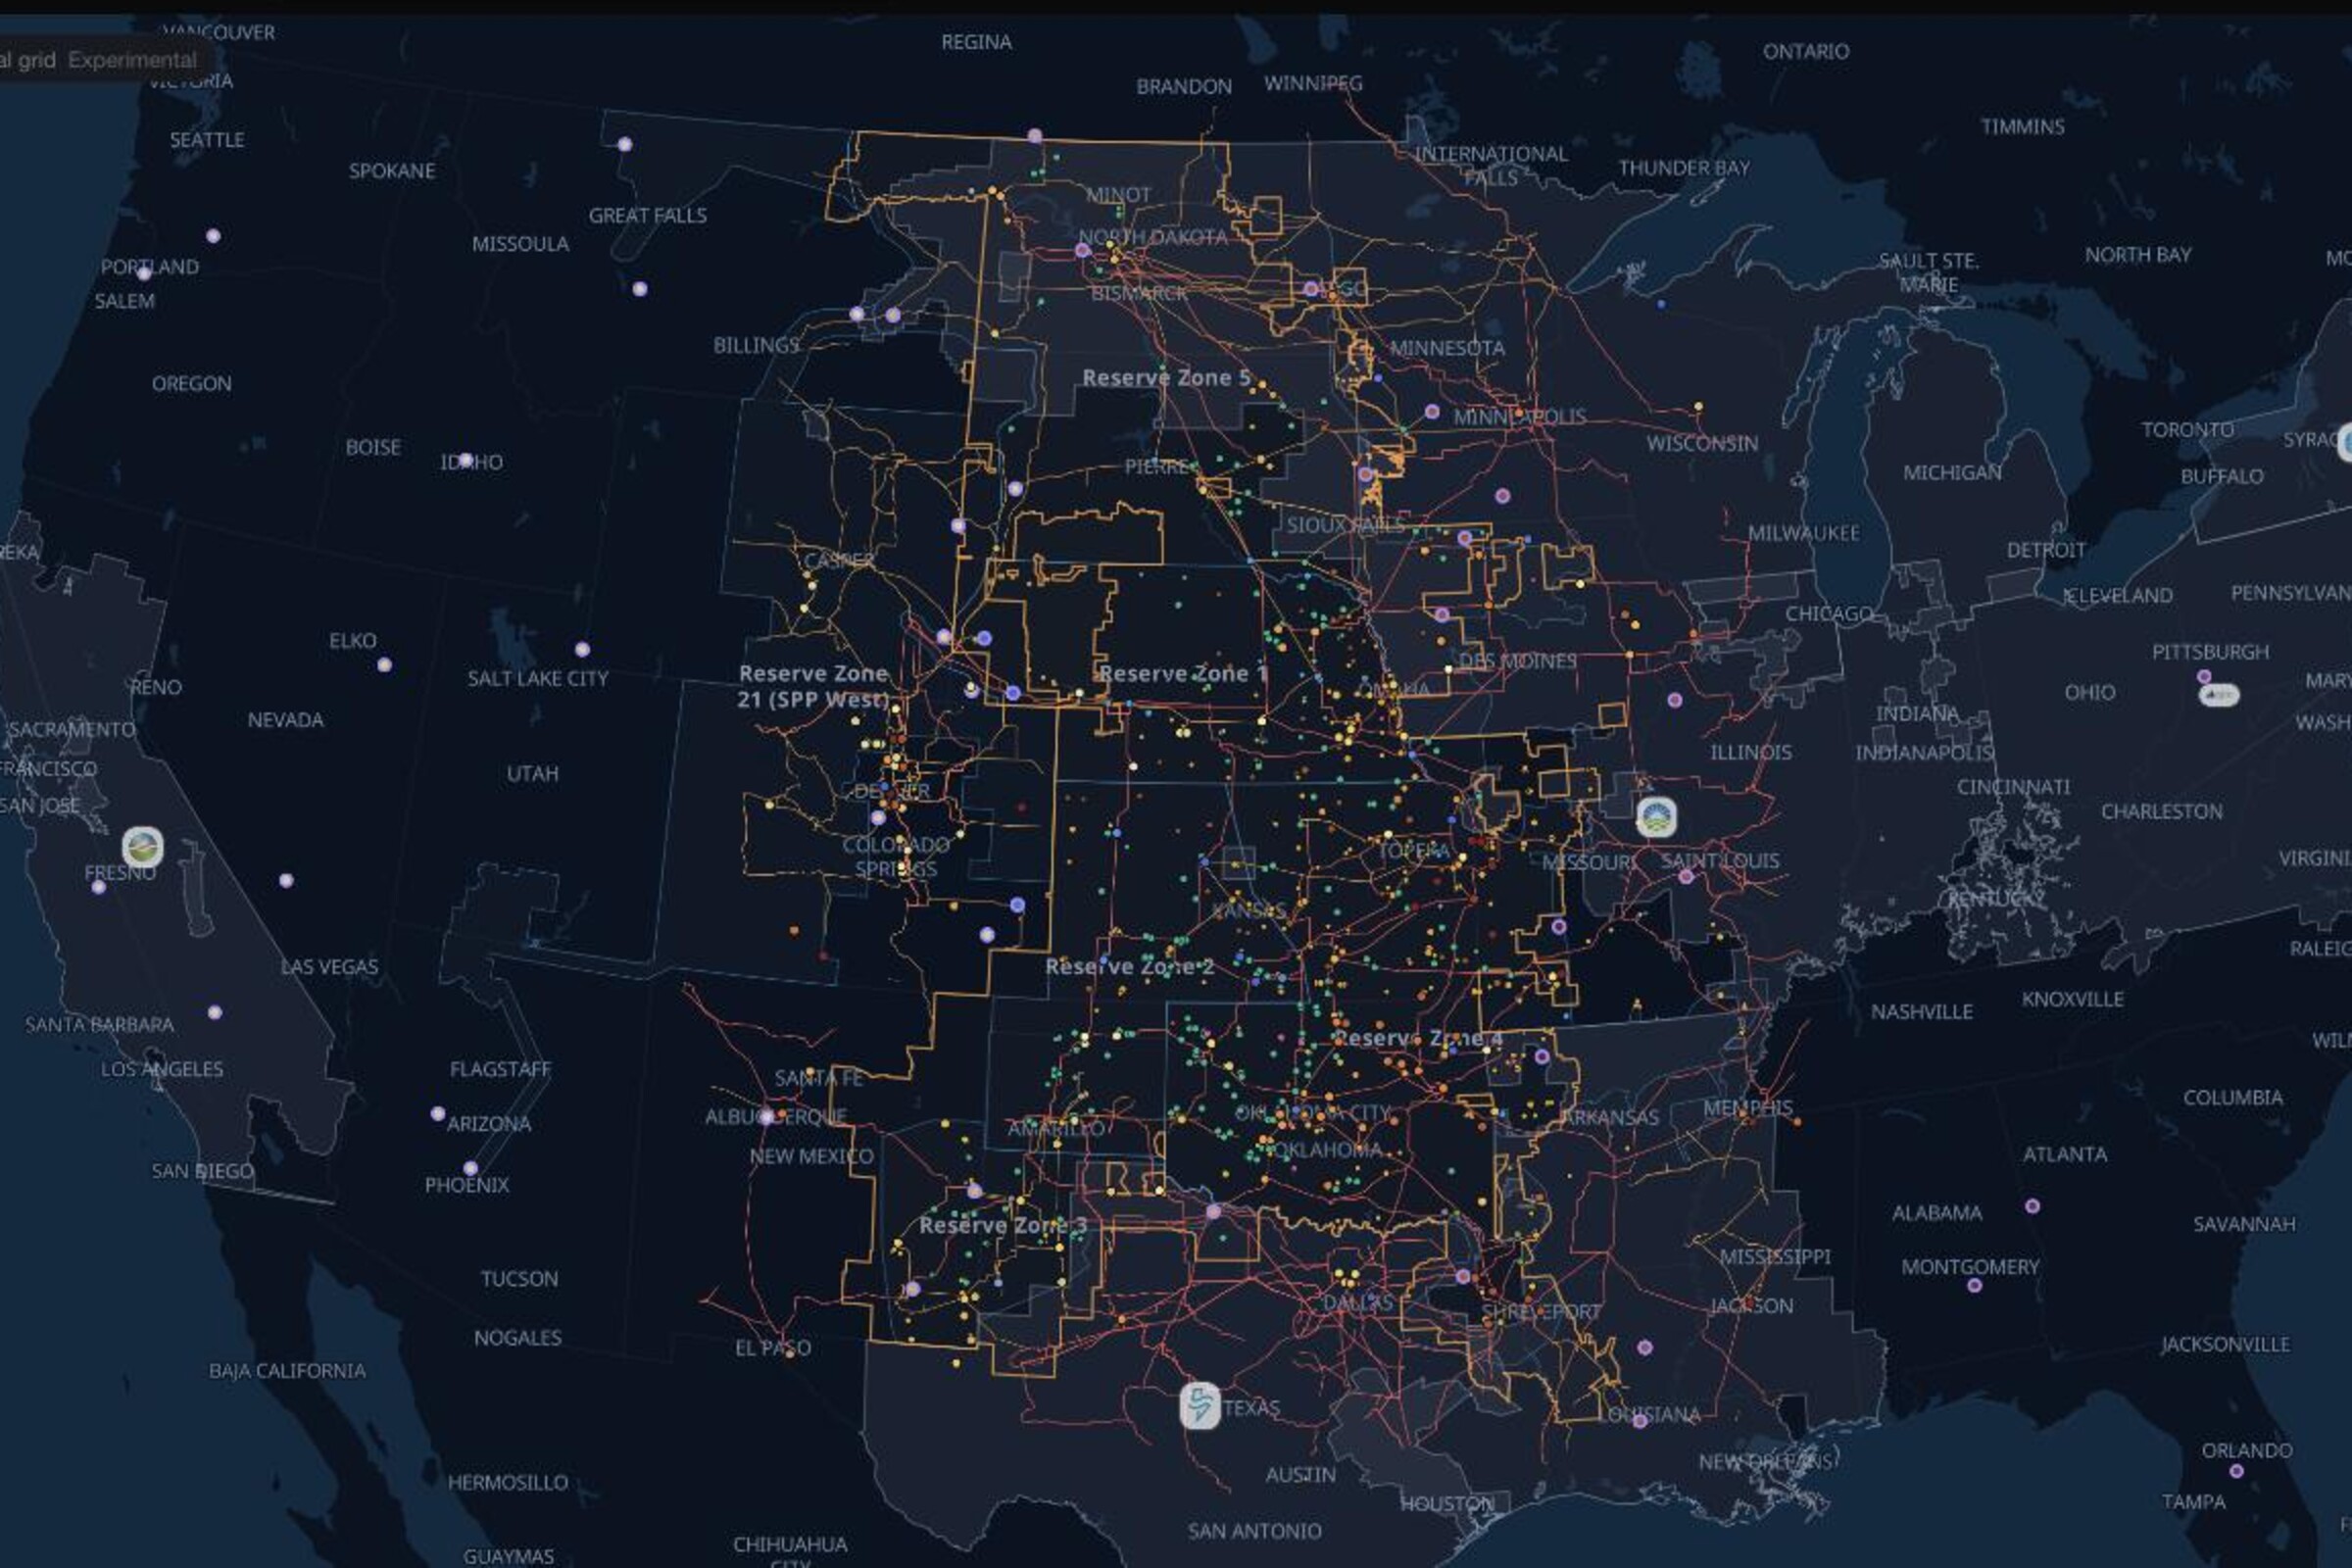
See it on the live SPP map, updating as the market publishes.
Explore the SPP East gridAbout this view
Read the peak hour
Demand is an hourly average in MW. Each daily peak is the largest observed hourly value on that market's local calendar date, with the hour-beginning timestamp and time zone shown. It differs from an instantaneous operator record or a forecast peak.
Coverage before record claims
Record tables use all retained canonical hourly history through the selected date; the recent daily chart shows 400 days. Missing or null hours remain gaps and can hide a higher peak. The displayed maximum is the highest observed in that retained history; with gaps it is a lower bound.
Same-season historical comparison
Observed 30-day maxima remain visible when coverage is incomplete, labeled as lower bounds. Both windows need every expected hour before a comparable percentage change is shown. The prior window ends on the same calendar date a year earlier; February 29 maps to February 28. Historical values use the latest retained revisions.
System measurement and footprint
Only baa=SPP, the East footprint, is included. RTO West (SWPW) is excluded after the 2026 western expansion. Since 2017 the preferred series averages complete five-minute system observations, with zonal-hourly fallback; earlier history sums load zones.
Questions
Is this the official all-time demand record?
It is the highest observed hourly average in the retained hourly history through the selected date. Annual and seasonal rows retain explicit bounds and coverage. It is not an all-time or instantaneous record. Missing hours may hide a higher observation.
Why is a historical change sometimes blank?
The latest and year-earlier 30-day windows each need all expected hourly values. A missing or null hour, an open day or unavailable history withholds the comparable change. Observed period maxima remain visible as lower bounds with their coverage.
How are daylight saving days handled?
Expected hours follow the market's local calendar. A spring transition has 23 hours and an autumn transition has 25. Repeated local hours remain distinct UTC intervals, with the local zone printed beside the peak.