
Southwest Power Pool grid conditions
Southwest Power Pool · Great Plains
Explore Southwest Power Pool electricity prices, demand, generation and binding constraints. Open the SPP grid map to compare locations and inspect infrastructure and queue requests, then investigate the data with the agent.
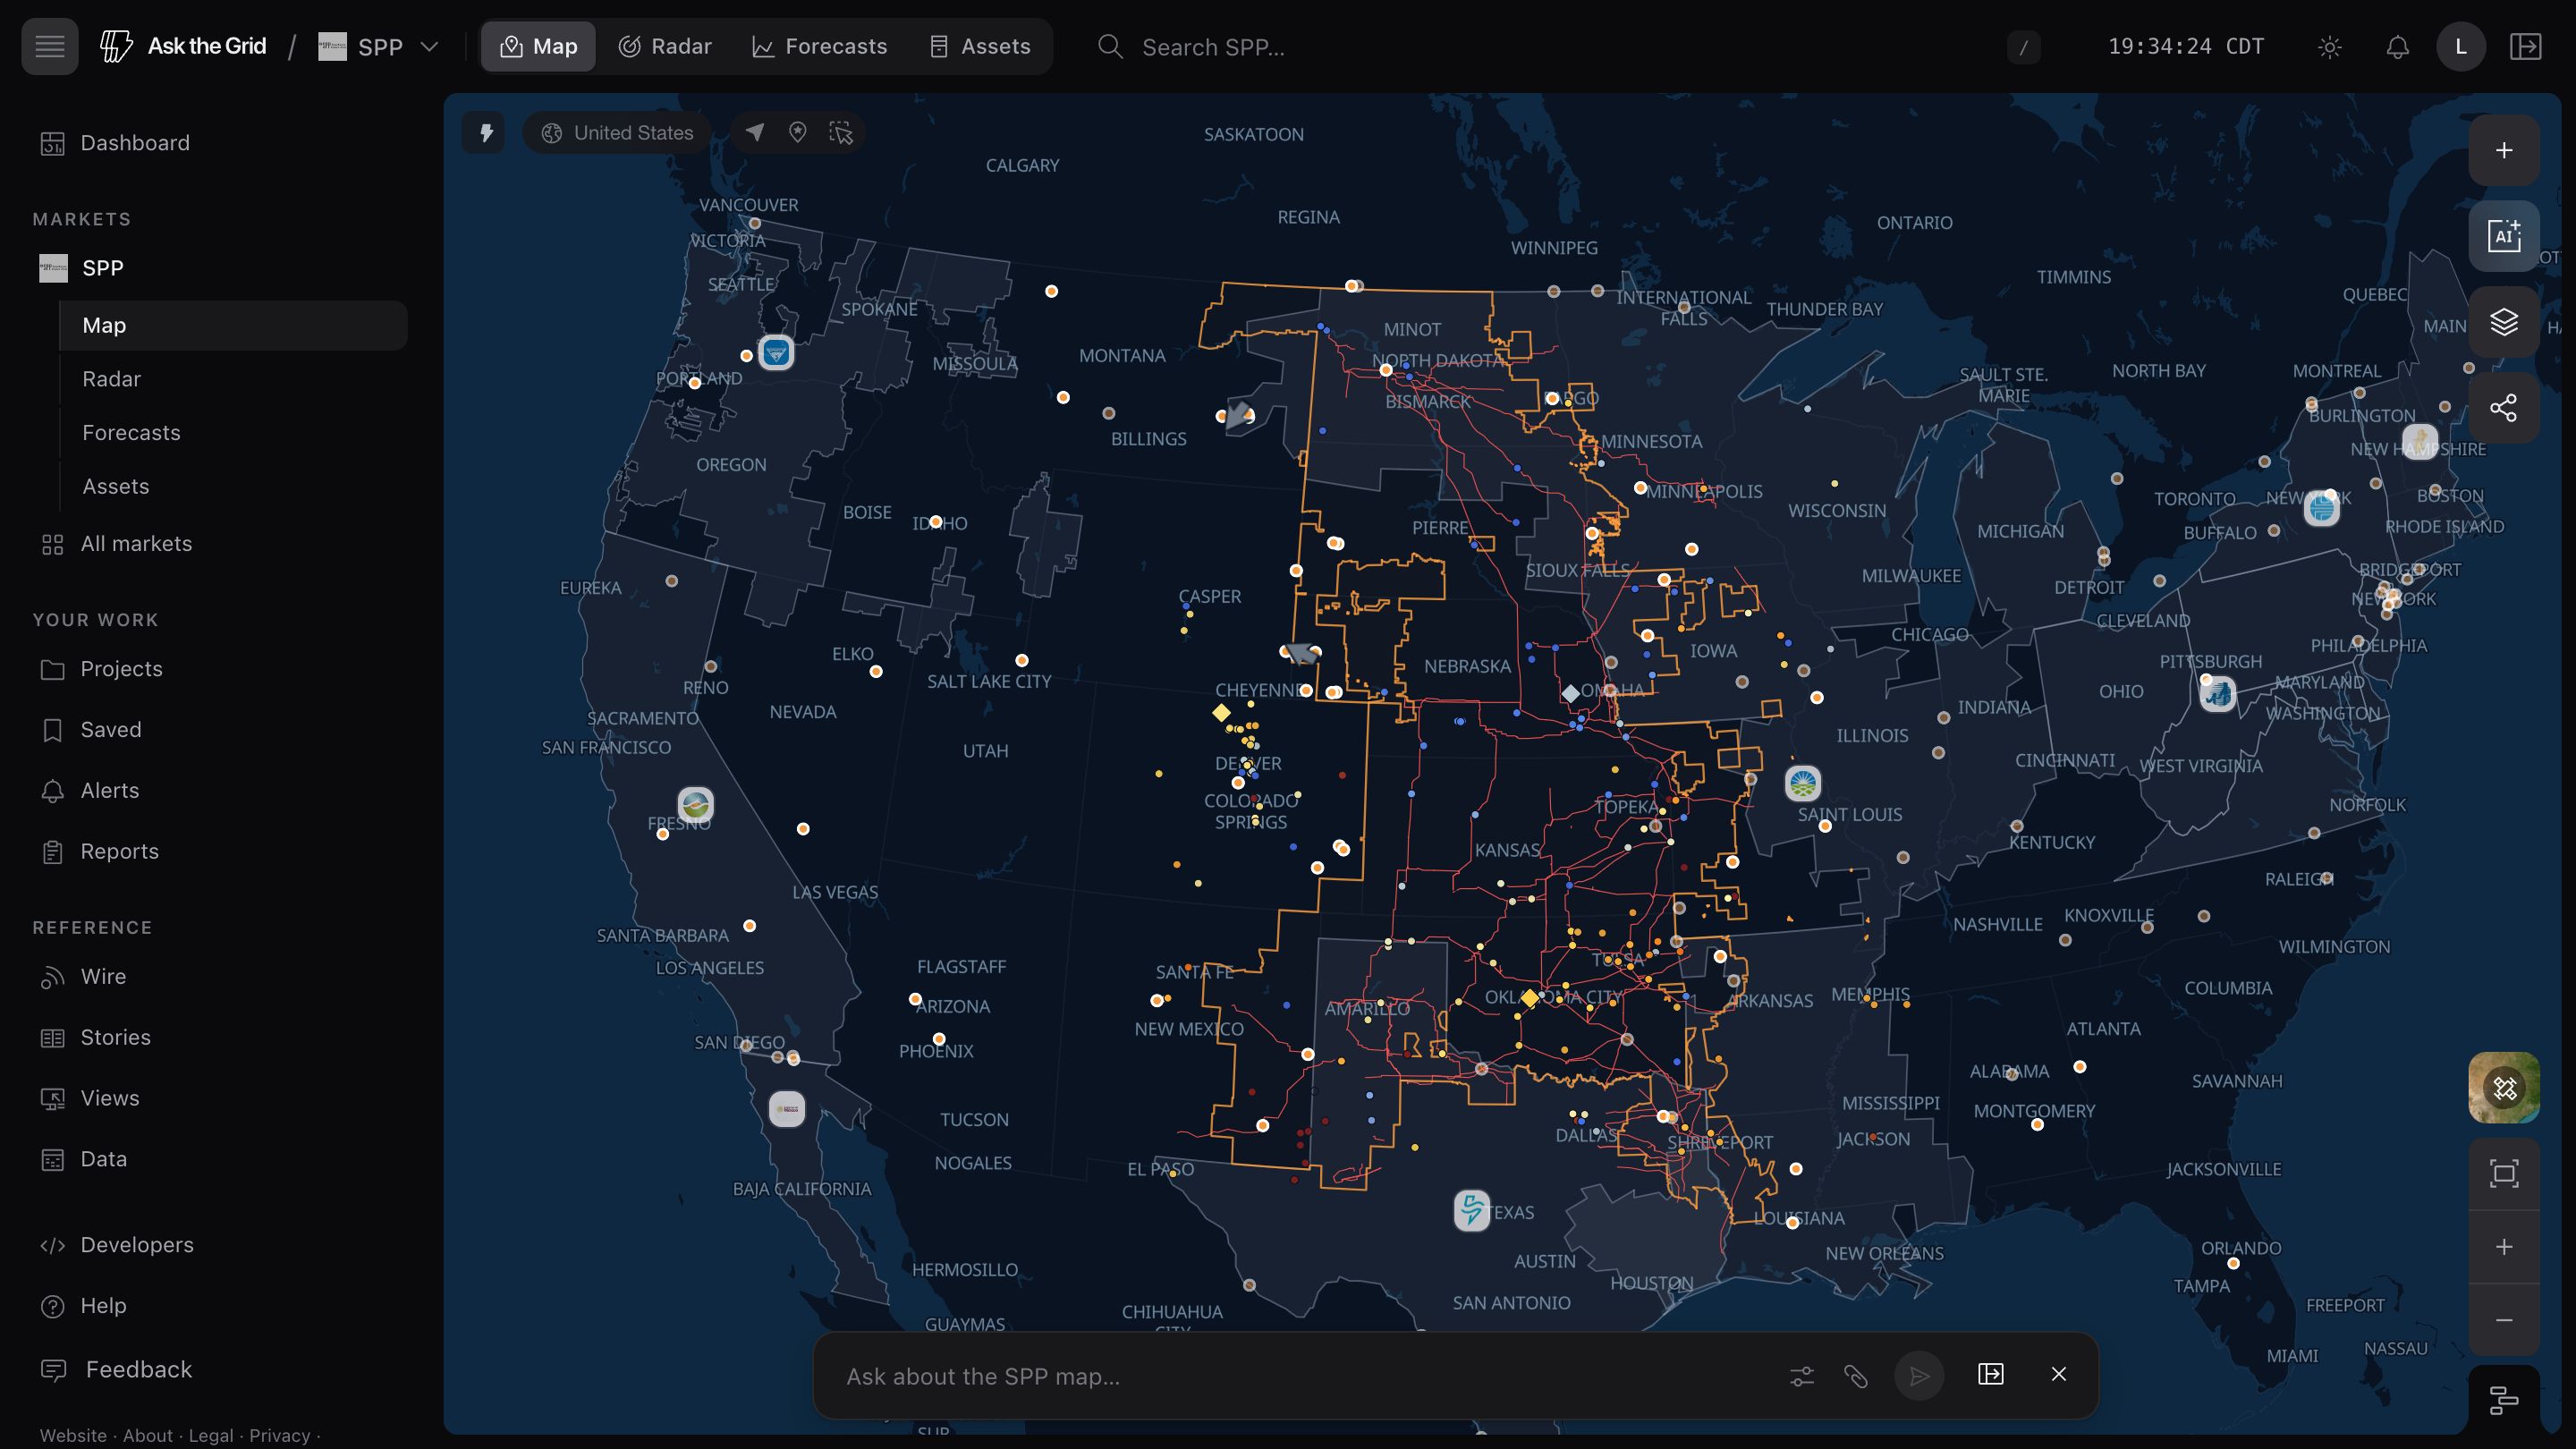
SPP on the live map
LiveWhat you can ask SPP
Open the agentClick any question to open it in the live agent with the market already selected. The answer keeps its sources attached.
What's live here
Every dataset, sourced6 coverage areas live today. Each row is backed by named source feeds in the public data catalog — cadence and provenance included.
| Coverage | Detail | Cadence | Status |
|---|---|---|---|
| Real-time prices | Five-minute LMP at the SPP North and South trading hubs | 5-min (RTBM) | Live |
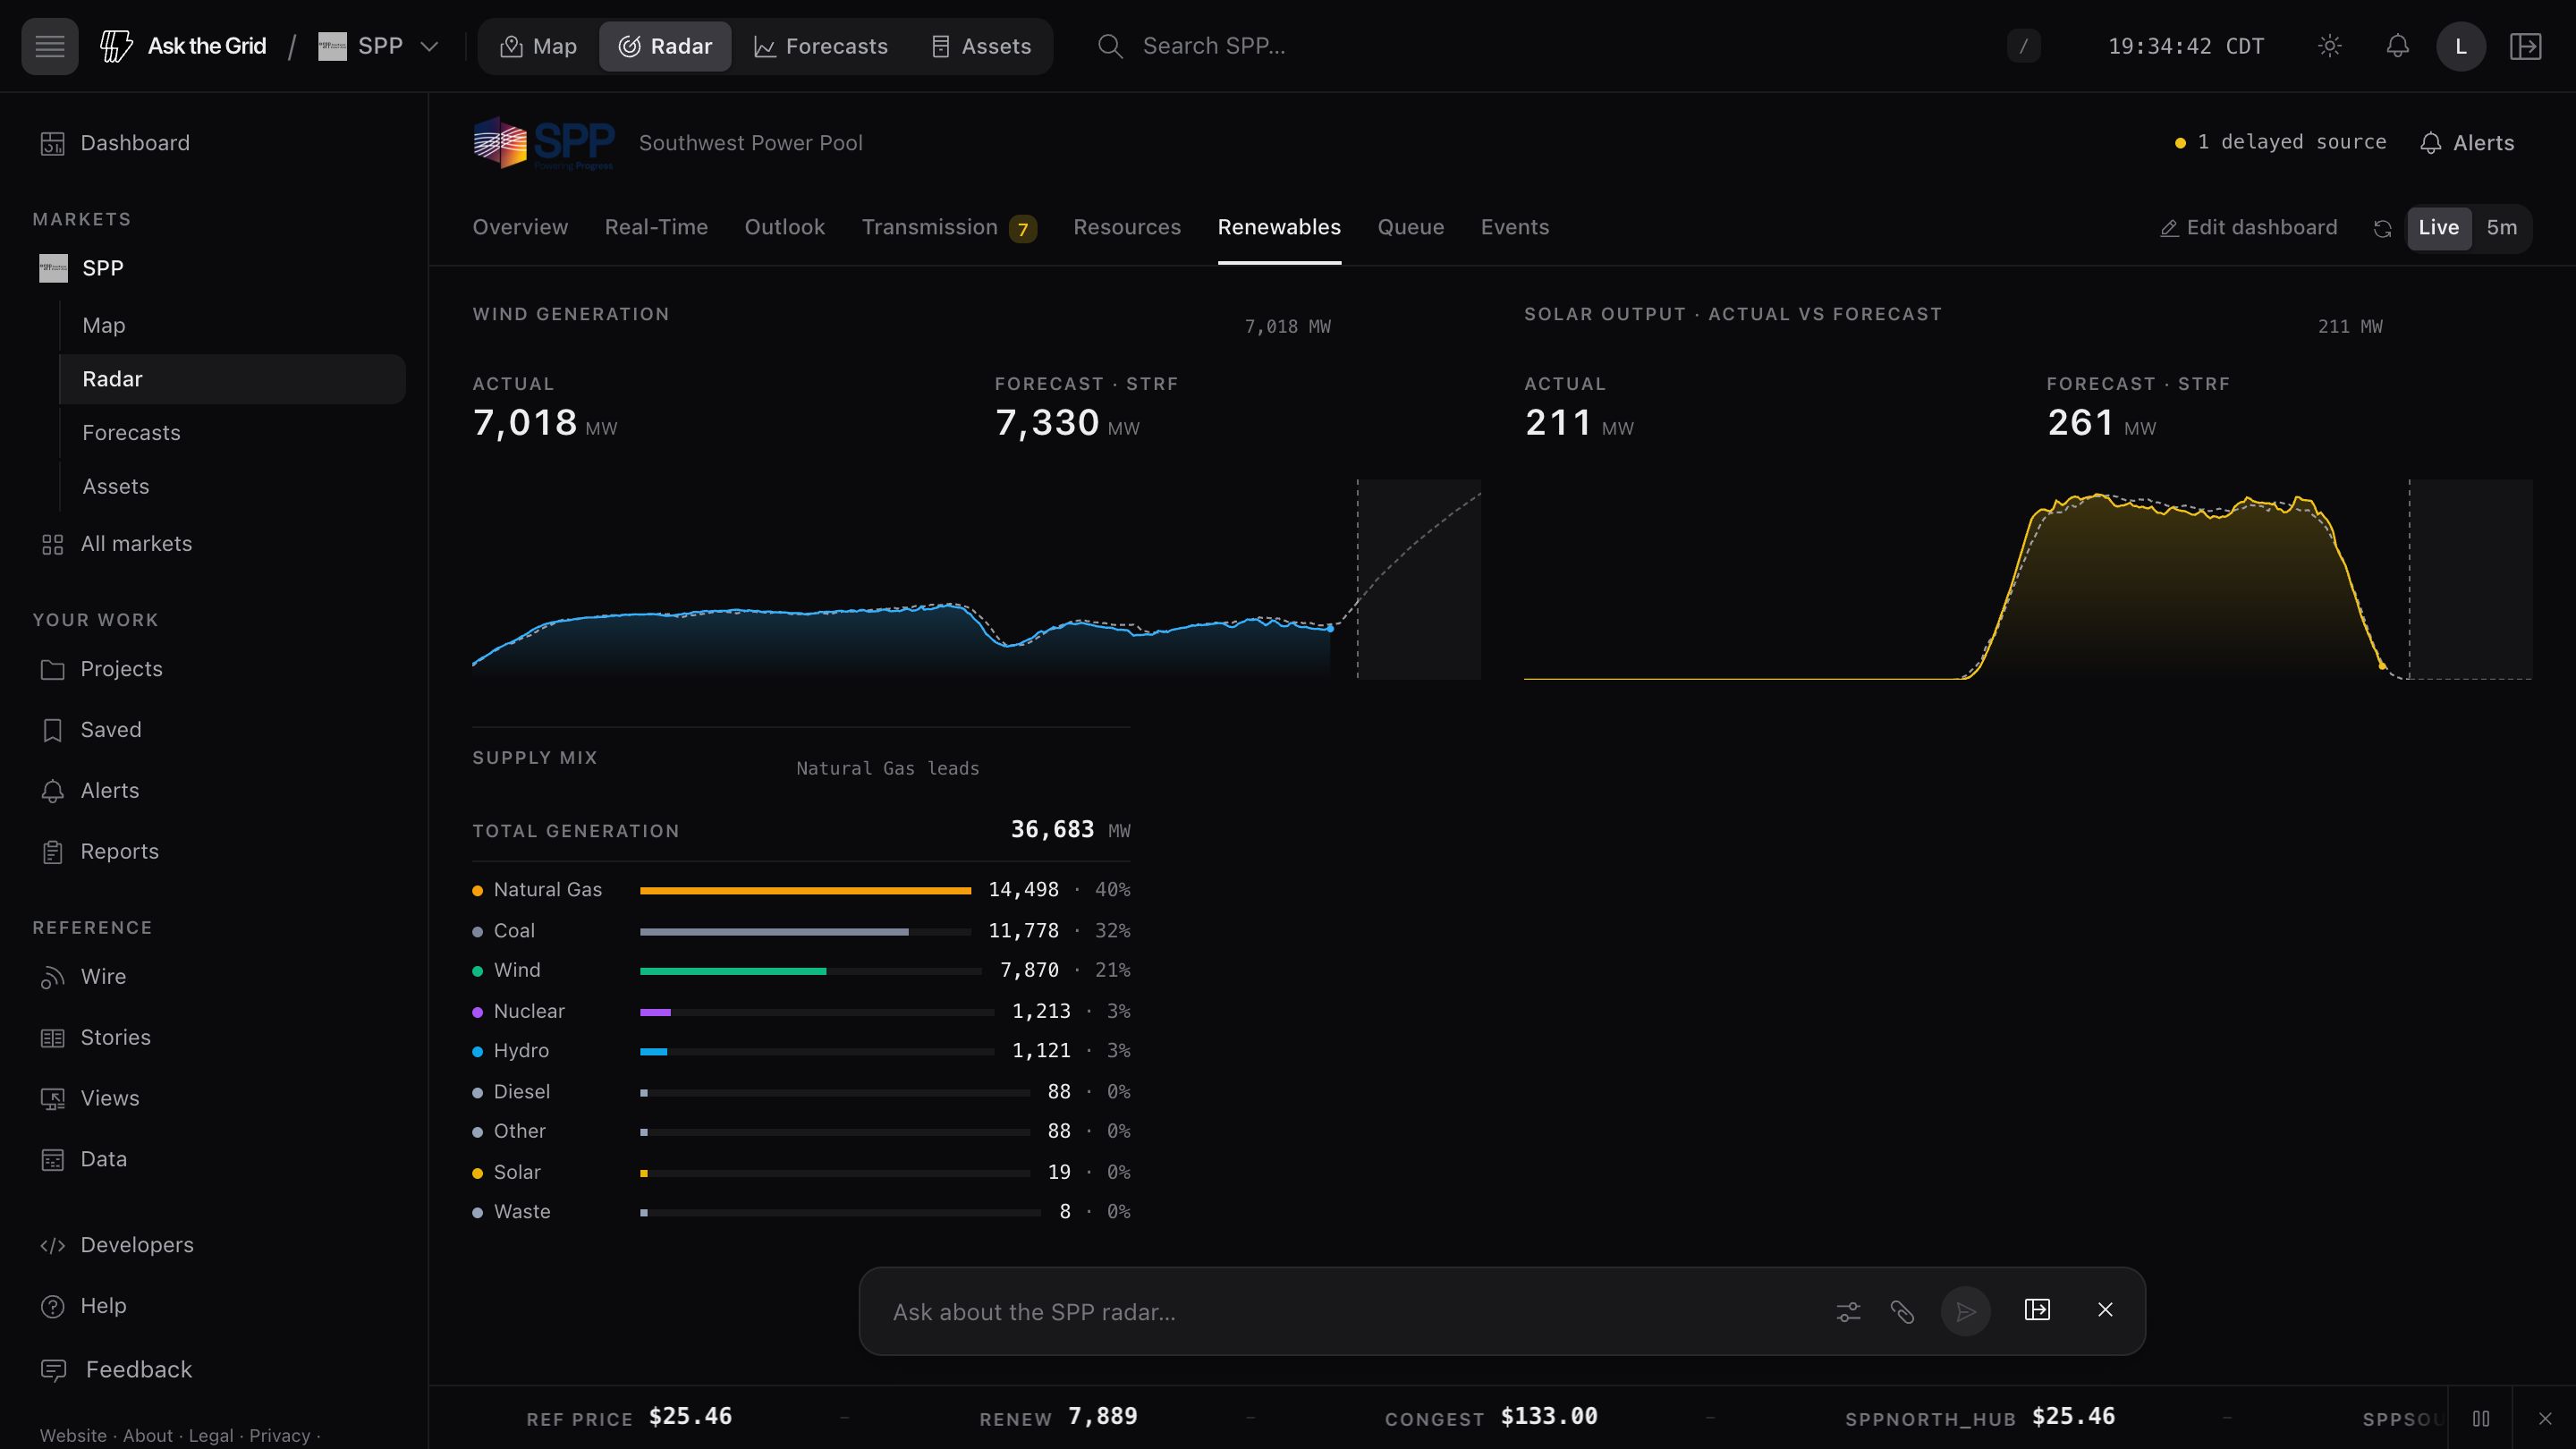
| Wind & fuel mix | Generation by fuel, with wind as the defining series | 5-min | Live |
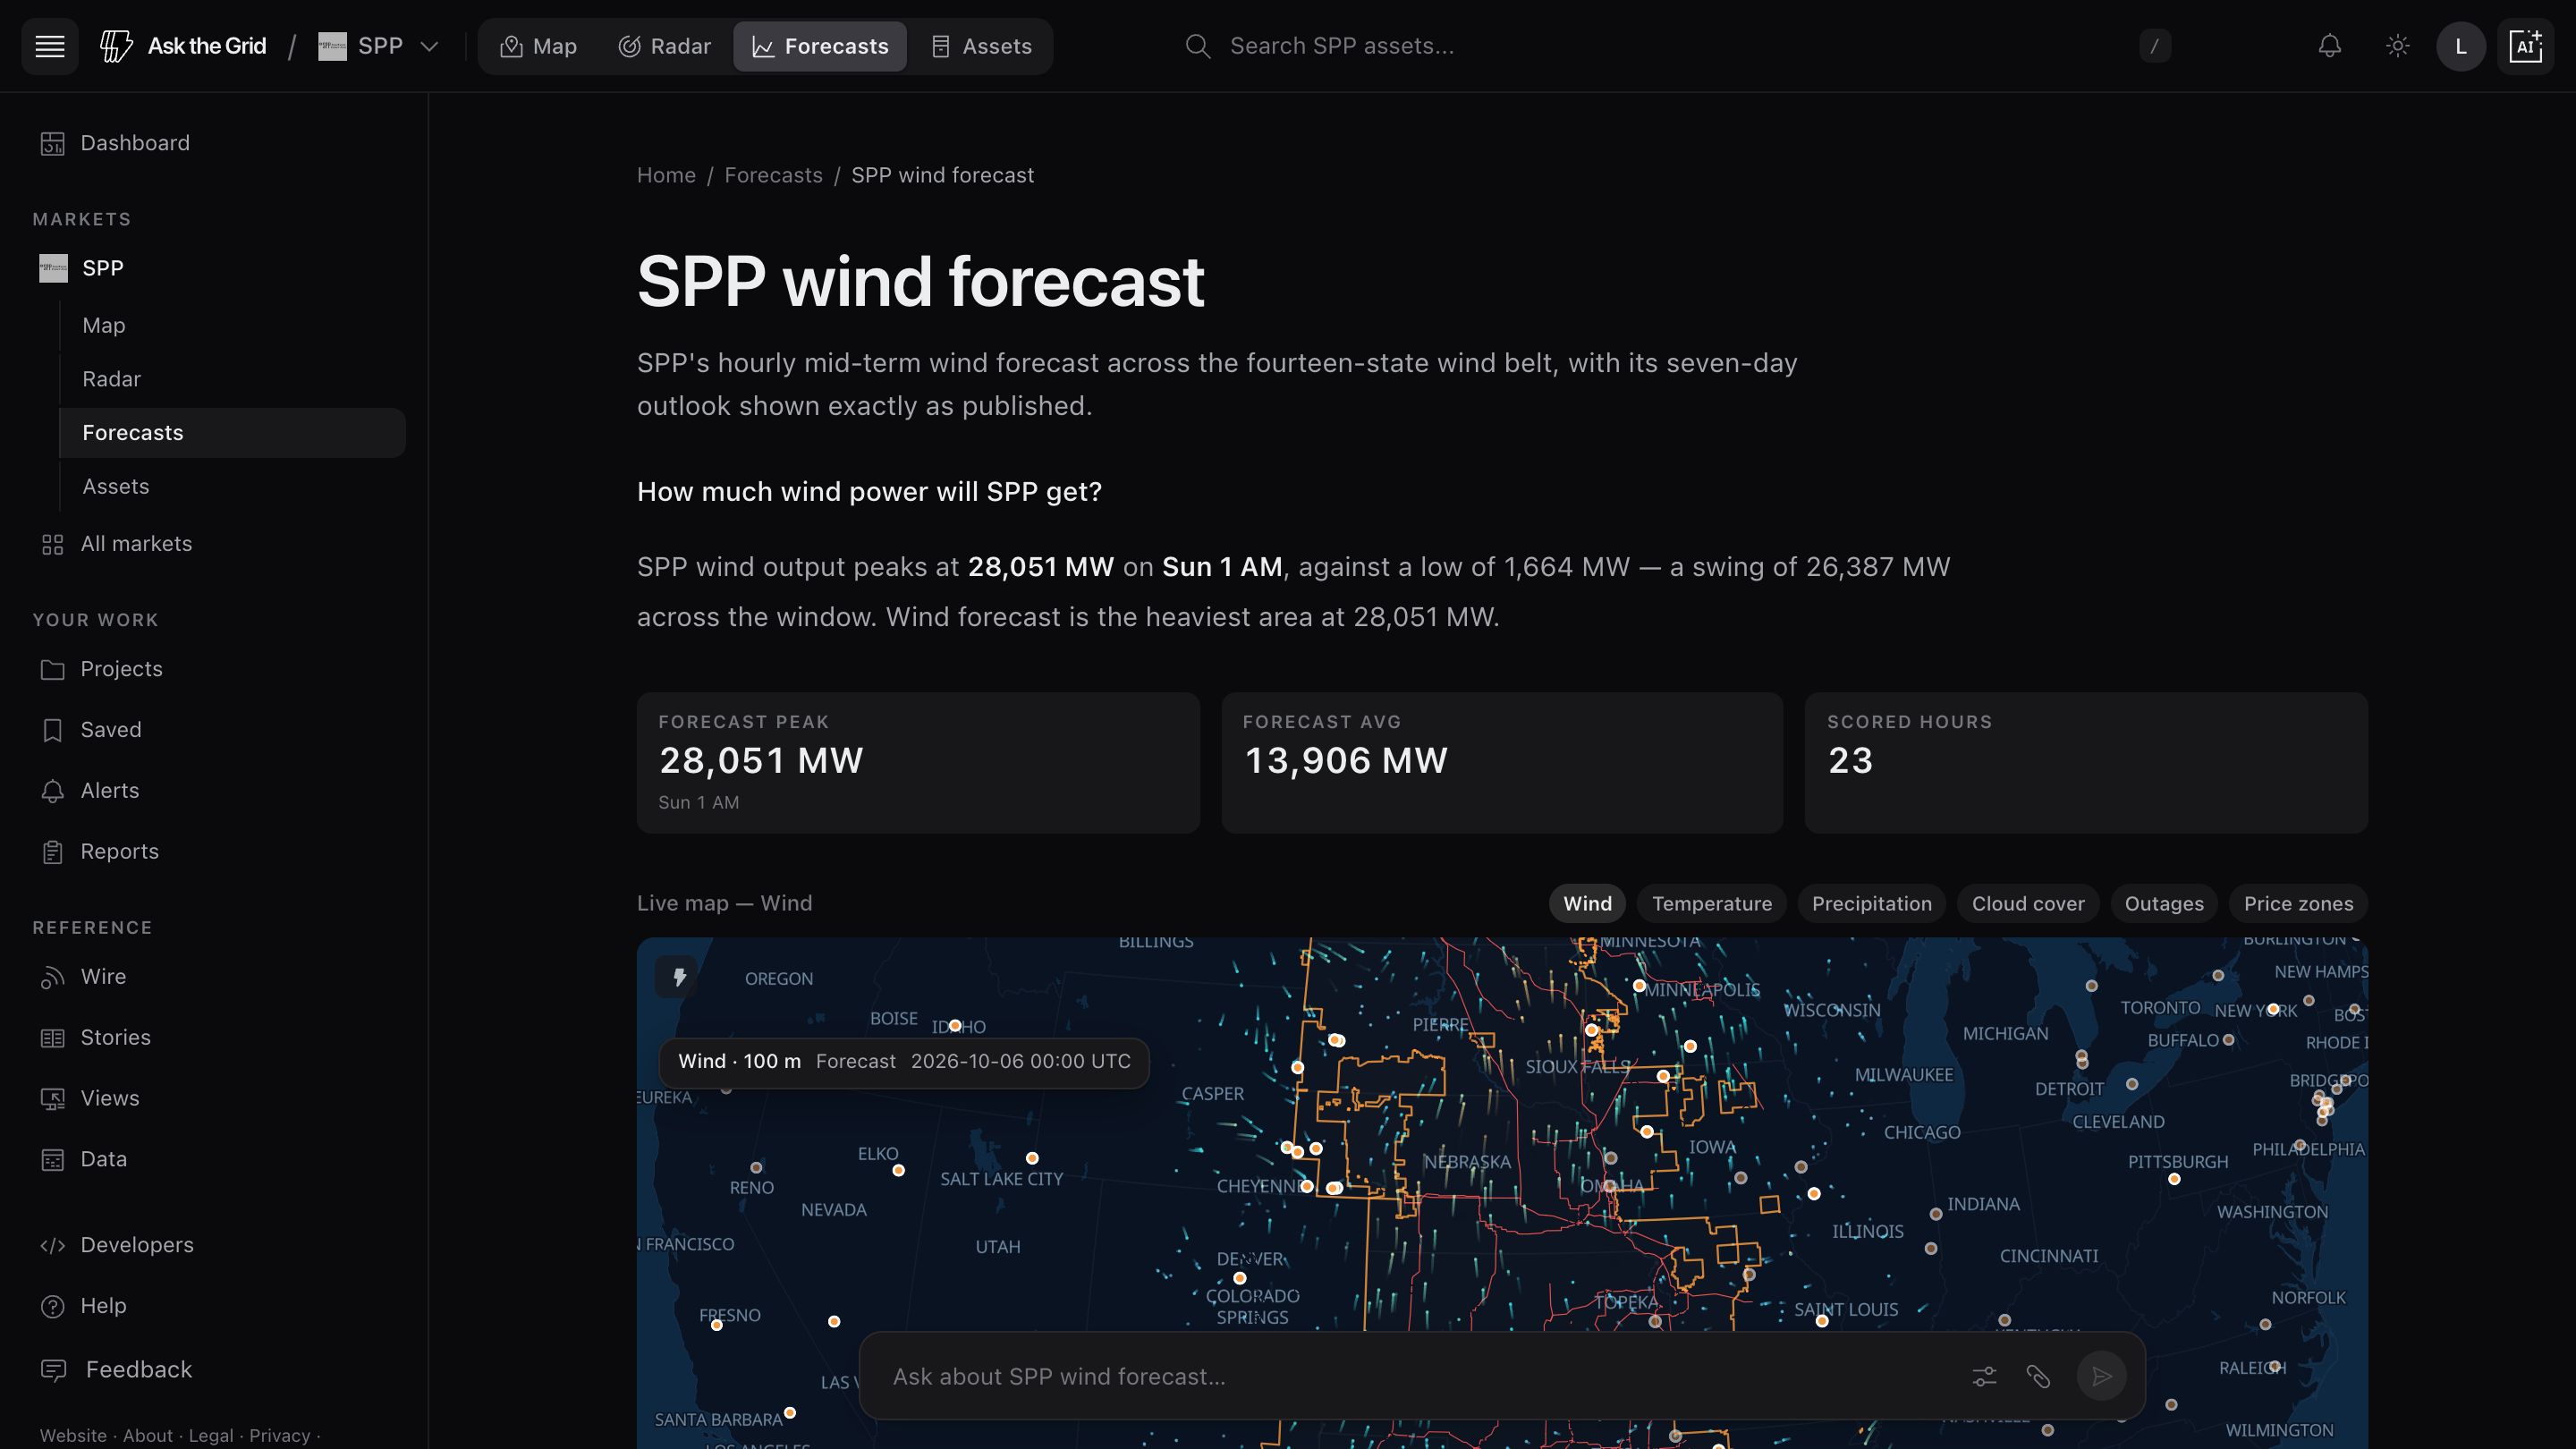
| Demand & forecasts | Actual load with short-term wind and solar forecasts | 5-min / frequent vintages | Live |
| Ancillary services | Cleared regulation, ramp, spin, supplemental and uncertainty prices | 5-min (RTBM) / hourly (DA) | Live |
| Constraints | Binding constraints with real-time shadow prices | 5-min | Live |
| Radar cockpit | Live wind and solar actuals against forecast, fuel mix, system conditions, hub prices, constraints, and six source clocks | Streaming / 5-min | Live |
Live intelligence for SPP
Browse every live viewEverything Ask the Grid publishes on SPP, in one place — what the grid is doing now, where it is headed, and what has been written about it.
Live views
Forecasts and outlooks
Coverage and analysis
Data and access
The product, as it runs
Recorded from the live product, with this market's data.
Read SPP hub prices, generation and constraints
Southwest Power Pool publishes nodal electricity prices and reference prices at its North and South trading hubs. Read each location on the operator's market clock, keeping real-time prices distinct from day-ahead results.
Compare published wind generation, other fuel output and demand with the matching price intervals. Binding-constraint reports can help investigate price separation; the fuel mix or a nodal spread alone does not establish the cause.
Open the SPP map to inspect pricing locations, transmission and interconnection requests. Use Radar for operating data or open a question in the agent with SPP already selected.
Read the market's language
Full glossaryAsk SPP what changed.
Open the live market and begin with a question, a place, or an interval.