Grid Forecast Accuracy: Comparing Five U.S. Power Markets
We compare day-ahead and real-time prices in ERCOT, CAISO, NYISO, PJM and SPP, then measure how ERCOT demand forecasts improve closer to delivery. Explore the findings behind Ask the Grid's accuracy page.
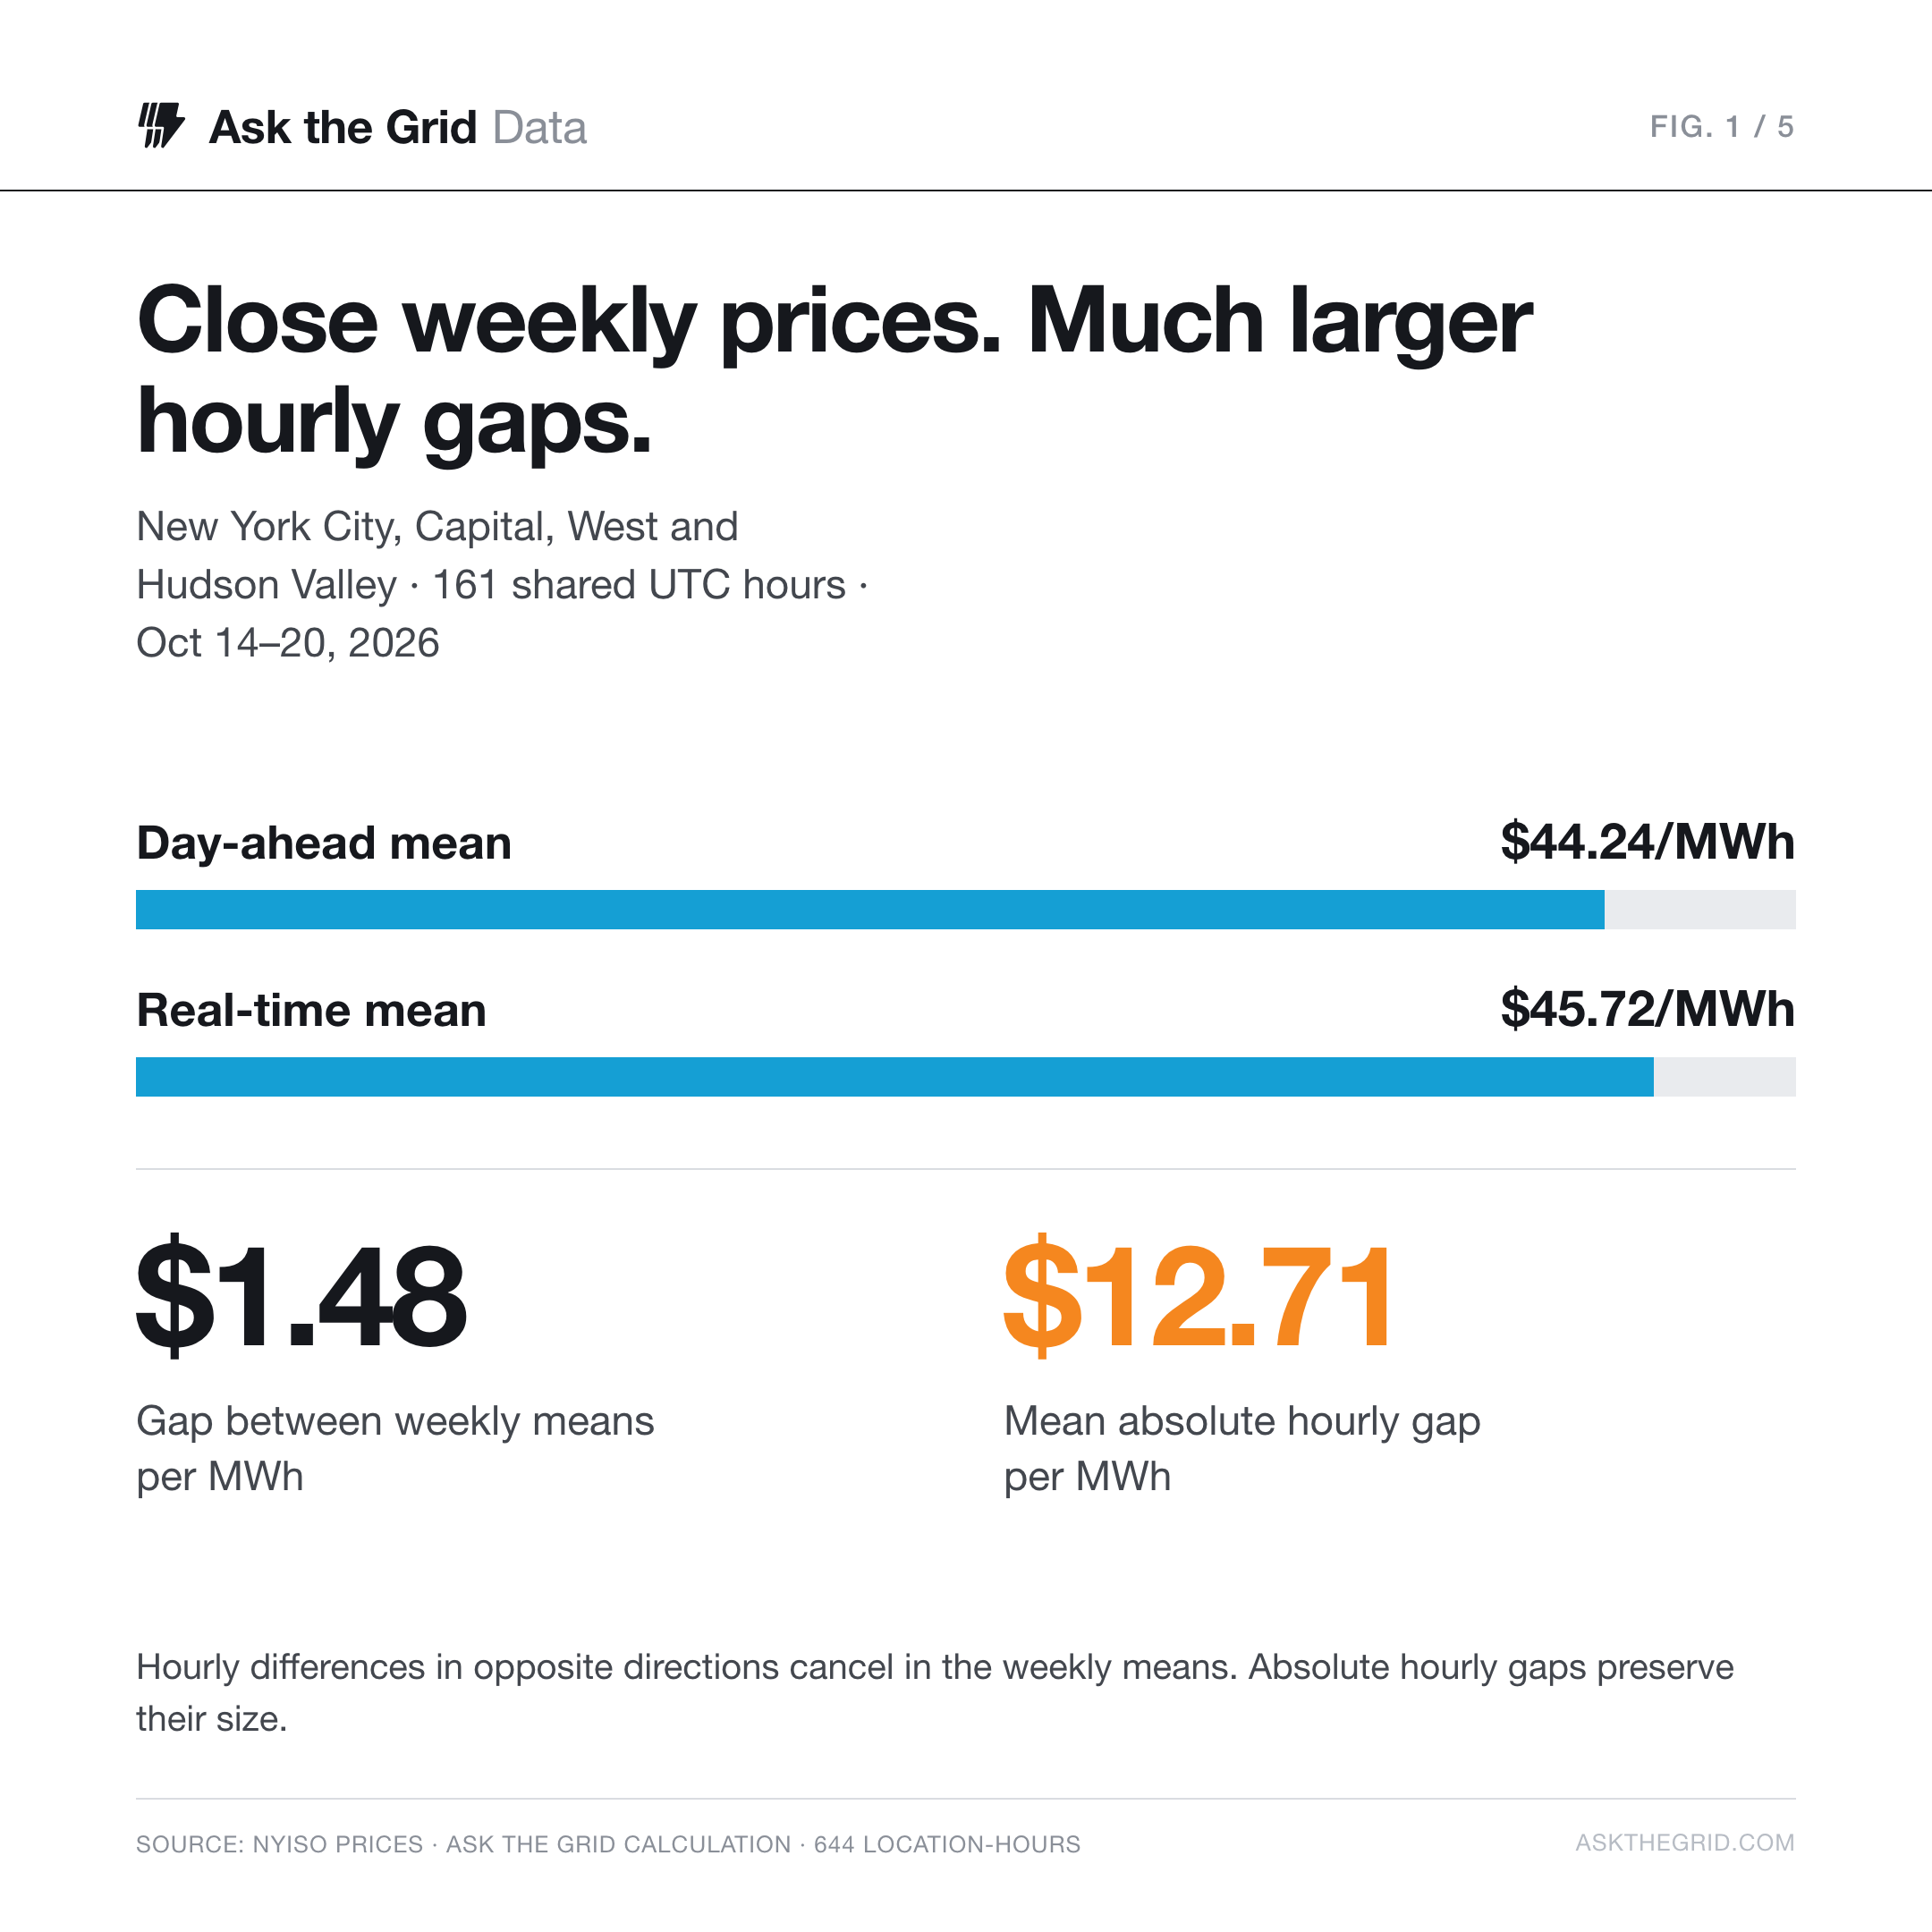
Across four New York price zones, the day-ahead auction averaged $44.24/MWh and real-time prices averaged $45.72/MWh during our seven-day study. The two averages were only $1.48/MWh apart. Match the prices hour by hour, however, and the average absolute gap was $12.71/MWh.
Both statements describe the same prices in the same 161 hours. The first lets high and low misses cancel. The second counts how far apart the two markets cleared in each location-hour. Anyone exposed to particular hours needs the second number. This is one week, a handful of price locations per market, and a comparison of two market prices rather than a verdict on any forecast model, so read the patterns below as what happened in these hours.
Watch the misses cancel
- -1.48 $/MWh
- 12.71 $/MWh
- 644
We ran a frozen analysis of October 14–20, 2026 UTC to show why forecast accuracy needs a measure of size, a measure of direction and a clock. It matches 2,737 hourly price pairs across five U.S. markets and compares two published ERCOT demand-forecast vintages on the same 168 delivery hours. Our forecast accuracy page tracks the same measures on a rolling window.
Five markets. Seventeen price locations.
A weekly average can conceal the hours that mattered#
New York's small weekly difference was the remainder of much larger differences in both directions. Across the four zones, day-ahead prices averaged $17.57/MWh below real time on October 14 and $9.13/MWh above it on October 18. Averaging the signed differences pulled the week toward zero.
That net direction is bias, calculated here as day-ahead minus real-time price: positive means the auction cleared higher. Mean absolute error, or average miss, makes every hourly difference positive first. A $10 high miss and a $10 low miss each add $10 to the average miss, while their bias is zero. In this sample the average absolute hourly gap was 8.6 times the gap between the weekly means.
The same hours reveal different price patterns#
Follow the gap, hour by hour
- 12.71 $/MWh
- -1.48 $/MWh
- 644
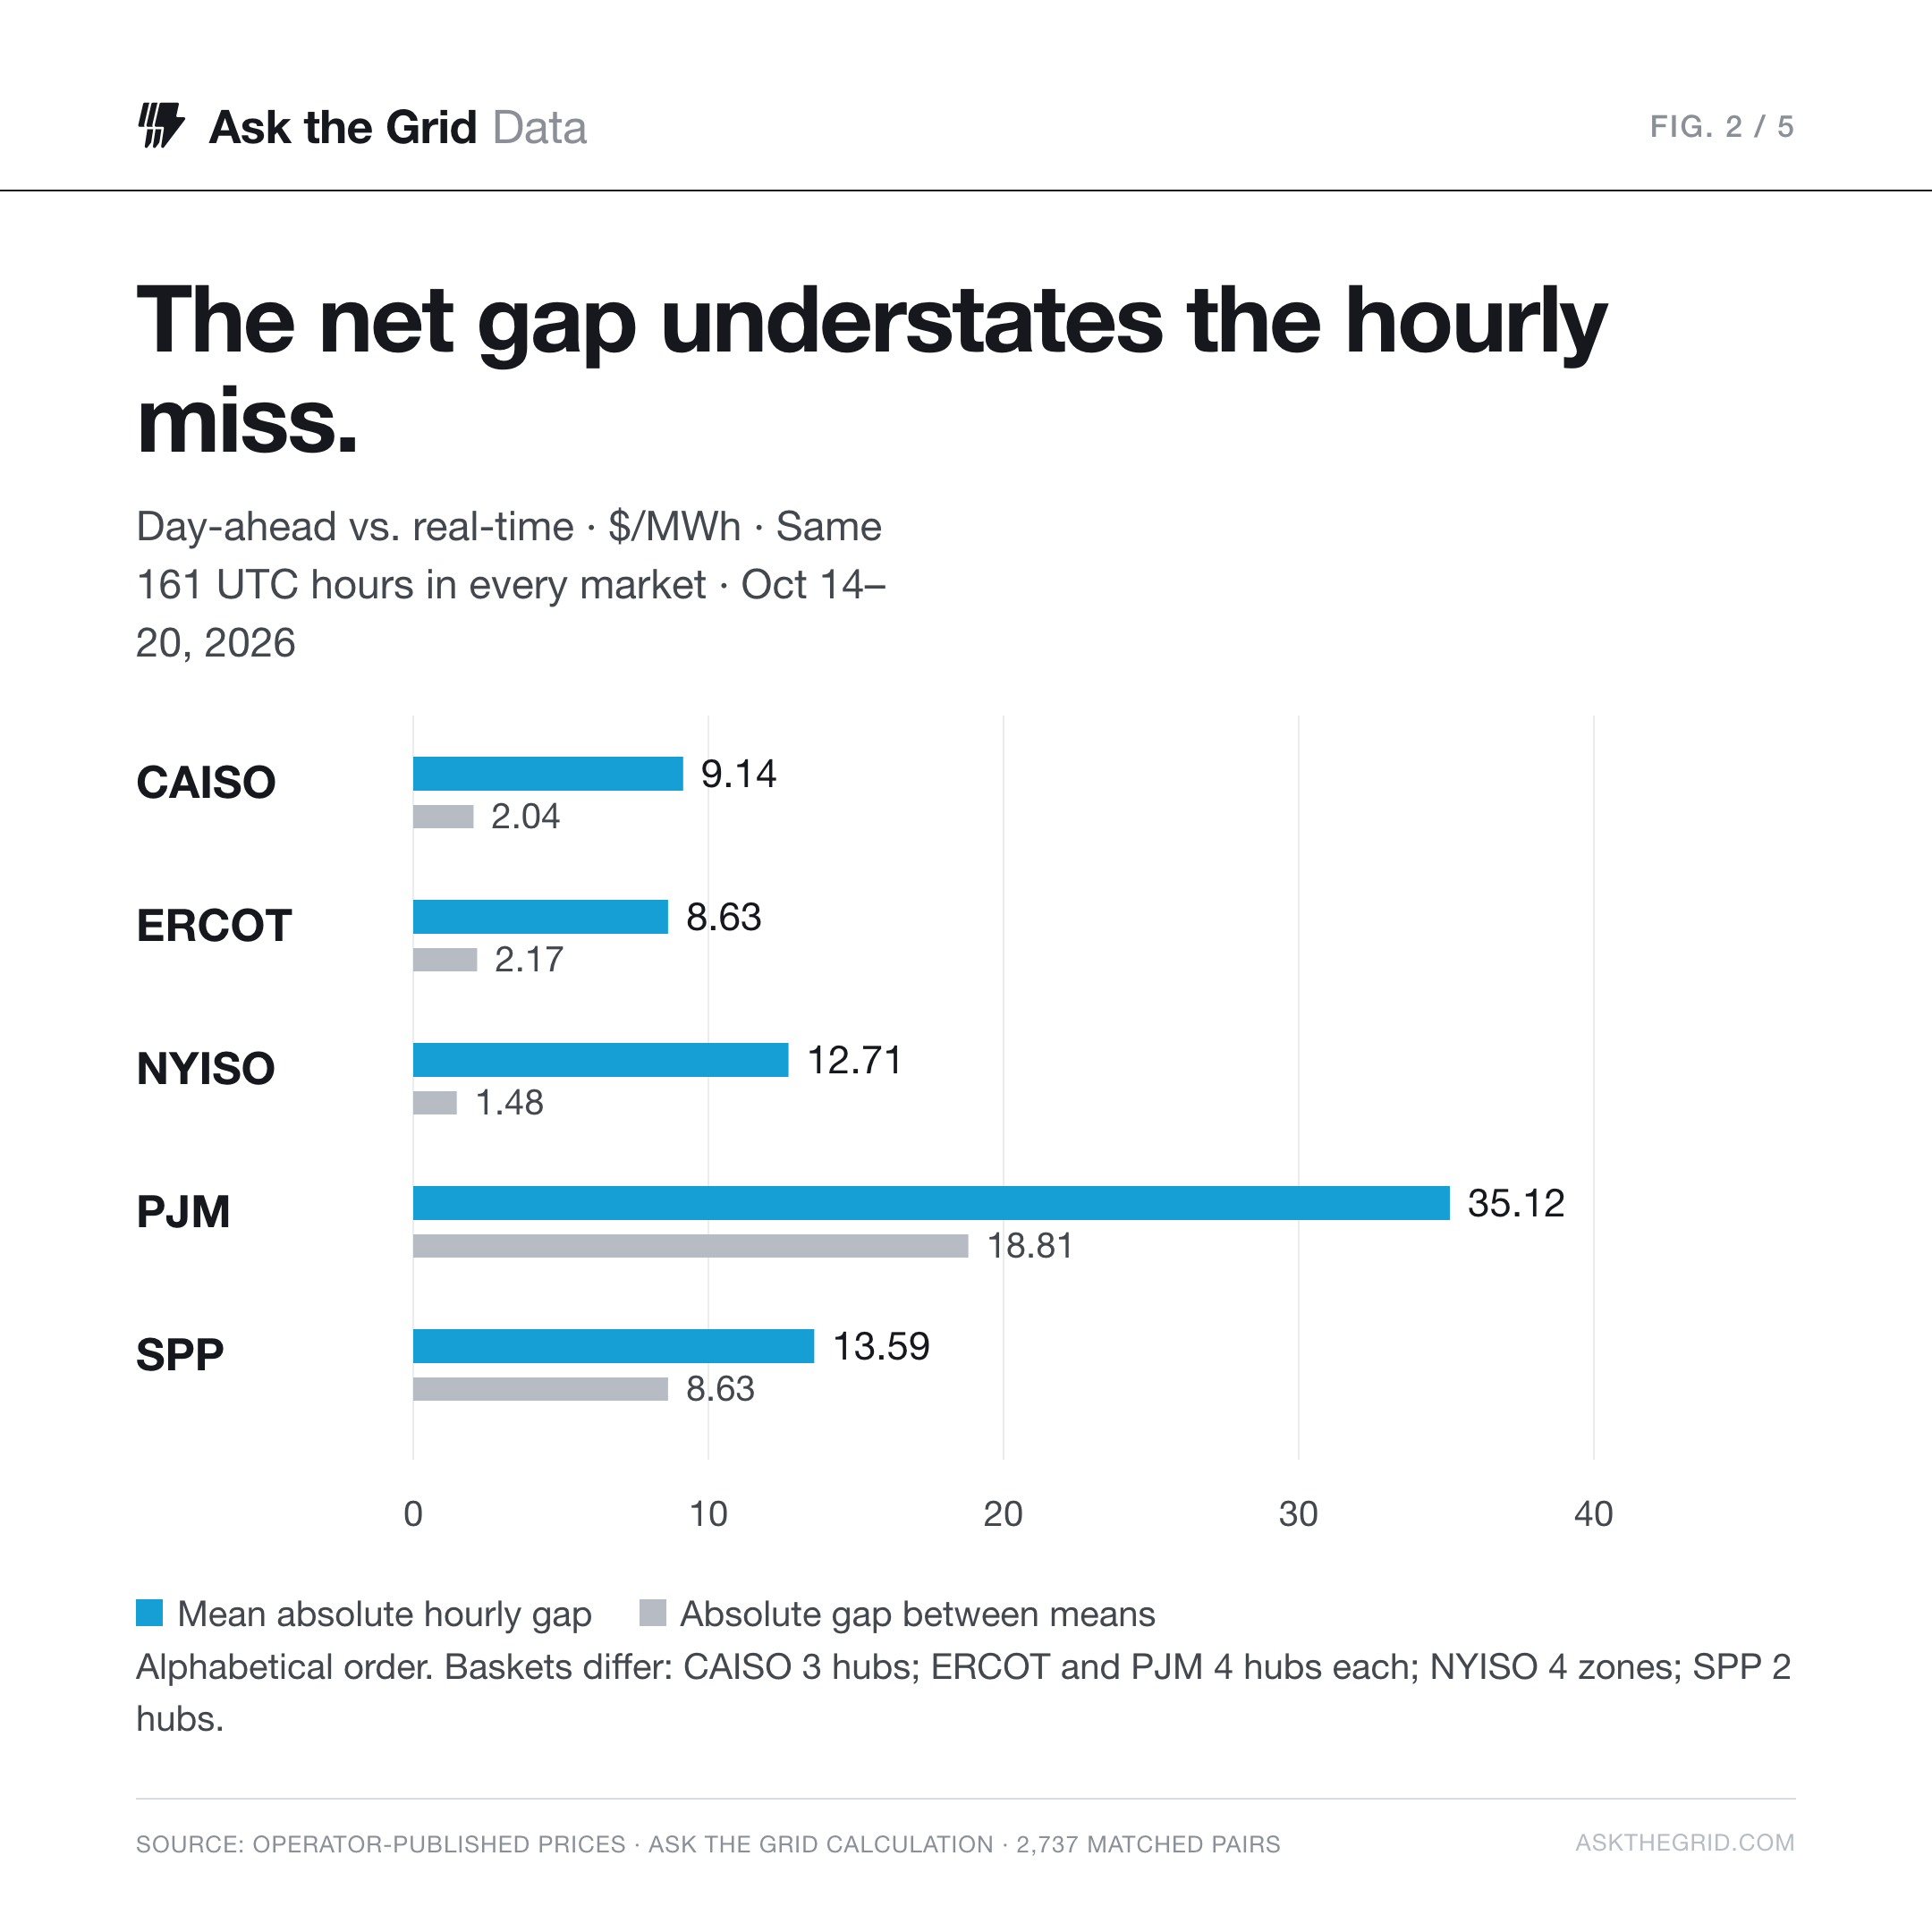
The gap between the weekly means was smaller than the mean absolute hourly miss in every included market. In ERCOT, a $2.17/MWh net premium sat alongside an $8.63/MWh average miss. In CAISO, the corresponding figures were $2.04/MWh and $9.14/MWh. SPP retained more of its direction in the weekly result: an $8.63/MWh day-ahead premium against a $13.59/MWh average absolute gap.
PJM had the largest gap among these baskets: $35.12/MWh, with day-ahead prices $18.81/MWh higher on average. Baskets differ in size and location, from two hubs in SPP to four in PJM, so these figures describe these hubs and this week rather than ranking the markets.
A small share of location-hours carried half the miss#
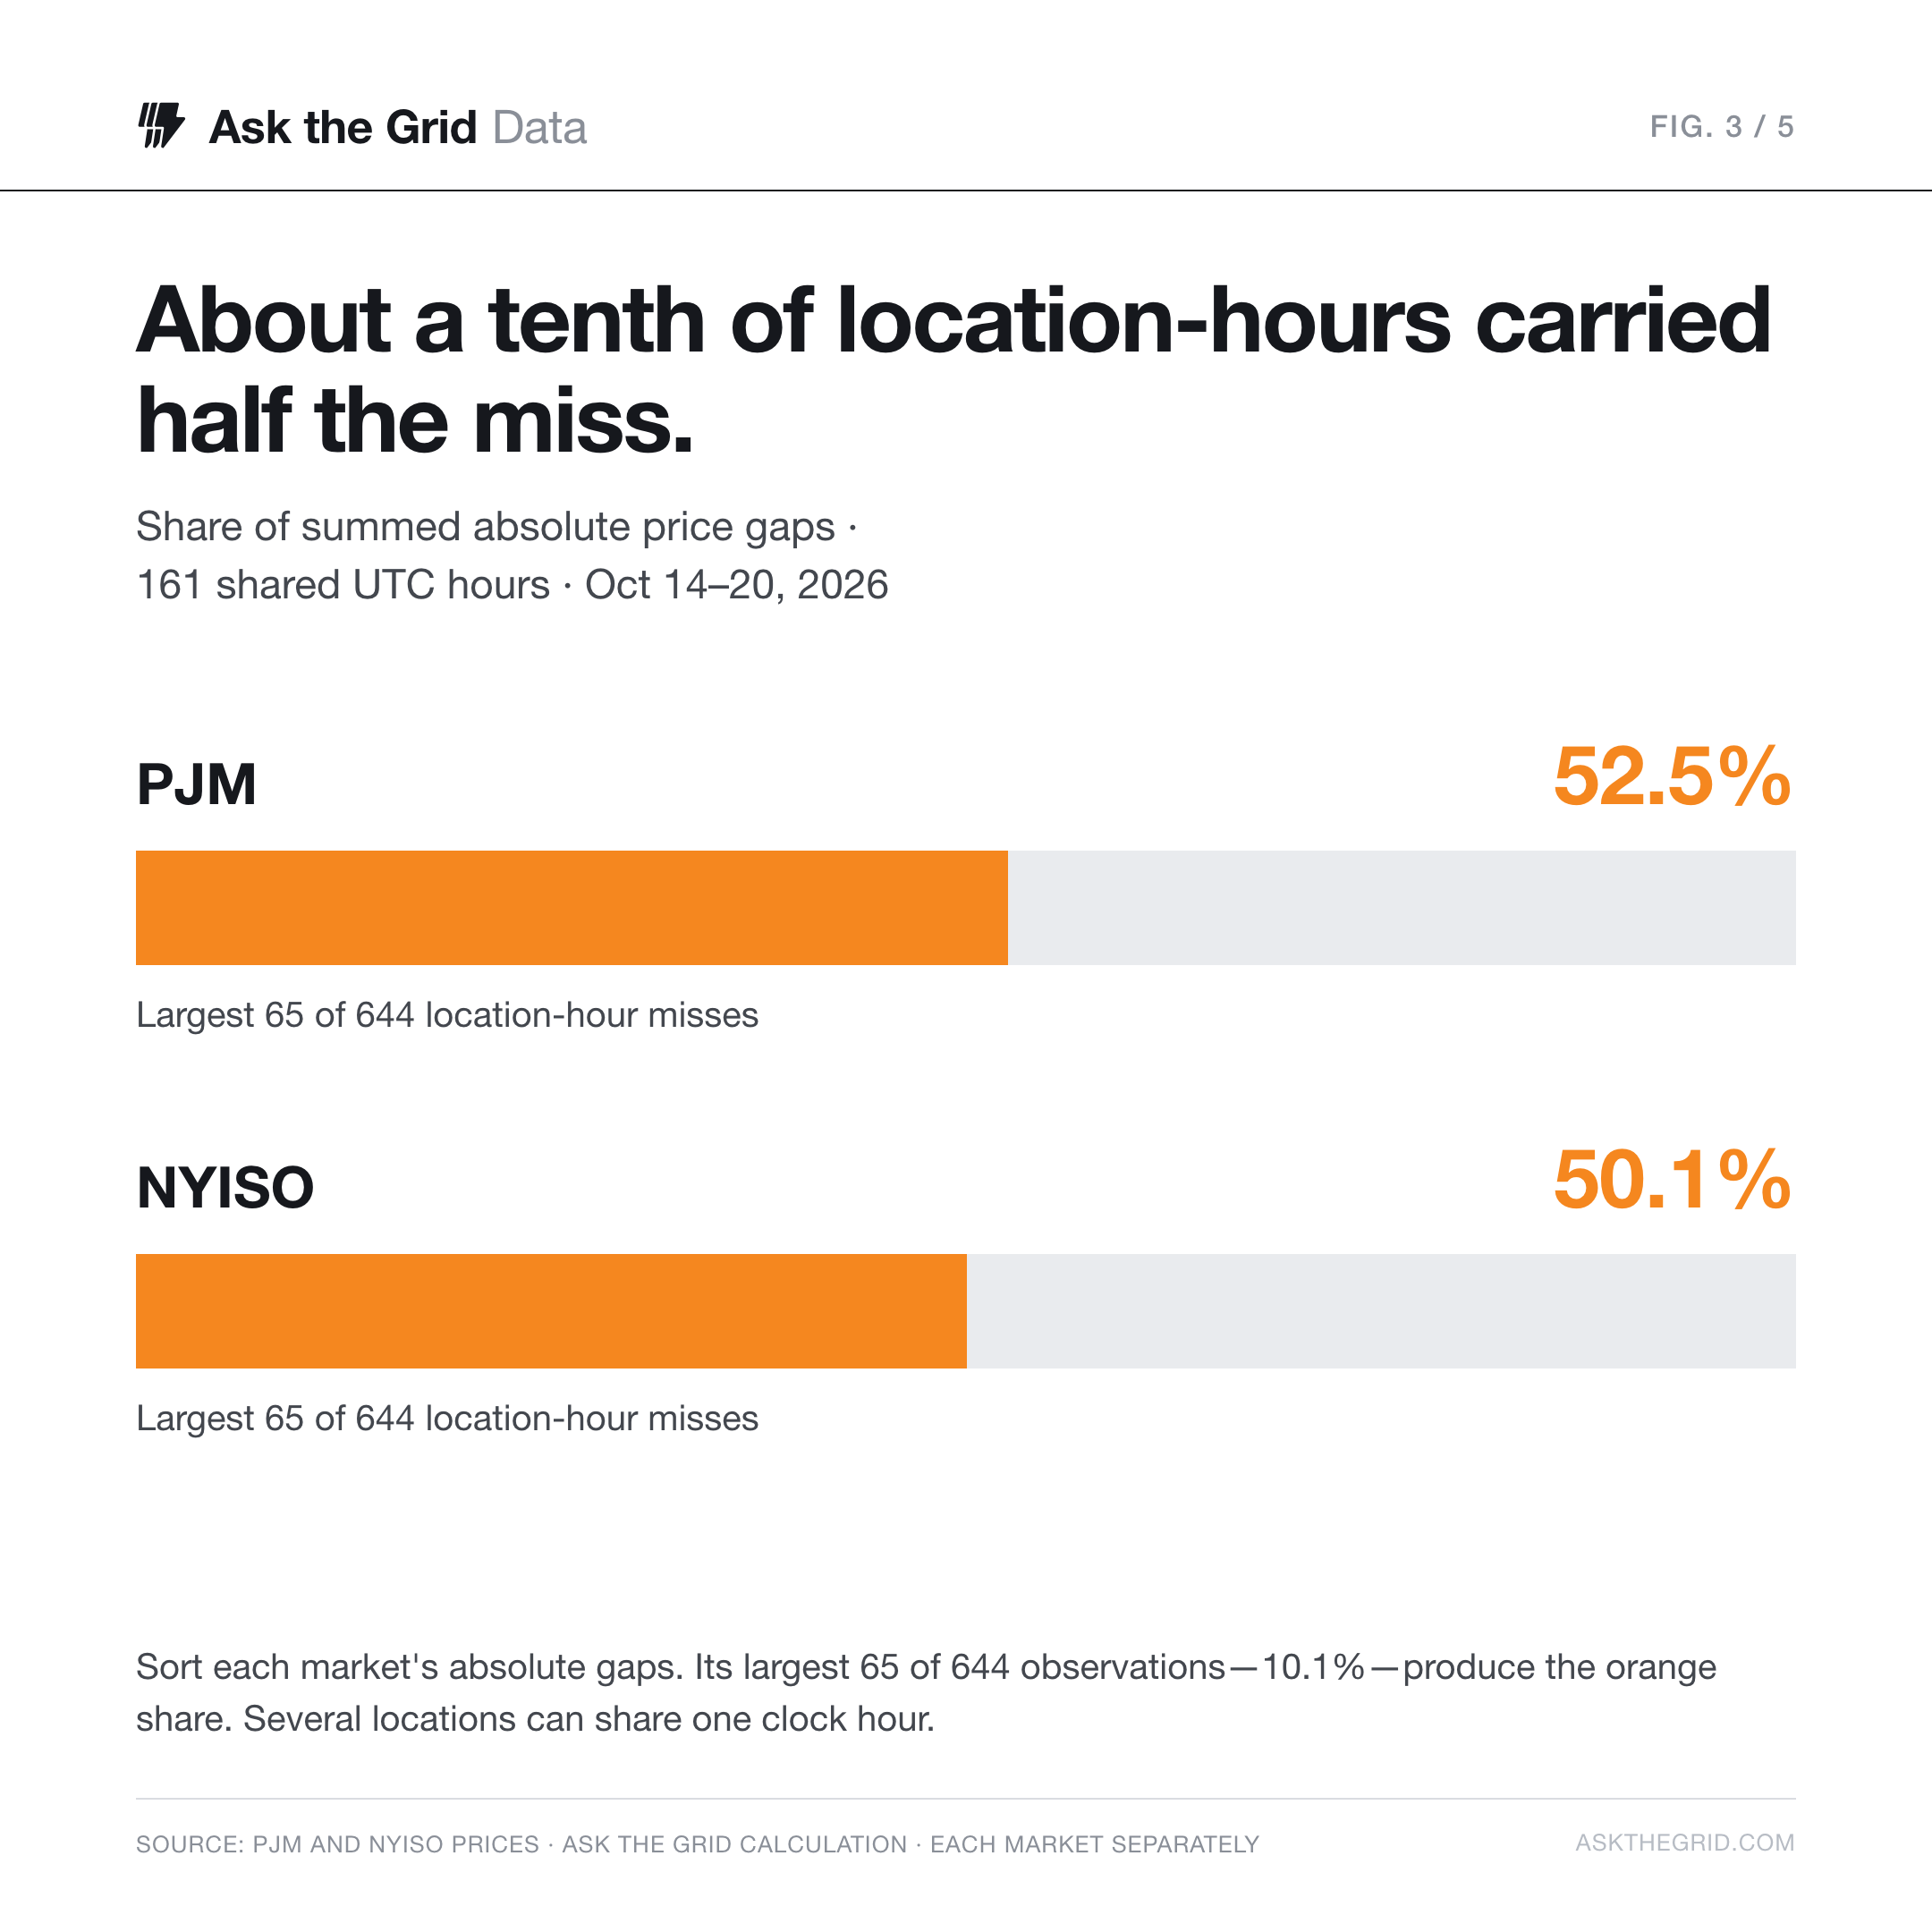
The price gaps were unevenly distributed. In PJM, the 65 largest absolute misses out of 644 location-hours contributed 52.5% of the total absolute gap. In New York, the same count contributed 50.1%. About a tenth of the observations carried about half the measured miss in each of those two baskets.
How much of the miss lives in the tail?
- 10.1%
- 52.5%
- 65 / 644
The three largest location-hour gaps
| Hour start · UTC | Location | Absolute gap · $/MWh |
|---|---|---|
| Oct 14, 22:00 UTC | Northern Illinois Hub | 807.78 |
| Oct 14, 22:00 UTC | Western Hub | 622.13 |
| Oct 14, 23:00 UTC | Northern Illinois Hub | 591.94 |
The concentration pulls the mean well above the middle hour. New York's median absolute gap was $6.35/MWh against a $12.71/MWh mean; PJM's was $15.23/MWh against $35.12/MWh. For anyone assessing a forecast, the question after “how large was the average miss?” is where it accumulated.
ERCOT’s later load forecast had half the error#
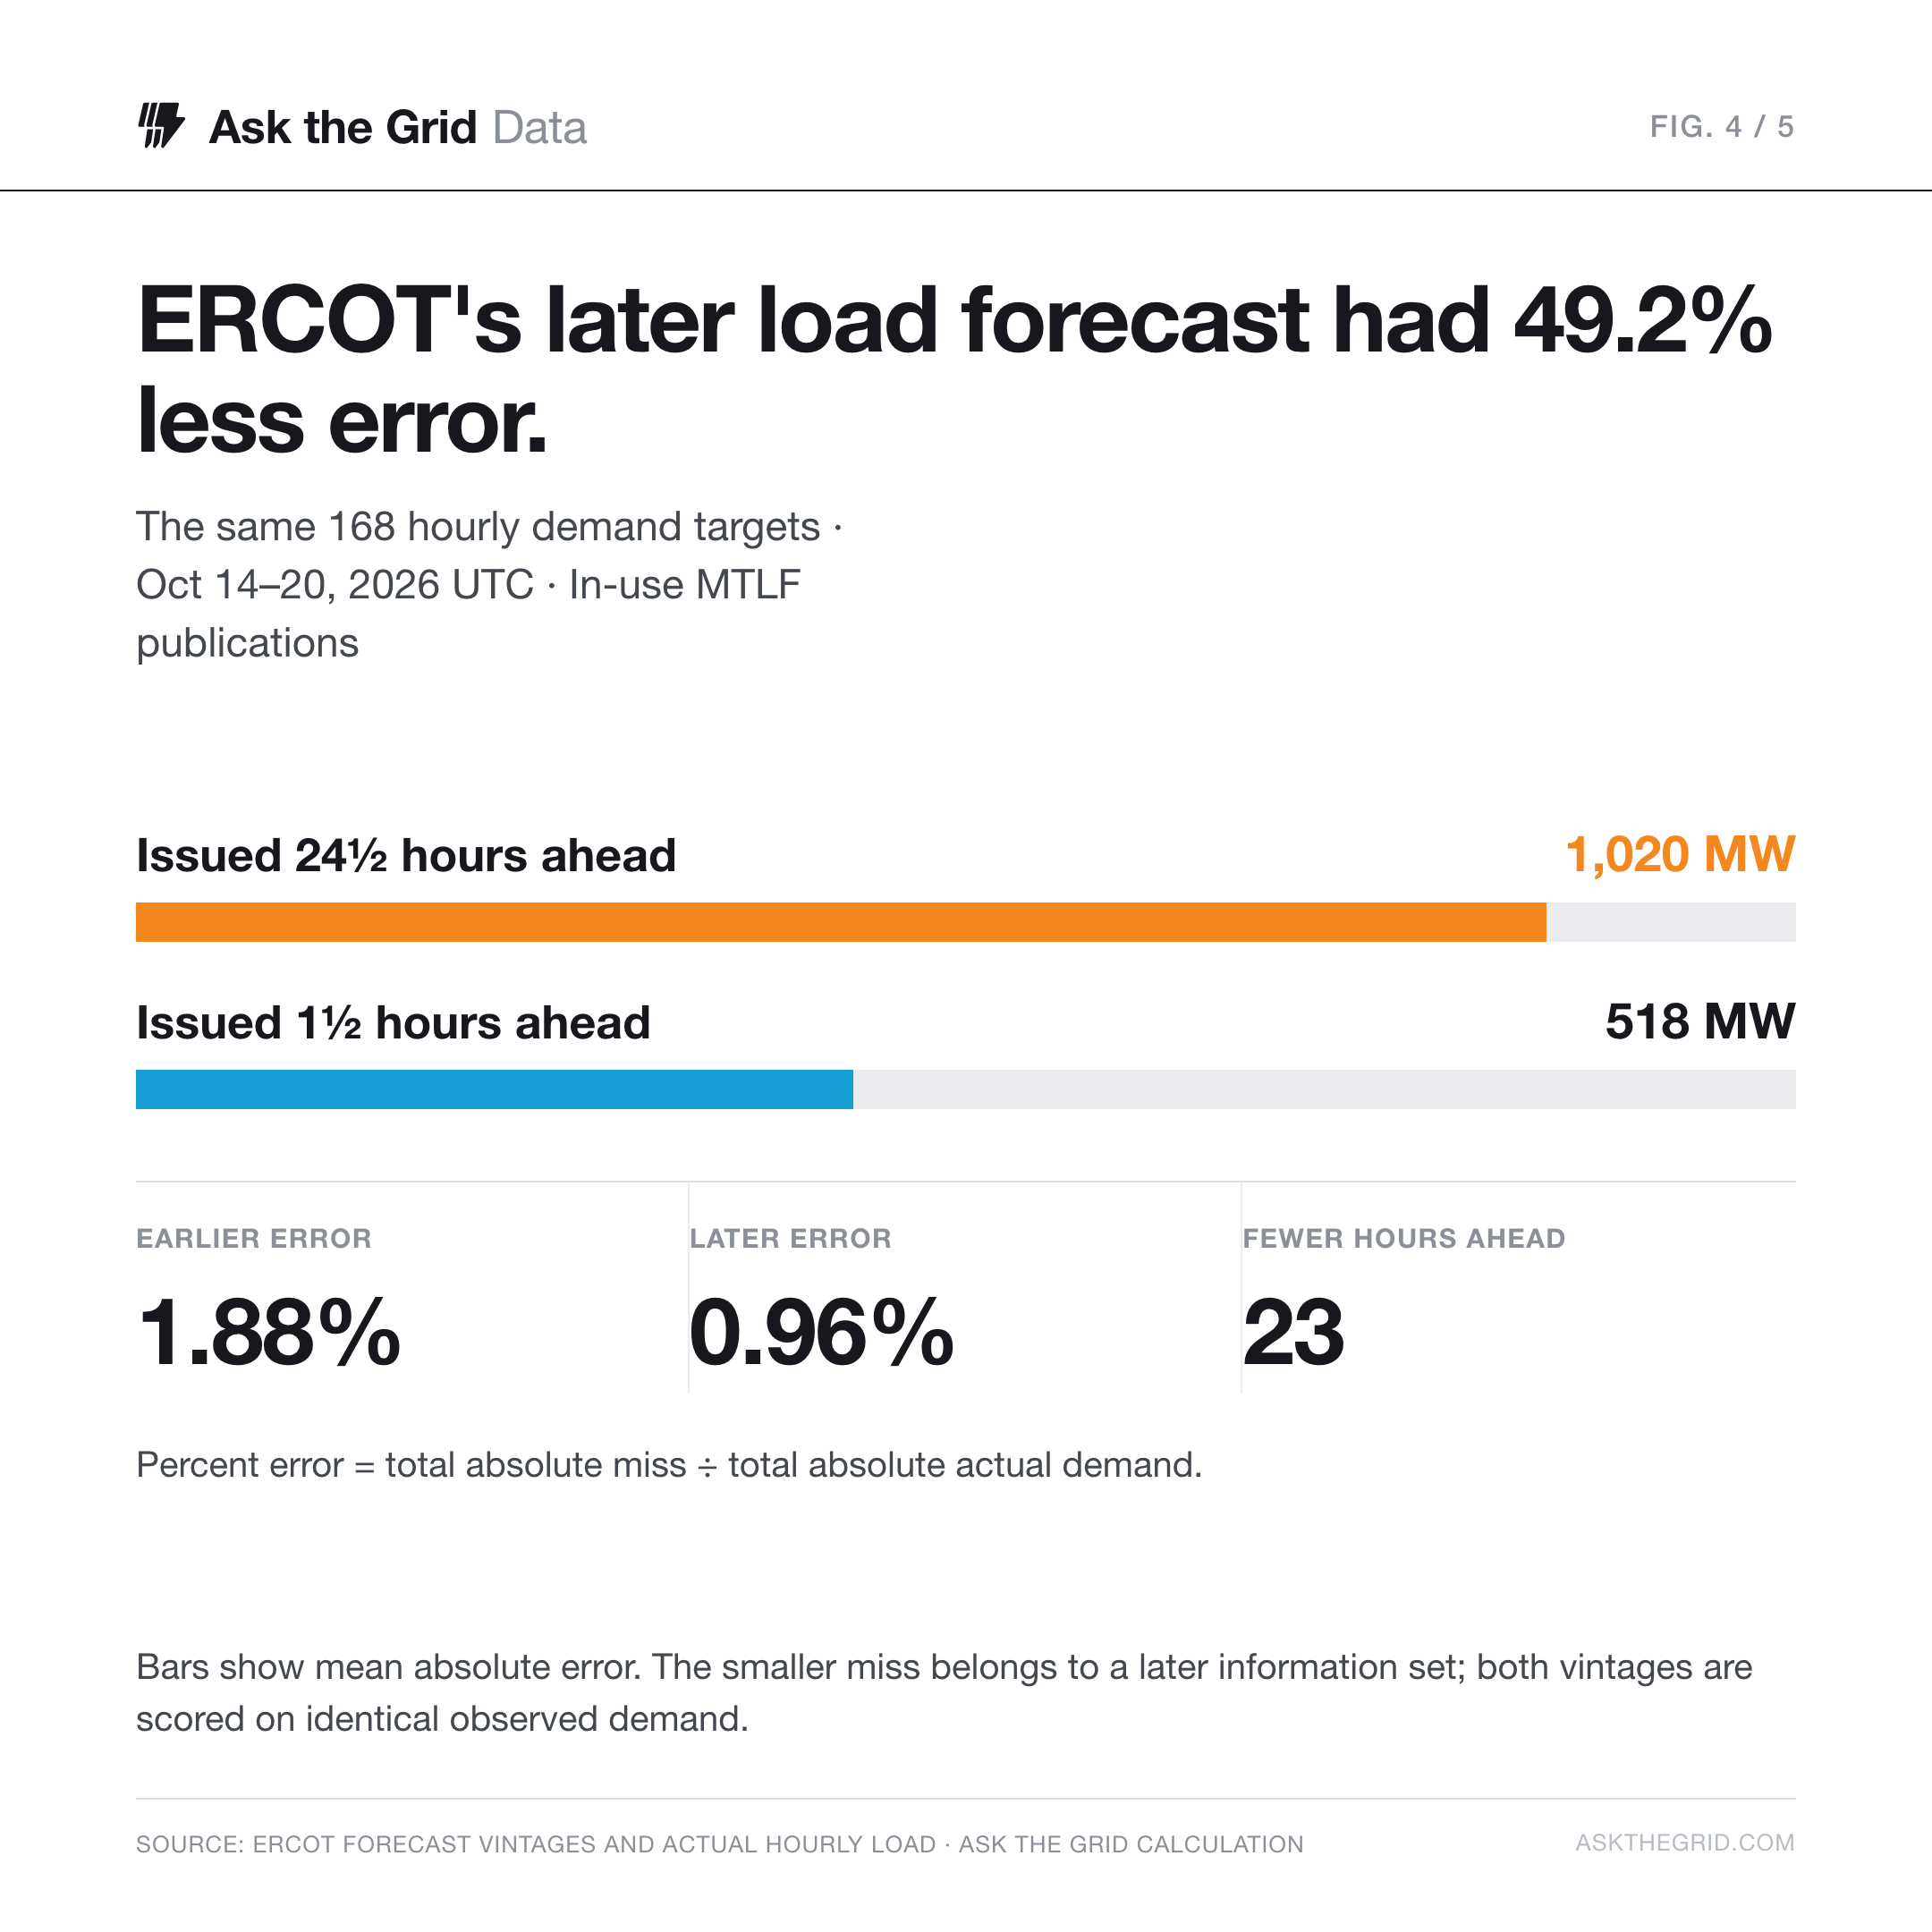
A forecast's issue time changes the task being measured. We took ERCOT's in-use Mid-Term Load Forecast for each of the week's 168 hourly demand targets, once with a cutoff at least 24 hours before the target and once with a cutoff at least one hour before it. In the retained publications, the actual lead times were 24½ hours and 1½ hours for every target.
The earlier vintage missed actual demand by an average of 1,020 MW. The later vintage missed by 518 MW: 49.2% less mean absolute error on exactly the same observed hours. Expressed as total absolute miss divided by total absolute actual demand, the error fell from 1.88% to 0.96%.
Same delivery hour. Different information.
- 76,365 MW
- -1,451 MW
- +292 MW
This compares two information sets for the same system and delivery hours. The later forecast is closer to the outcome, but it becomes available 23 hours later. A day-ahead decision has to use the earlier one; a near-delivery update can use the later one.
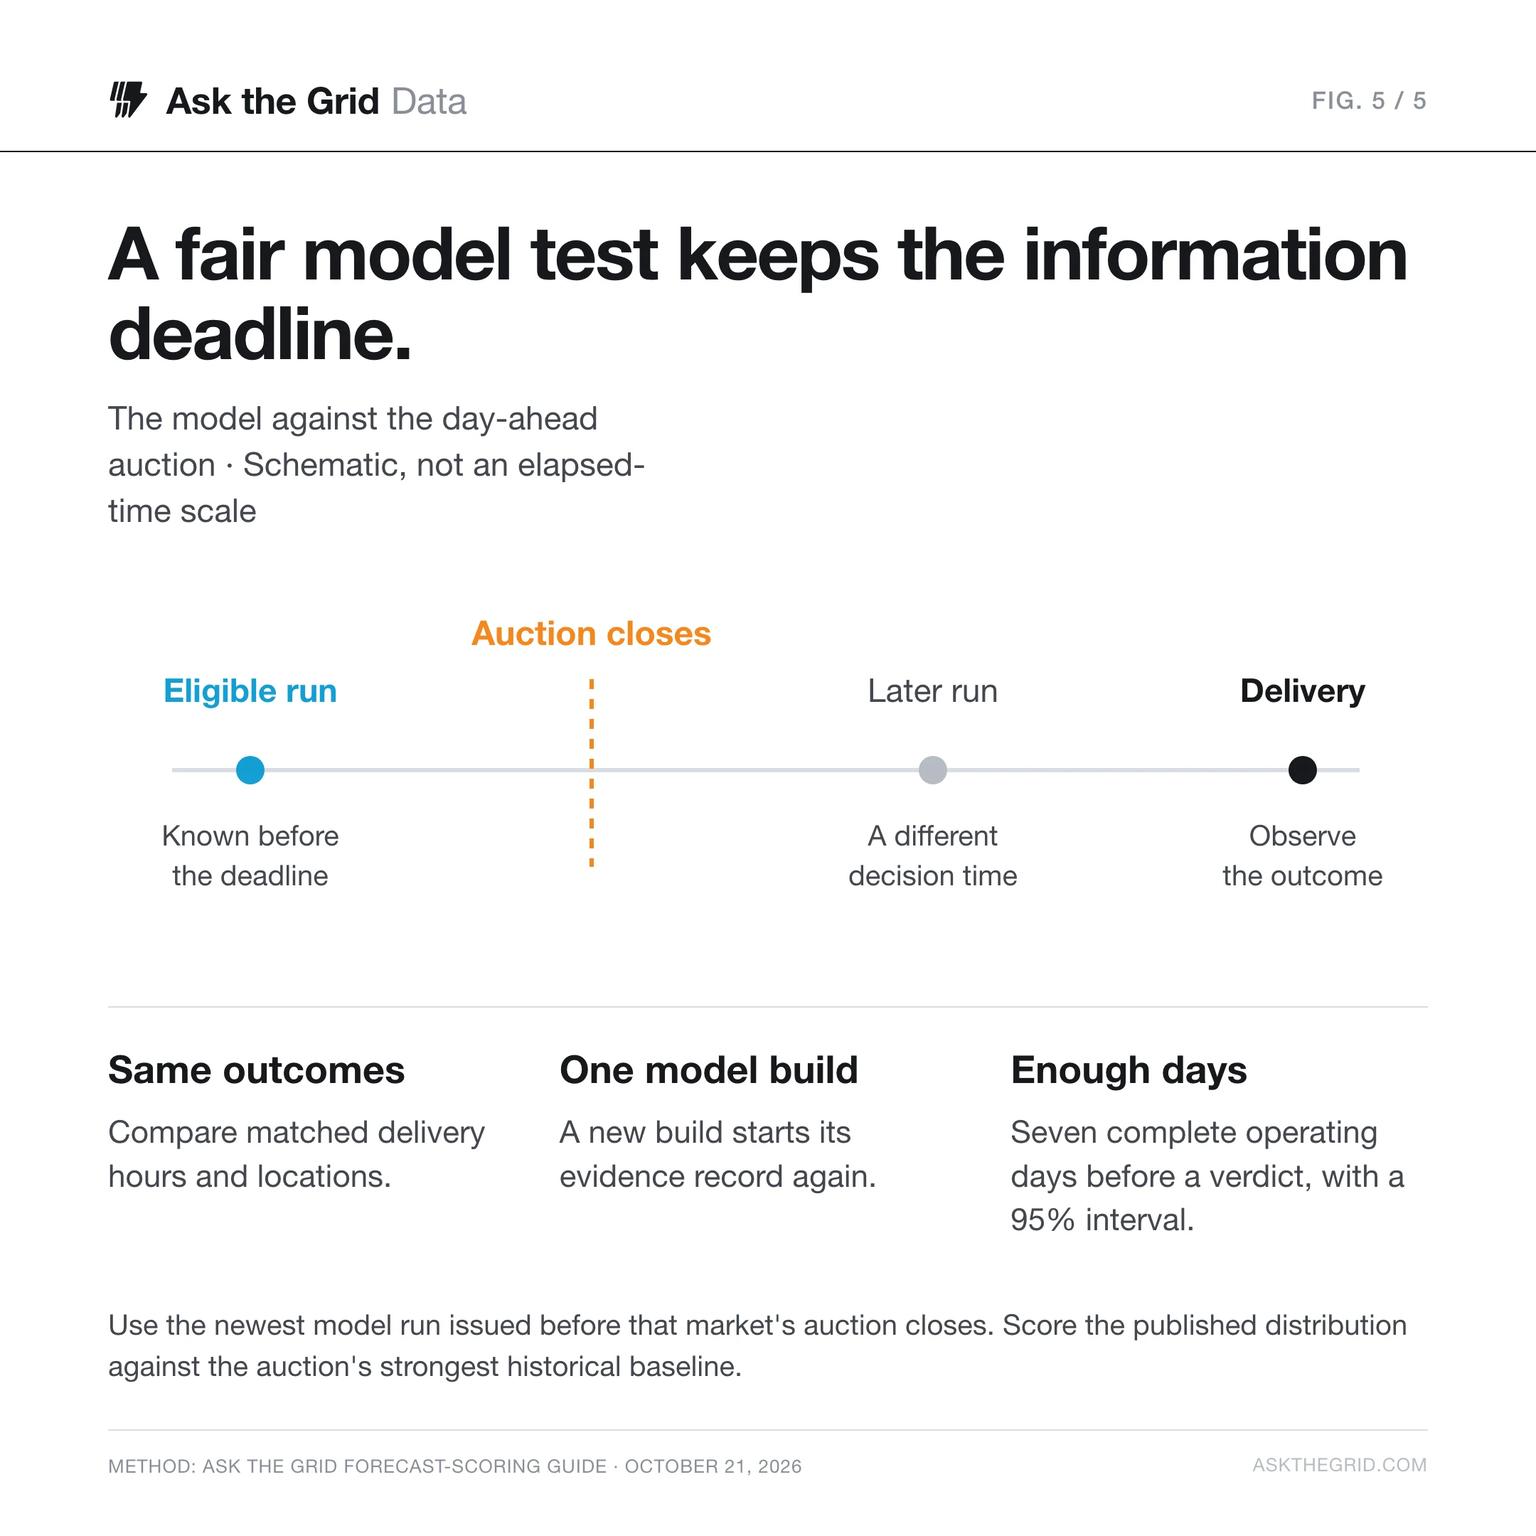
A fair model test keeps the information deadline#
When our accuracy page compares a price model with the day-ahead auction, it uses the newest model run issued before that auction closed, because a later run had later information. It also waits for seven complete operating days on one model build before naming a leader. The forecast-scoring field guide explains the scoring.
What the data covers#
We required at least 95% of expected complete location-hours for every market basket. MISO yielded 460 of 672 expected pairs (68.5%) and is excluded. For the five included markets we kept only hours in which every selected location had a complete pair, which left 161 of 168 UTC hours. Missing real-time hours were not filled or carried forward. This article is frozen at October 21, 2026, 10:50 p.m. Eastern; the live page uses a rolling window and will show different values.
Baskets are ERCOT's four hubs; CAISO's NP15, SP15 and ZP26; NYISO's New York City, Capital, West and Hudson Valley zones; PJM's Western, Eastern, Northern Illinois and Dominion hubs; and SPP's North and South hubs. Every location-hour is weighted equally, so these are simple hourly means, not load-weighted prices or settlement estimates. Real-time prices are hourly means of twelve five-minute slots, except PJM's verified hourly series. Tail shares use the largest 10% of each market's location-hours, rounded up.
Market data comes from ERCOT, CAISO OASIS, NYISO, PJM Data Miner and the SPP Portal. Download the frozen 2,737 price pairs and 168 ERCOT load-vintage pairs to reproduce the calculations.
Share the findings#