ERCOT's Highest August Load Wasn't Its Tightest Day
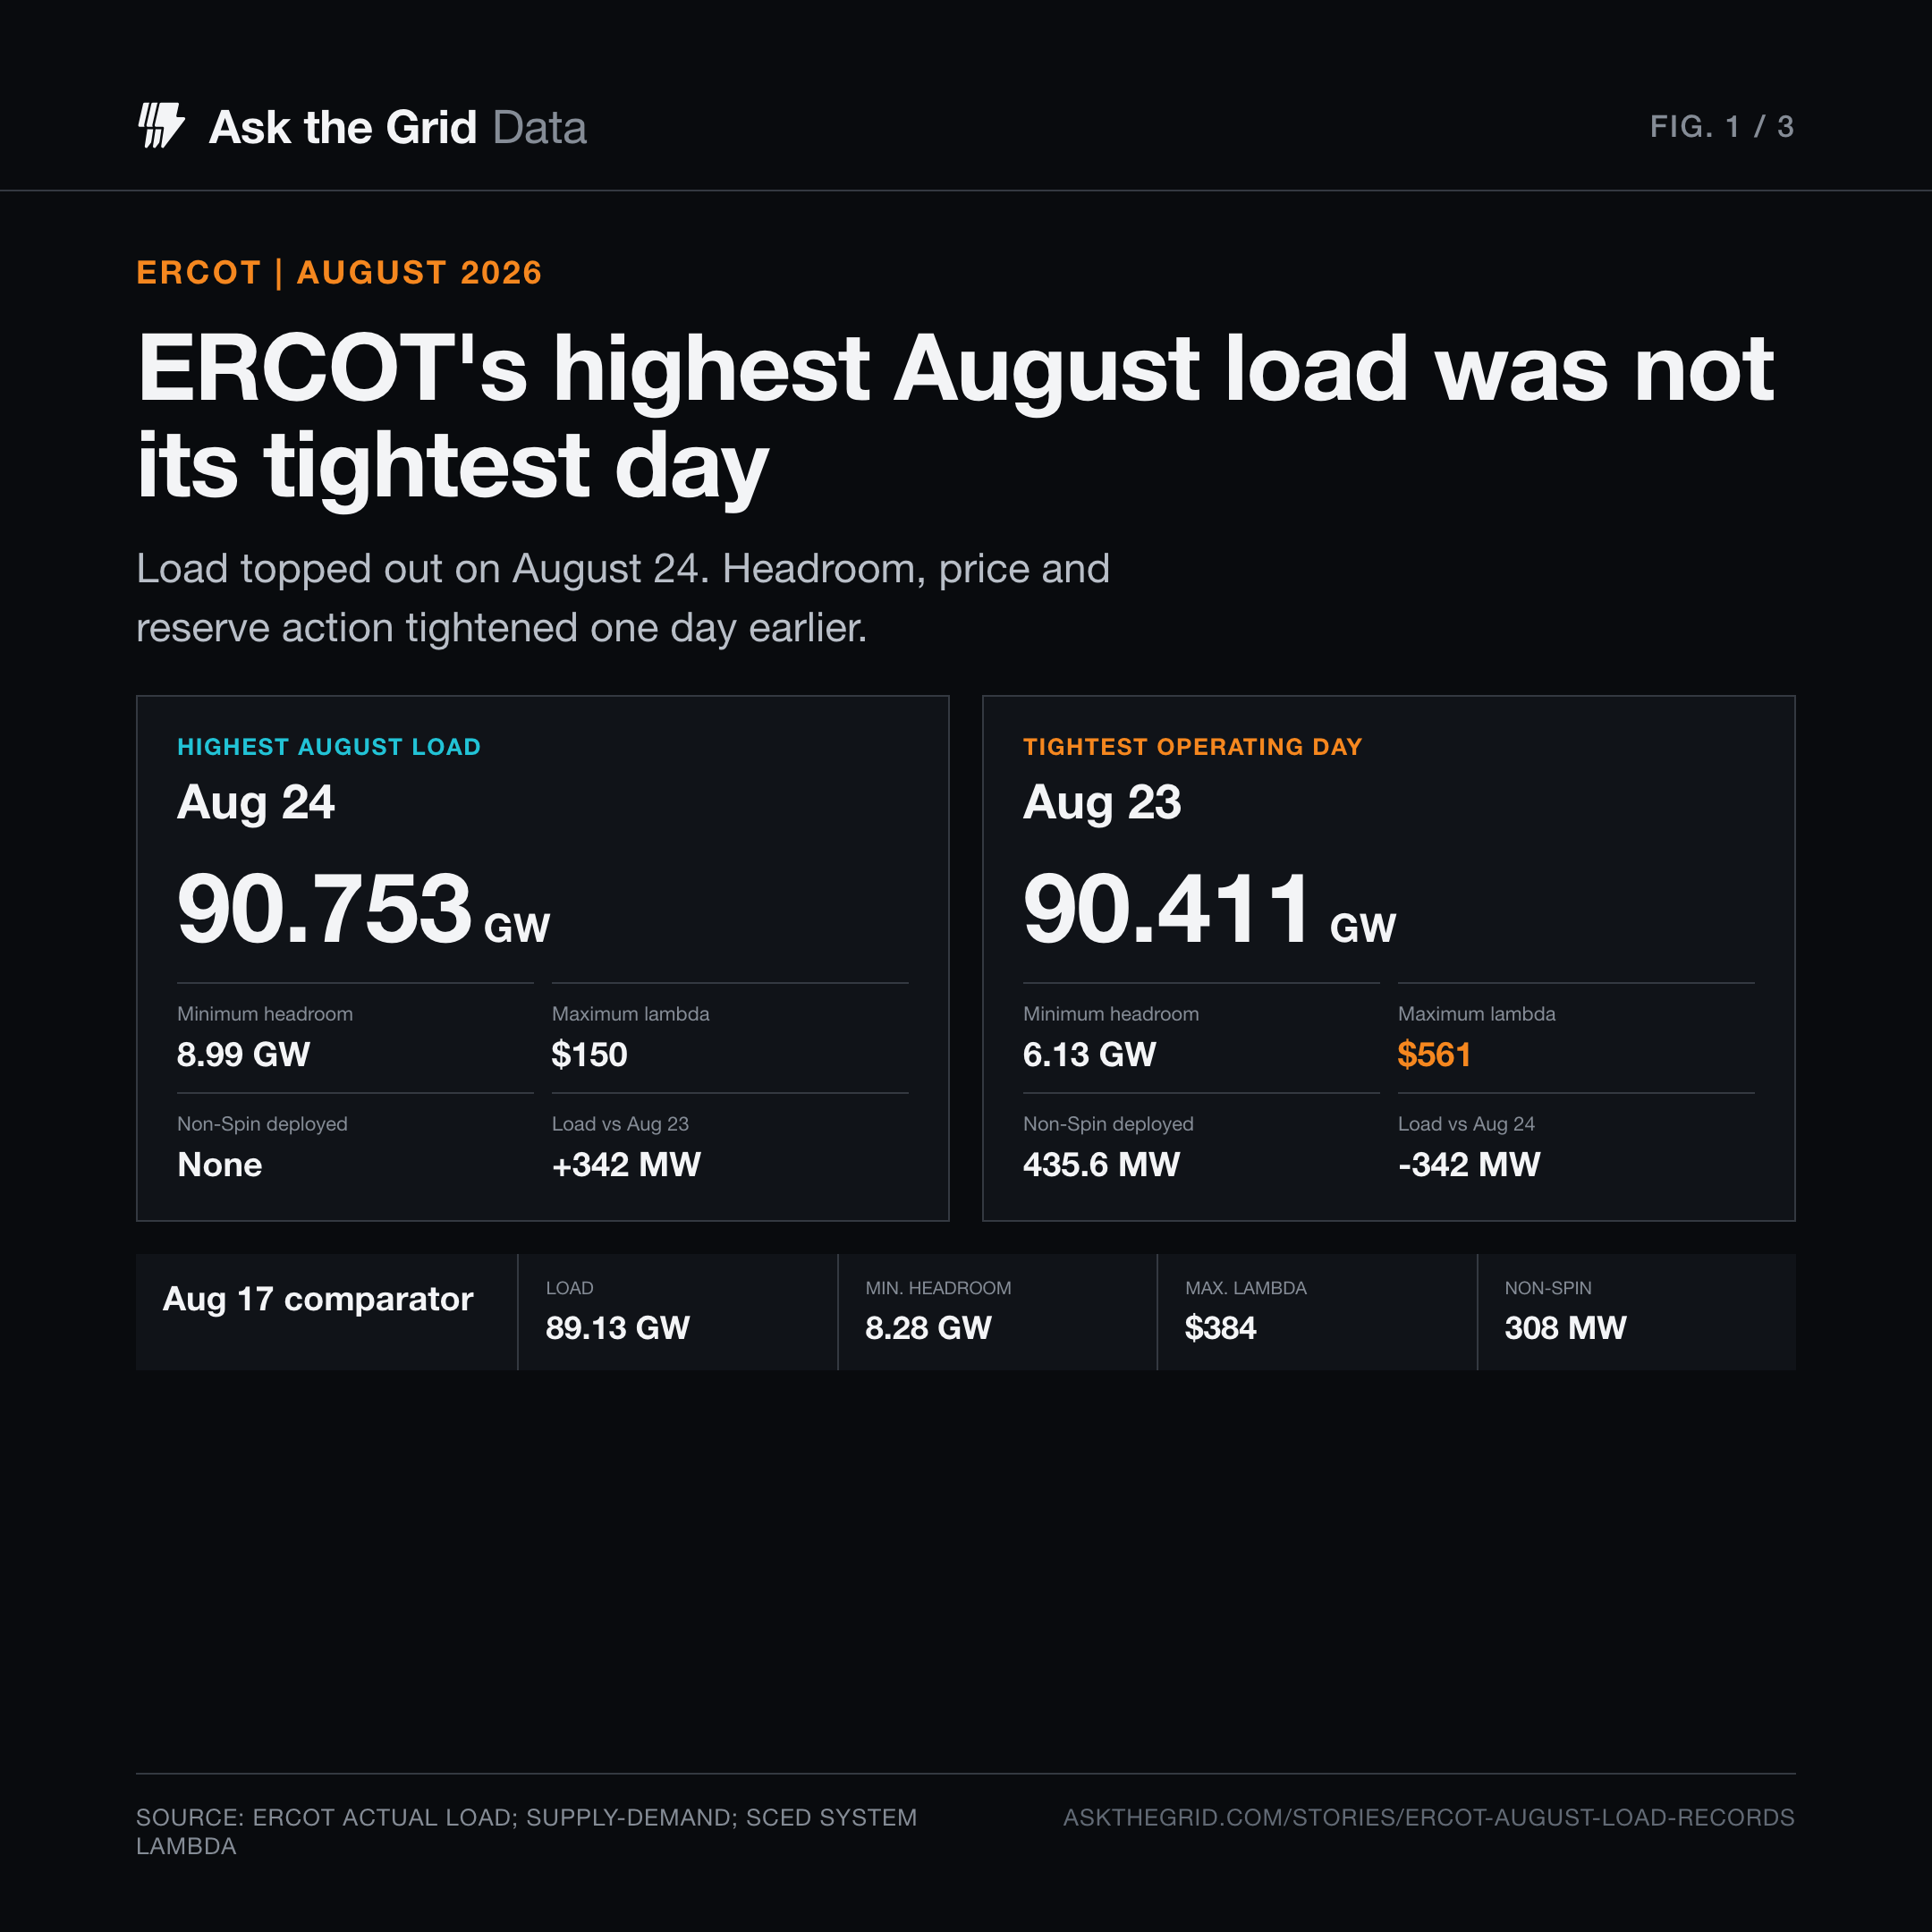
August 24 set the load high. August 23 had less committed-capacity headroom, a higher system lambda and a 435.6 MW Non-Spin deployment.
ERCOT's actual-load report measured a preliminary August high of 90,753 MW on August 24, only 337 MW below the 91,089 MW all-time hourly high set on July 22. The higher load did not produce the month's tightest operating conditions.
One day earlier, load reached 90,411 MW while minimum committed-capacity headroom fell to 6.13 GW, ERCOT deployed 435.6 MW of Non-Spin, and system lambda reached $560.80/MWh. On August 24, headroom recovered to 8.99 GW and maximum lambda fell to $149.96/MWh. Load set the headline; headroom, reserve deployment and marginal price define the tighter day in this analysis.
A load record is not a grid-stress index#
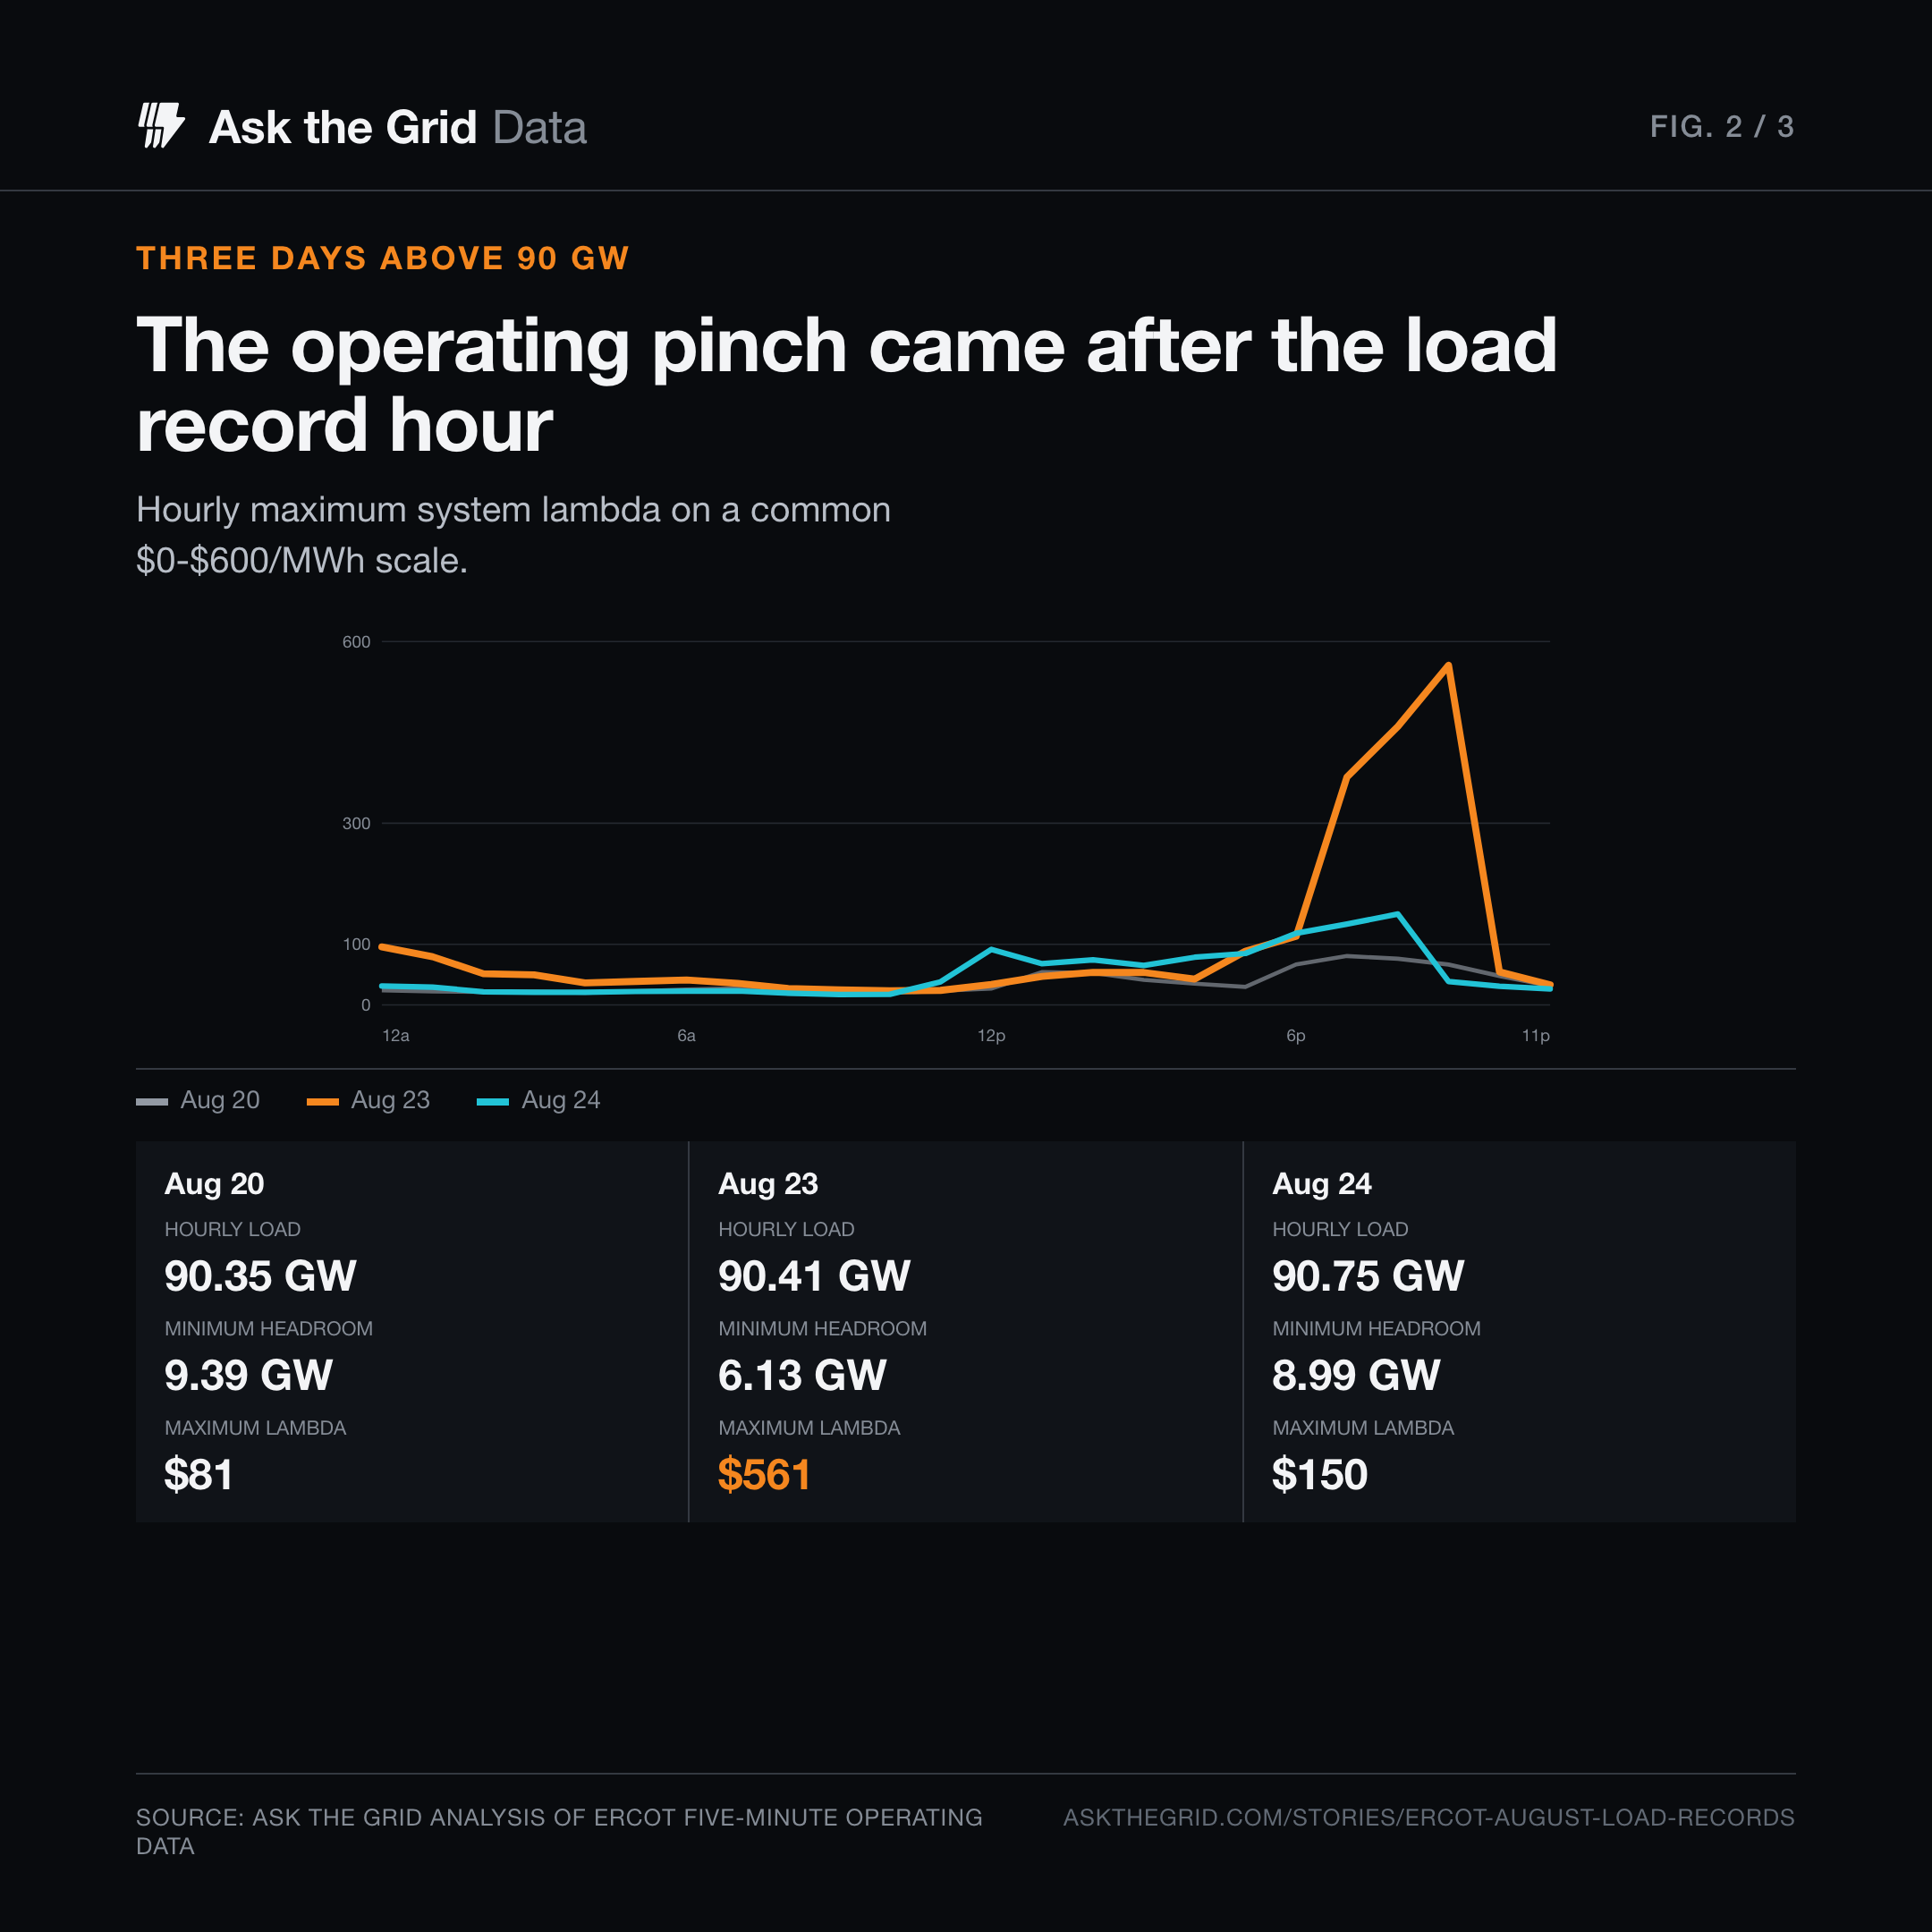
The three days above 90 GW separate the variables. August 20 reached 90.35 GW with 9.39 GW of minimum committed-capacity headroom and a maximum system lambda of $80.79/MWh. August 23 added only 58.5 MW of hourly load, but minimum headroom fell to 6.13 GW and lambda rose to $560.80/MWh. August 24 added another 341.8 MW of load while headroom recovered to 8.99 GW and the price peak fell by almost three-quarters.
The operating action followed the same ranking. At 6:54 p.m. on August 23, ERCOT deployed 435.6 MW of Non-Spin for an anticipated four-hour period. It gradually reduced the instruction and recalled all Non-Spin at 10:05 p.m. ERCOT did not declare an Energy Emergency Alert or ask the public to conserve. The system remained in normal emergency-status terms while operators converted held reserve capacity into energy.
August 17 is a useful comparator because it also required reserve action. Load peaked lower at 89.13 GW, while minimum committed headroom reached 8.28 GW, system lambda reached $384.30/MWh and ERCOT deployed 308 MW of Non-Spin. Across the month, August 23 still ranks as the clearest combined test of a thin committed-capacity cushion, high marginal energy price and reserve conversion.
The operational pinch came after the load record hour#
Each daily load record occurred in the 6 p.m. integrated hour, while solar was still contributing roughly 27 GW. On August 23, the minimum hourly headroom arrived around 7 p.m. and the maximum lambda arrived at 9 p.m. By then, the solar contribution had nearly disappeared and the grid had to cover the evening with a different combination of thermal generation, wind, storage and deployed reserves.
ERCOT's August resource-adequacy outlook had identified the same timing risk before the month began. Its highest modeled probability of an Energy Emergency Alert was 5.96% in the hour ending 10 p.m., still below ERCOT's 10% threshold for elevated risk. The forecast was not predicting August 23. It was identifying the structural exposure: the highest-risk hour can arrive several hours after the highest-load hour because the available resource mix changes as the sun sets.
Storage played two different system roles in one day#
At the 6 p.m. hourly load records, the battery fleet was still close to neutral: 525 MW of net charging on August 20, 308 MW of net discharge on August 23 and 180 MW of net charging on August 24. Those readings are easy to misread if the load record is treated as the day's endpoint. Storage's largest contribution came later.
On August 23, net storage output swung 24.04 GW, from 10.81 GW of net charging at 10:10 a.m. to 13.23 GW of net discharge at 7:50 p.m. That is the fleet's daily operating range, not energy capacity and not two gross totals added together. August 24 produced a 20.76 GW swing. Batteries first absorbed solar-heavy supply and then supported the post-sunset ramp.
August 23 had broad high prices; August 24 was more spatially divided#
System lambda summarizes the marginal energy component of the real-time market. It does not show what every location paid. Ask the Grid therefore froze all 1,118 settlement-point LMPs at each day's maximum-lambda interval and compared their distributions on one common scale.
At 9 p.m. on August 23, the middle 90% of nodal prices ran from $441.60 to $593.40/MWh, and 98.3% of nodes were above $100. The median node, at $566.10, sat close to the $560.80 system lambda. These were broad high-price conditions: prices were elevated almost everywhere, even though individual transmission constraints still created exceptions.
At 8 p.m. on August 24, the system price was much lower, but the map was less uniform. The middle 90% widened from $37.90 to $234.40/MWh, and 50.3% of nodes differed from system lambda by more than $25/MWh. A statewide price headline would understate the importance of location on that day. The system was less expensive at the margin and more spatially separated at the same time.
The map makes the distinction operational. August 23 is dominated by a high common price field. August 24 contains a wider mosaic of local premiums and discounts around a lower system reference. For storage, generation and flexible-load operators, those are different bidding and siting problems even though both days carried more than 90 GW of hourly load.
What to watch#
For operators and flexible loads, the practical signal is a stack: committed-capacity headroom, the post-sunset ramp, reserve deployments and the geographic shape of nodal prices. A load-only trigger would have ranked August 24 first. A reserve-and-price trigger would have identified August 23.
For batteries, the decisive interval came after the 6 p.m. load reading. State of charge and evening optionality mattered more than matching the load headline. For siting decisions, August 24 is the other warning: half of settlement points differed from system lambda by more than $25/MWh even with a healthier statewide capacity cushion.
Ask the Grid's analysis uses deduplicated ERCOT reports through August 24. Hourly load is the integrated system total; August 23-24 readings remain preliminary pending ERCOT's settlement process. Committed-capacity headroom is realized capacity minus realized demand, minimized within each local clock hour. Fuel mix, storage output and system lambda use five-minute operational reports. Nodal distributions use unique settlement points at the exact maximum-lambda SCED interval on each day. All figures are frozen at publication.
Explore the underlying hourly load, supply and demand, five-minute fuel mix, system lambda and settlement-point LMP datasets. Open ERCOT on the map and scrub August 23 or August 24 yourself.