Texas Approved 765-kV Lines Into the Permian. Load Growth Just Slowed.
Far West electricity consumption rose just 1 percent through August, and a key regional price premium nearly disappeared. The question is what changed, and whether it changes the case for the buildout.

On August 28, Texas regulators approved two Oncor 765-kilovolt transmission projects: Dinosaur–Longshore and Longshore–Drill Hole. Oncor lists planned completion in 2028 and 2029. They are the first extra-high-voltage lines in ERCOT and a major addition to the network serving West Texas.
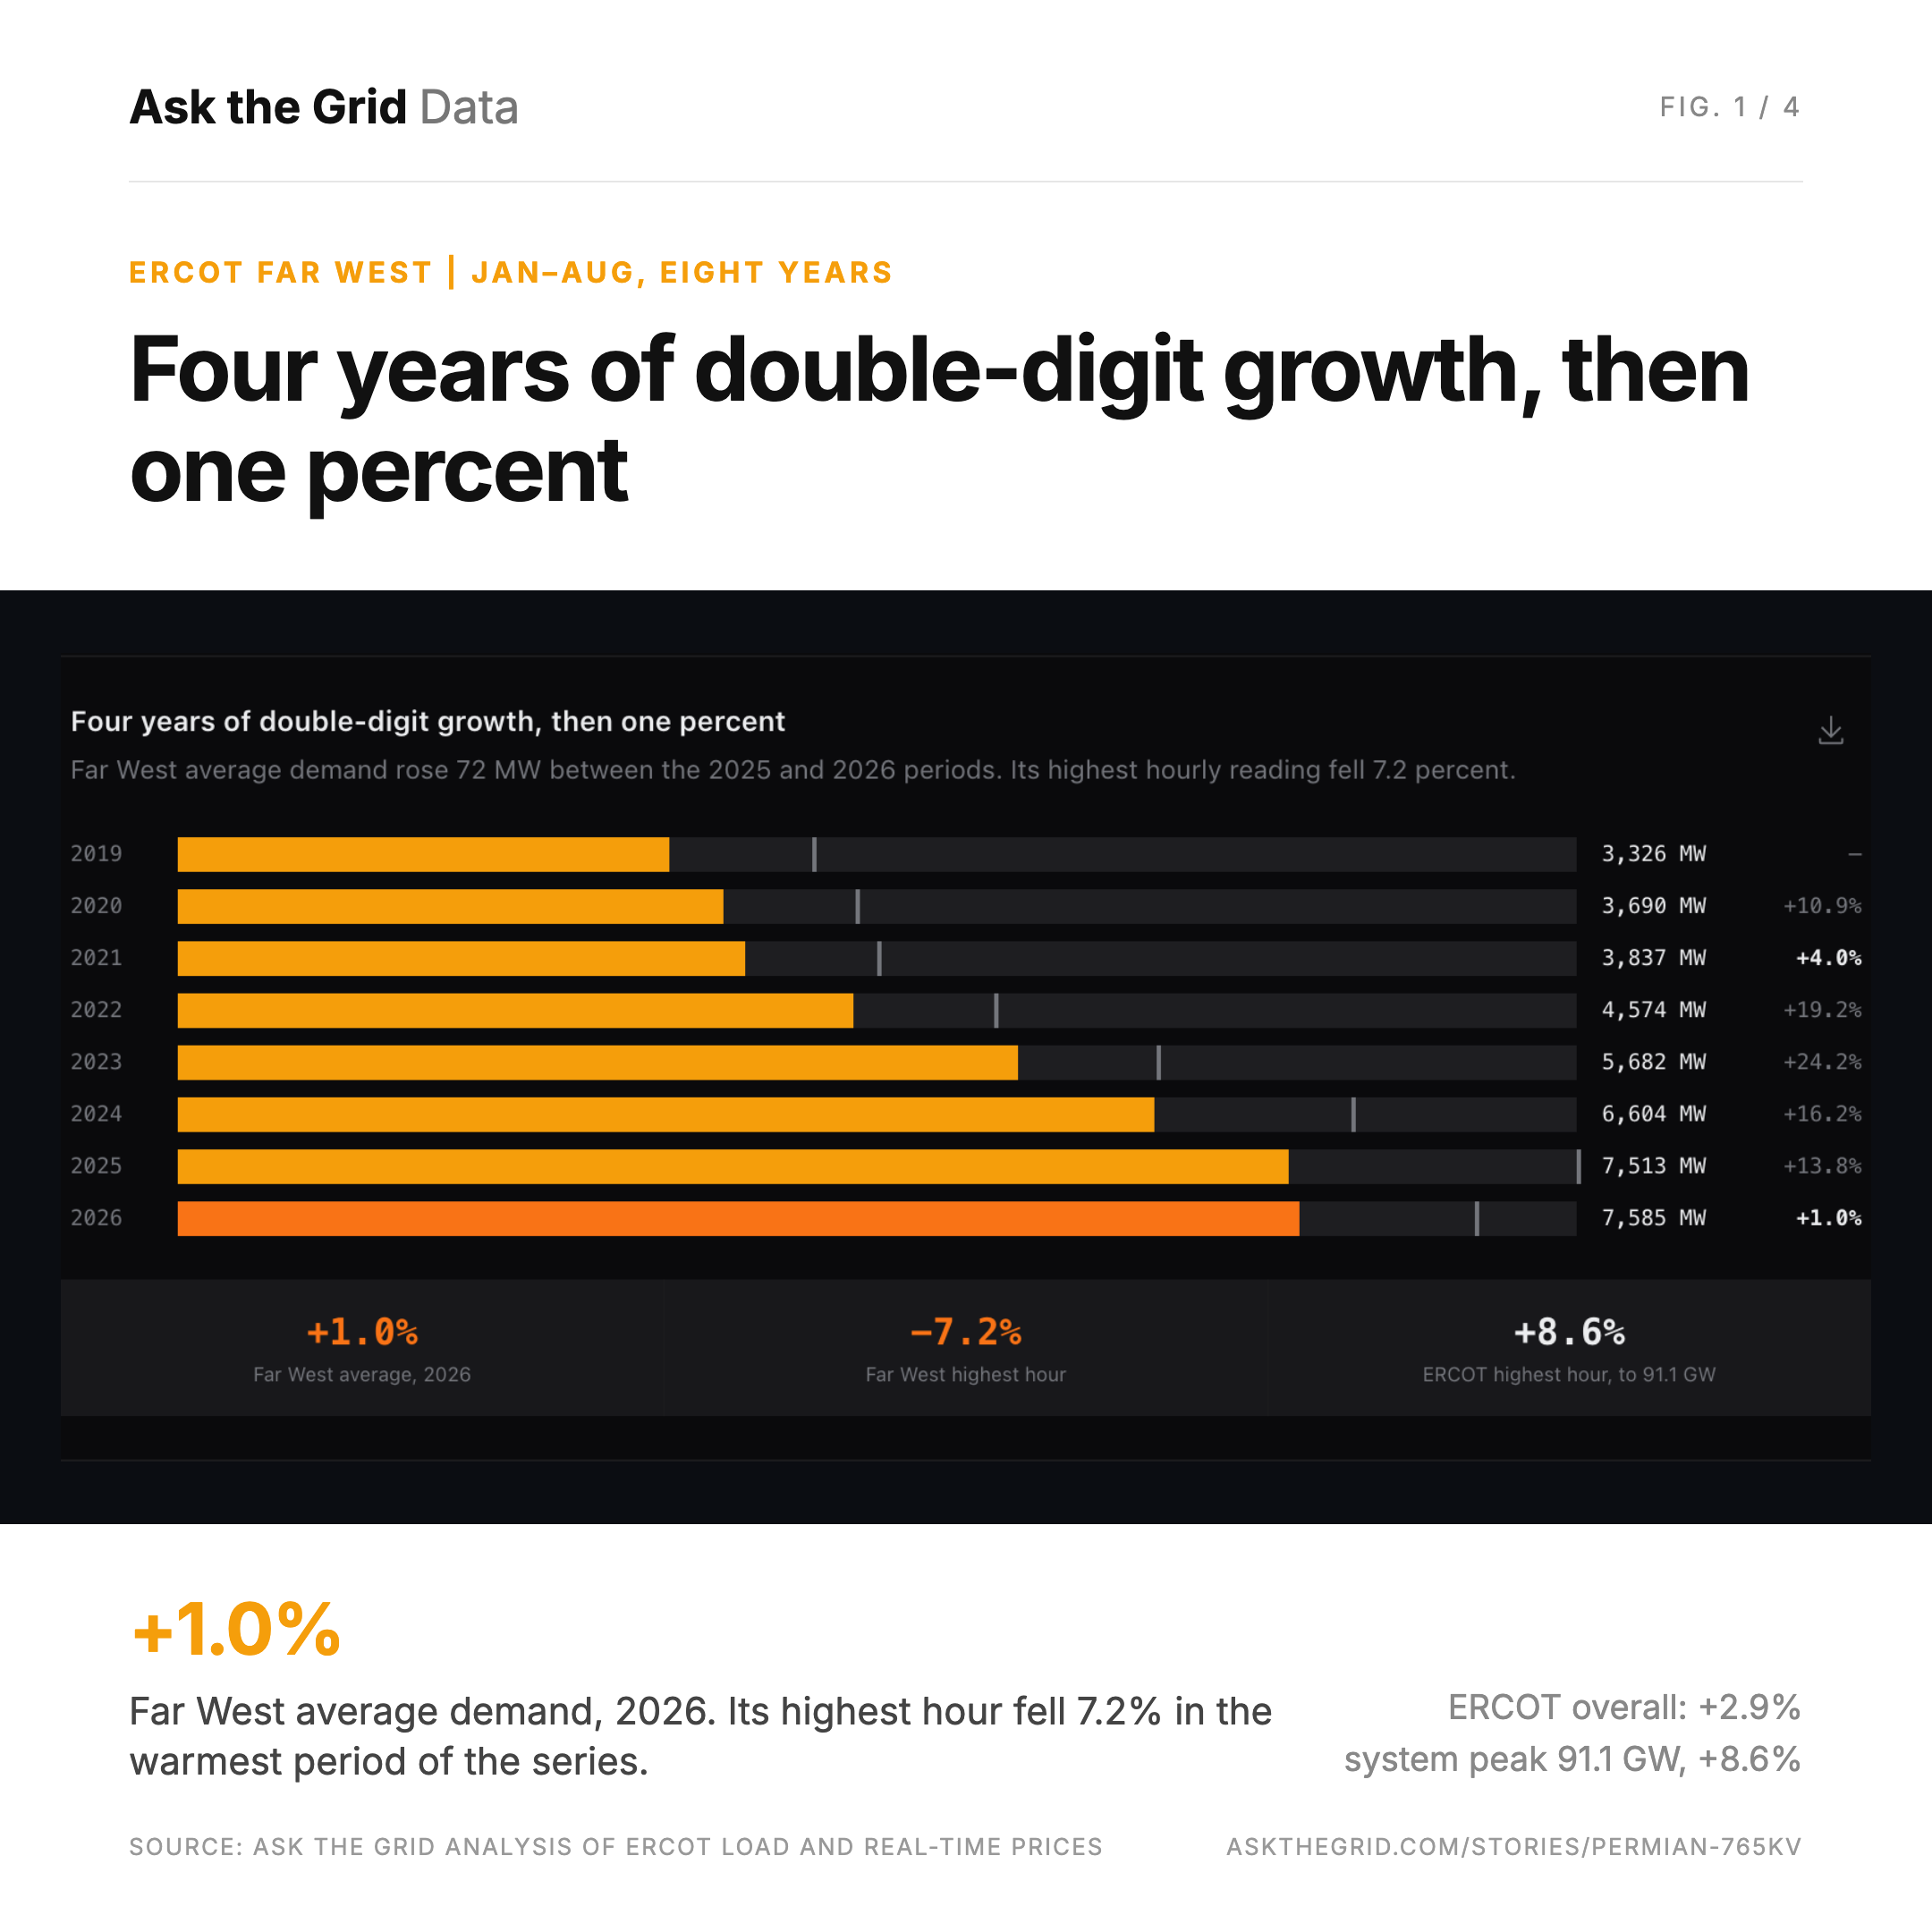
The latest operating data adds a complication. After four consecutive years of double-digit growth, average electricity demand in ERCOT's Far West weather zone barely increased through August 2026. Its peak hourly demand fell. At the same time, the West load zone's wholesale price premium over the North hub shrank from almost $10 per megawatt-hour to 32 cents.
Those are meaningful changes. They are not, by themselves, evidence that the new lines are unnecessary. The distinction is between electricity being consumed today, demand that customers may be waiting to connect, and the grid's ability to supply that demand during difficult hours. The first is measurable in these data. The other two require more than a load-growth chart.
The break in the growth curve#
Ask the Grid analysed ERCOT's observed hourly load (atg.ercot_load), comparing January through August in each year rather than a partial year against a full one. The slowdown is pronounced.
Average demand increased by just 72 MW between the two most recent periods. The highest hourly reading fell 7.2 percent. This was not a weak month offsetting an otherwise strong summer: average Far West demand was slightly below its year-earlier level in June, July and August individually.
Across ERCOT, the direction was different. Average system demand rose 2.9 percent, and the highest hourly demand in the same window reached 91.1 GW, up 8.6 percent from 2025. Far West's slowdown occurred while the wider system continued growing.
This is a pause in growth, not a return to the old demand base. Far West average demand remains more than twice its January–August 2019 level. But the rapid annual increases that brought it here did not continue into 2026.
Nor was it a cooler period. At the ERA5 grid point nearest Midland, January through August 2026 averaged 21.42 °C, the warmest of the eight years shown and 1.19 °C above 2025 (open_meteo.era5_grid). The analysis is not weather-normalized, and temperature at one grid point does not describe the whole zone. It does rule out the simplest alternative explanation: the peak did not fall because the weather was milder.
A key price premium nearly disappeared#
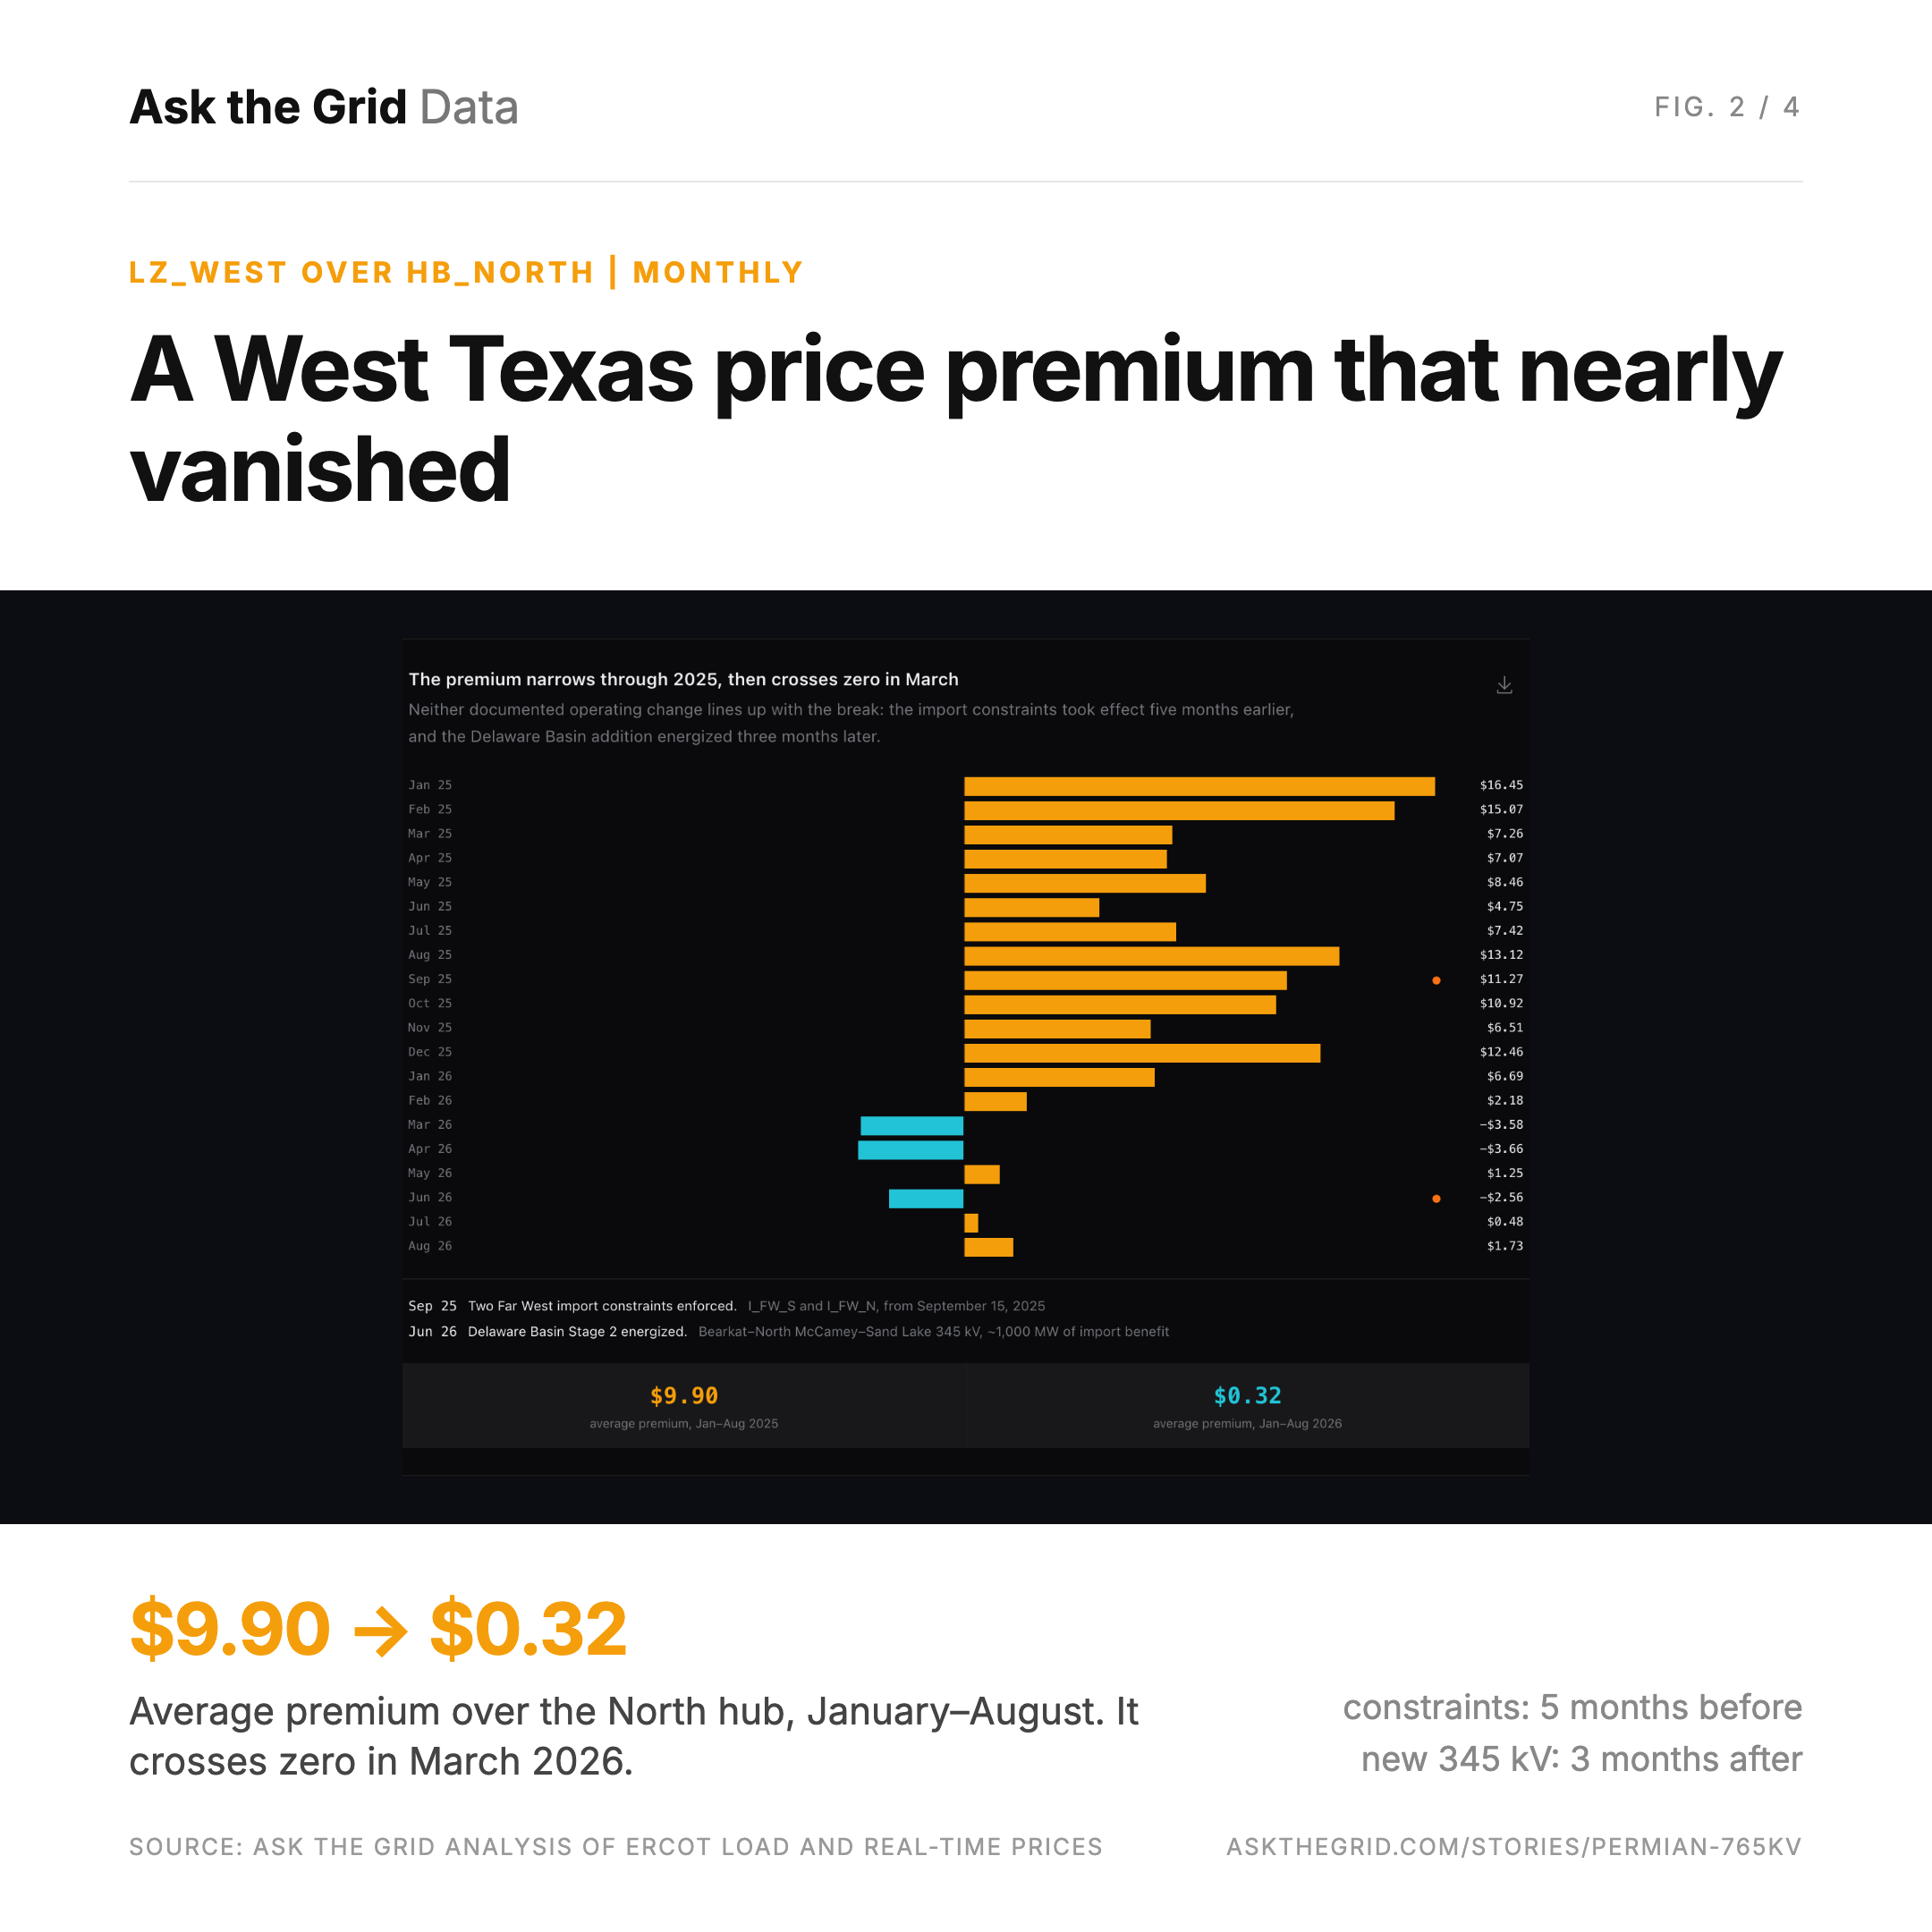
The price data shows another change, although it does not establish the cause of the load slowdown. During January–August 2025 the West load zone, LZ_WEST, averaged $9.90/MWh above the North trading hub. During the same months of 2026 that premium was $0.32/MWh, a decline of about 97 percent (atg.ercot_prices_rt).
This is a comparison of prices at matching dispatch timestamps, averaged across the period. It is not a customer's electricity bill, a load-weighted settlement price, or a direct measurement of power flowing into West Texas.
The monthly shape is worth reading carefully, because the two documented operating changes in this corridor sit on either side of the break rather than on it. ERCOT began enforcing two new Far West import constraints, I_FW_S and I_FW_N, on September 15, 2025 — five months before the premium crossed zero, and the premium stood at $11.27 that month and $12.46 in December. The Delaware Basin Stage 2 345 kV addition, which ERCOT estimates carries roughly 1,000 MW of import benefit, energized in June 2026, three months after. Neither timing matches. That does not identify what did change; it narrows what did not.
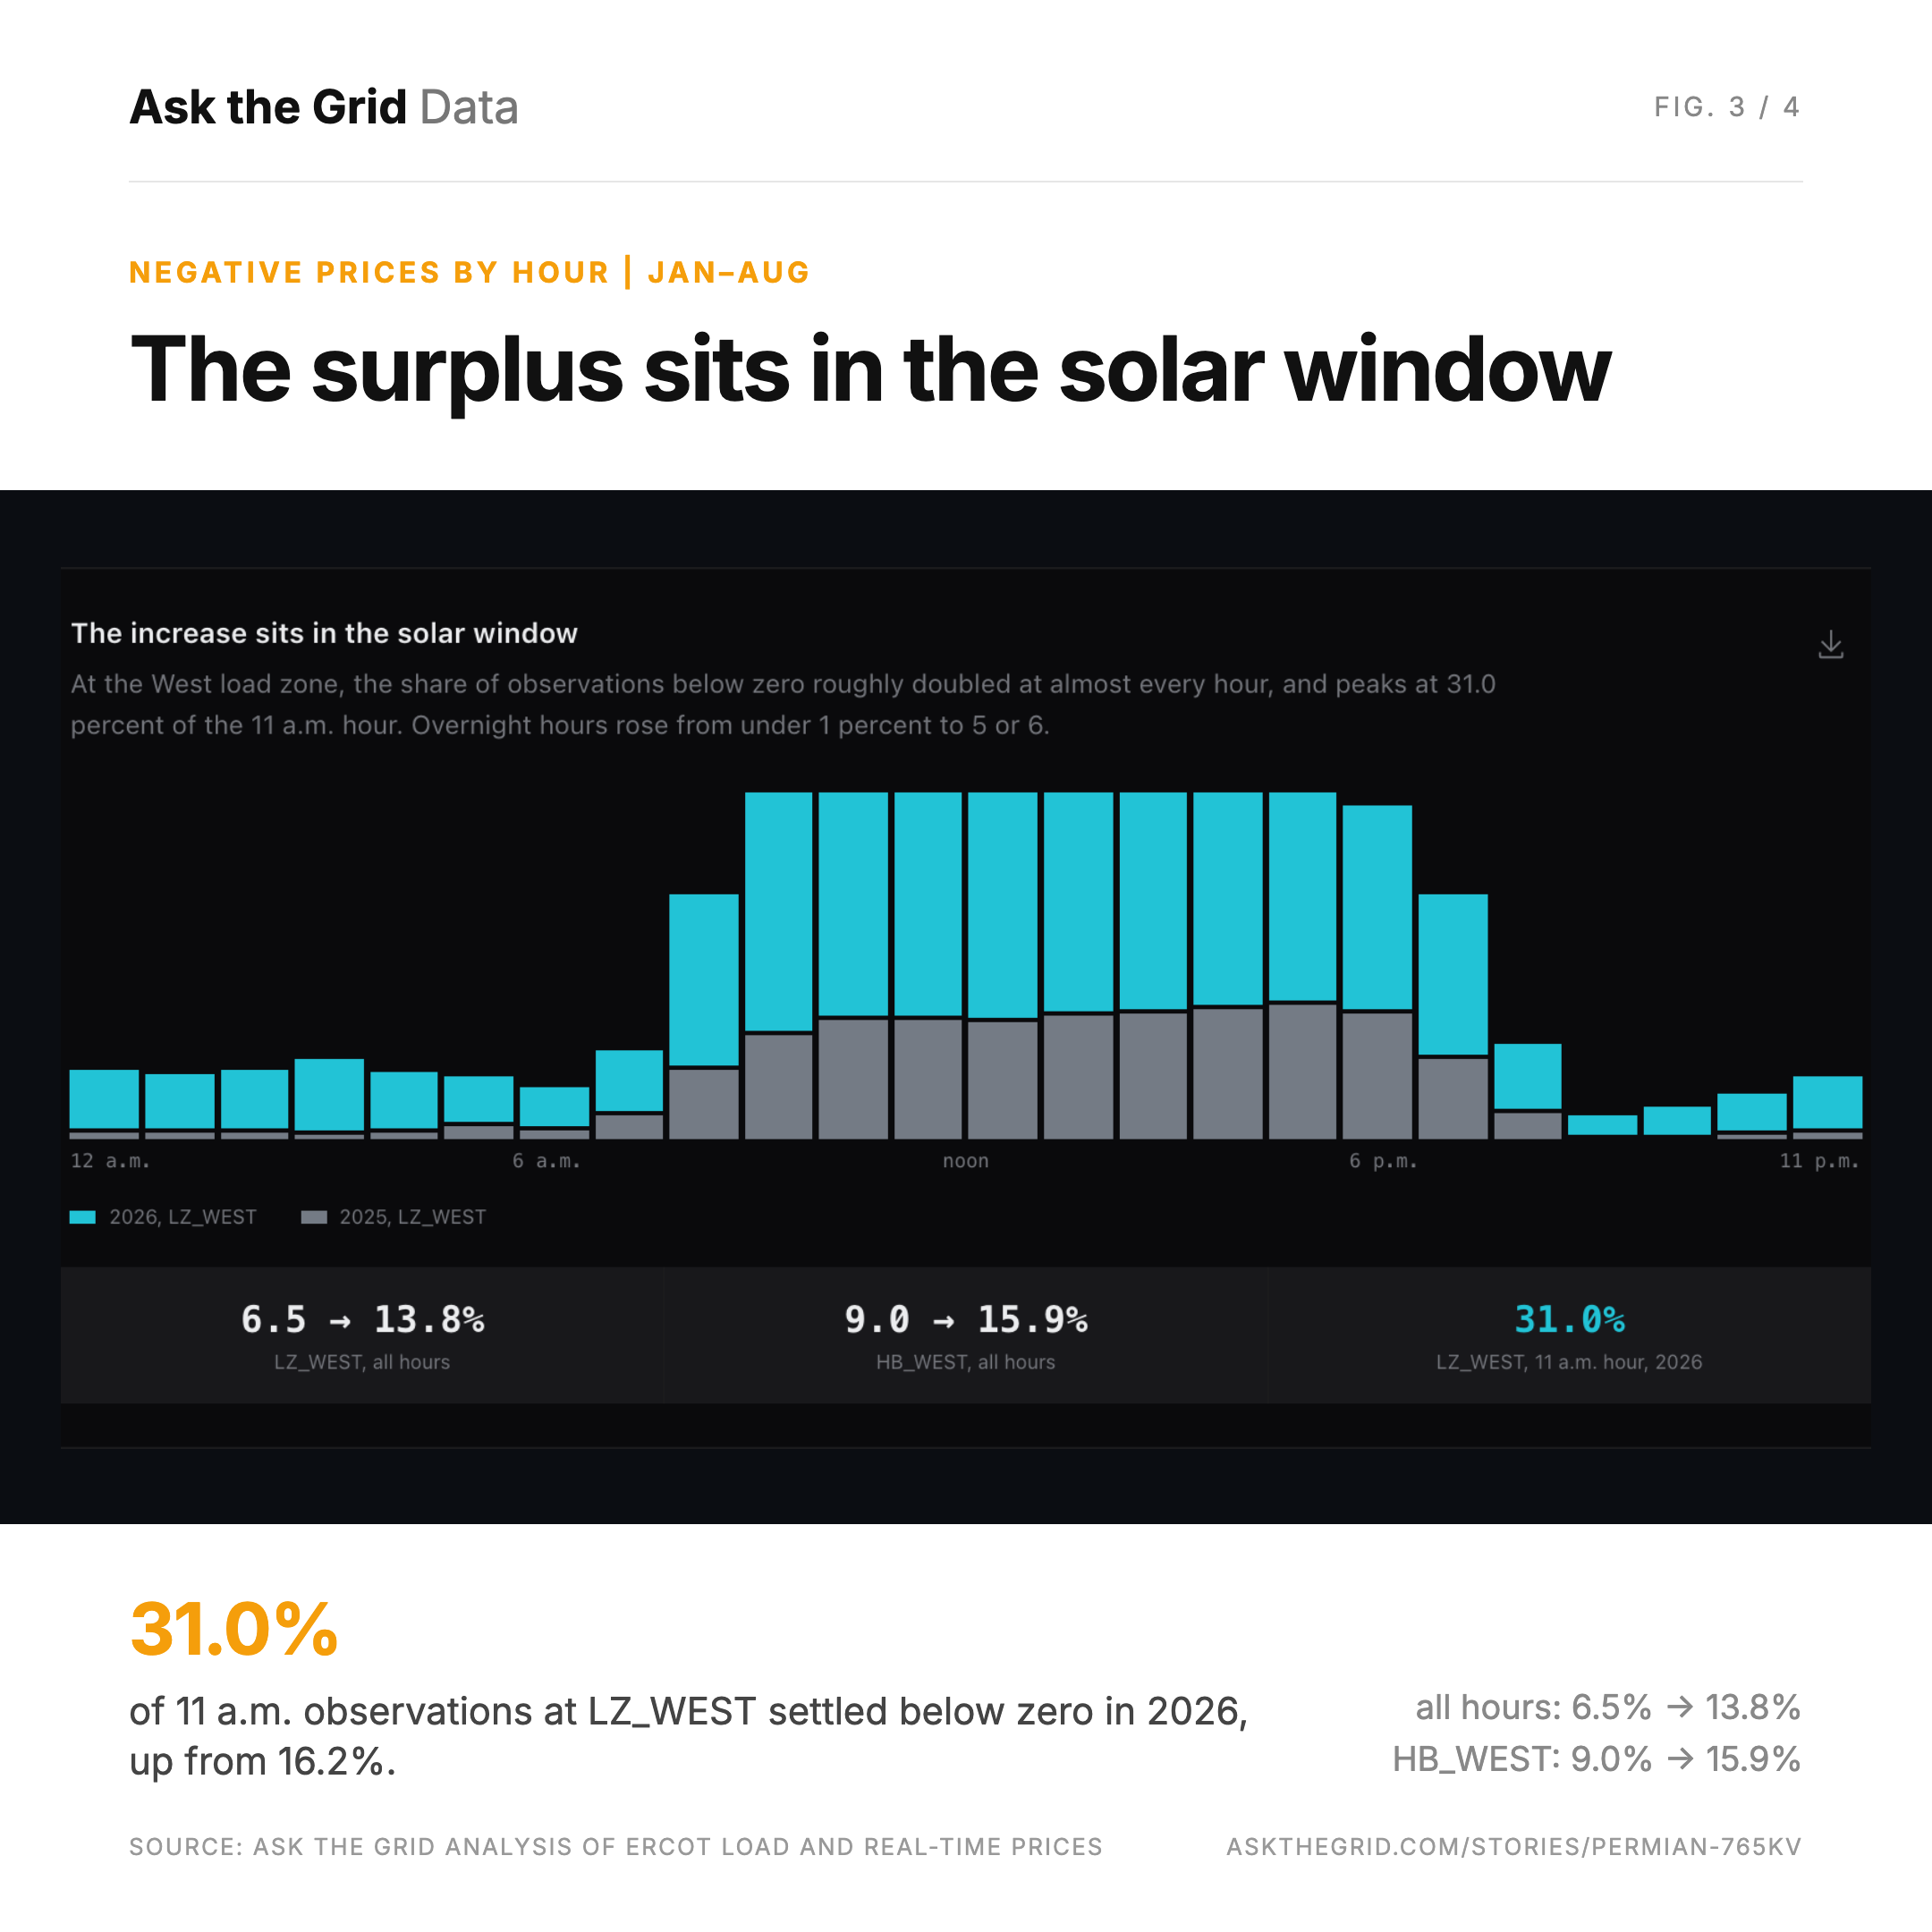
Negative real-time locational prices also became more common. Their share of recorded dispatch observations rose from 6.5 percent to 13.8 percent at LZ_WEST, and from 9.0 percent to 15.9 percent at the West trading hub, HB_WEST. Both comparisons use January through August in each year.
The increase is concentrated in daylight. At the West load zone the share peaks at 31.0 percent of the 11 a.m. hour, and the pattern follows the solar day at both price points. Overnight hours rose too, from under 1 percent to 5 or 6 percent, which is a smaller change on a much smaller base.
The benchmark matters. LZ_WEST still averaged $3.46/MWh above HB_WEST in 2026, down from $9.88 a year earlier. The evidence supports a substantial narrowing of regional price differences, not a claim that every West Texas location now trades at the same price. Nor does a small average premium mean transmission congestion has gone away. Positive and negative price differences can offset each other across thousands of observations. An average describes the period; it does not describe the most difficult hour.
Cheaper power is not the same as reliable power#
ERCOT has already identified a problem that an average-price comparison cannot resolve. On February 23, 2026 it required affected large-load interconnection studies in 37 Far West counties to include a no-solar scenario. The stated reason was an emerging risk of local load shed in the area during low wind conditions at night, especially during transmission and thermal resource outages. The requirement covered studies not yet begun, studies underway, and previously approved studies whose interconnecting entity had not yet satisfied Section 9.5 as of that date.
ERCOT's February board presentation explains the distinction. When wind and solar generation are available, local output plus imports is sufficient to serve the area's current load. Under an adverse scenario — solar at zero, wind at 1,000 MW, storage fully discharged but providing voltage support, thermal resources at full output, and no relevant transmission or thermal-unit outages — ERCOT calculated maximum reliable load-serving capability at approximately 9,500 MW, and said the figure would be lower during the outages that upgrades and maintenance require.
That is a scenario-specific figure for ERCOT's defined study area, not a limit to subtract mechanically from the weather-zone load series above. The broader point is straightforward: a region can have cheap electricity in some hours and insufficient delivery capability in others. Lower average prices do not answer what happens when local generation is unavailable and the remaining transmission paths must carry more of the load.
The same presentation names the projects it expects to matter. After Delaware Basin Stage 2, ERCOT wrote, the next transmission projects having any significant impact are Delaware Basin Phase 5 at the end of 2029, and then the Permian Basin 765 kV. The lines approved in August are, on ERCOT's own account, part of the answer to the nighttime constraint rather than to the daytime surplus the price data describes.
The new study requirement also raises an unresolved question about the slowdown itself. Is consumption growing more slowly because customers need less electricity, because projects are arriving later, or because connecting them has become harder? The notice shows that ERCOT changed its requirements in response to a reliability concern. It does not establish how much demand was delayed, or whether connection limits explain the measured slowdown.
One candidate explanation cuts the other way. A significant share of Far West load is crypto mining, and ERCOT noted it has seen significant response in the past that would reduce that load during high-price conditions. Prices in 2026 were lower, not higher, so price-responsive curtailment would be expected to raise measured demand rather than lower it. That does not resolve the question either; it means the simplest behavioural story does not fit the direction of the data.
The forecast still needs to meet the actuals#
The long-term planning assumptions remain much larger. ERCOT's Permian Basin Reliability Plan study used regional load levels of 23,659 MW in 2030 and 26,400 MW in 2038, and found that the existing and planned transmission system was not sufficient to serve them without upgrades.
Those are planning-study loads for a defined region. They are not directly interchangeable with an eight-month average from the Far West weather zone. Treating 7.6 GW of observed average demand as a like-for-like comparison with 23.7 GW of planning load would overstate what this analysis demonstrates.
There is, however, a nearer-term outlook worth reconciling. ERCOT's February board presentation anticipated substantial Far West load increases at the beginning of 2026 and again in the spring, while noting that their timing depended on customer development. The observed weather-zone series has not shown a comparable acceleration. Before assigning a numerical forecast error, the two series need matching geographic boundaries and demand definitions.
None of this resolves whether the slowdown is temporary. Weaker underlying demand, delayed construction, connection restrictions and changes in how existing customers operate could each produce different versions of the same aggregate result. These data do not identify their respective contributions.
What changes for the buildout#
For a transmission plan, a flat year can mean several different things. If customers have permanently reduced their electricity requirements, the growth assumptions and the timing of investment deserve revision. If demand is arriving later, the issue may be sequencing. If customers cannot connect because the network lacks capacity, low observed consumption may be evidence of the bottleneck the new lines are intended to relieve. Those explanations have different implications. A forecast alone cannot distinguish them, but neither can a single year of actual load.
The same distinction matters for generation and storage investment. A large regional demand forecast does not, by itself, establish when an asset will earn revenue. A low average regional price does not, by itself, establish that reliable supply has little value. Location, operating hours, connection timing and network conditions determine which opportunity is actually being evaluated.
The finding here is narrower, and more useful, than a verdict for or against the buildout. Far West's measured load growth slowed sharply, while a major regional price premium nearly disappeared. ERCOT's documented nighttime reliability concern addresses a different condition, and its own schedule places the 765 kV lines against that condition rather than this one.
The next question is not simply how much West Texas demand will grow. It is which demand arrives, when it runs, and whether the grid can serve it when local generation cannot.
Load figures use ERCOT's observed hourly demand series in atg.ercot_load. Comparisons cover January–August delivery hours in Central Time; 2025 and 2026 each contain 5,831 unique hourly observations. Peaks are hourly averages, not instantaneous system peaks. The weather-zone load series, load-zone prices, trading hubs and transmission-planning areas should not be treated as identical analytical geographies.
Price figures use atg.ercot_prices_rt. Premiums are simple averages of same-timestamp pairs with both prices present. Negative-price percentages describe recorded SCED dispatch observations, not an exact share of elapsed time or customer settlements. Four LZ_WEST and five HB_WEST observations lack total prices in the 2026 window; excluding them does not change the reported one-decimal percentages. Approximately 2.8 percent of 2026 observations at each location lack a congestion component, so this article does not use its slightly negative available-case average to claim that congestion reversed across the complete period. Temperatures come from open_meteo.era5_grid at the grid point nearest Midland.
The analysis reproduces the database series rather than independently certifying every upstream ERCOT record. It is not weather-normalized and does not attribute the slowdown to a particular industry, establish a formal forecast miss, or determine the engineering need for individual transmission projects. Open ERCOT on the live map to inspect West Texas conditions now.