ERCOT’s Record Summer Extended Through the Night
Six consecutive weeks exceeded the former weekly-average demand record. Midnight–6 a.m. demand averaged 63.3 GW, 5.4 GW above the same dates in 2025.
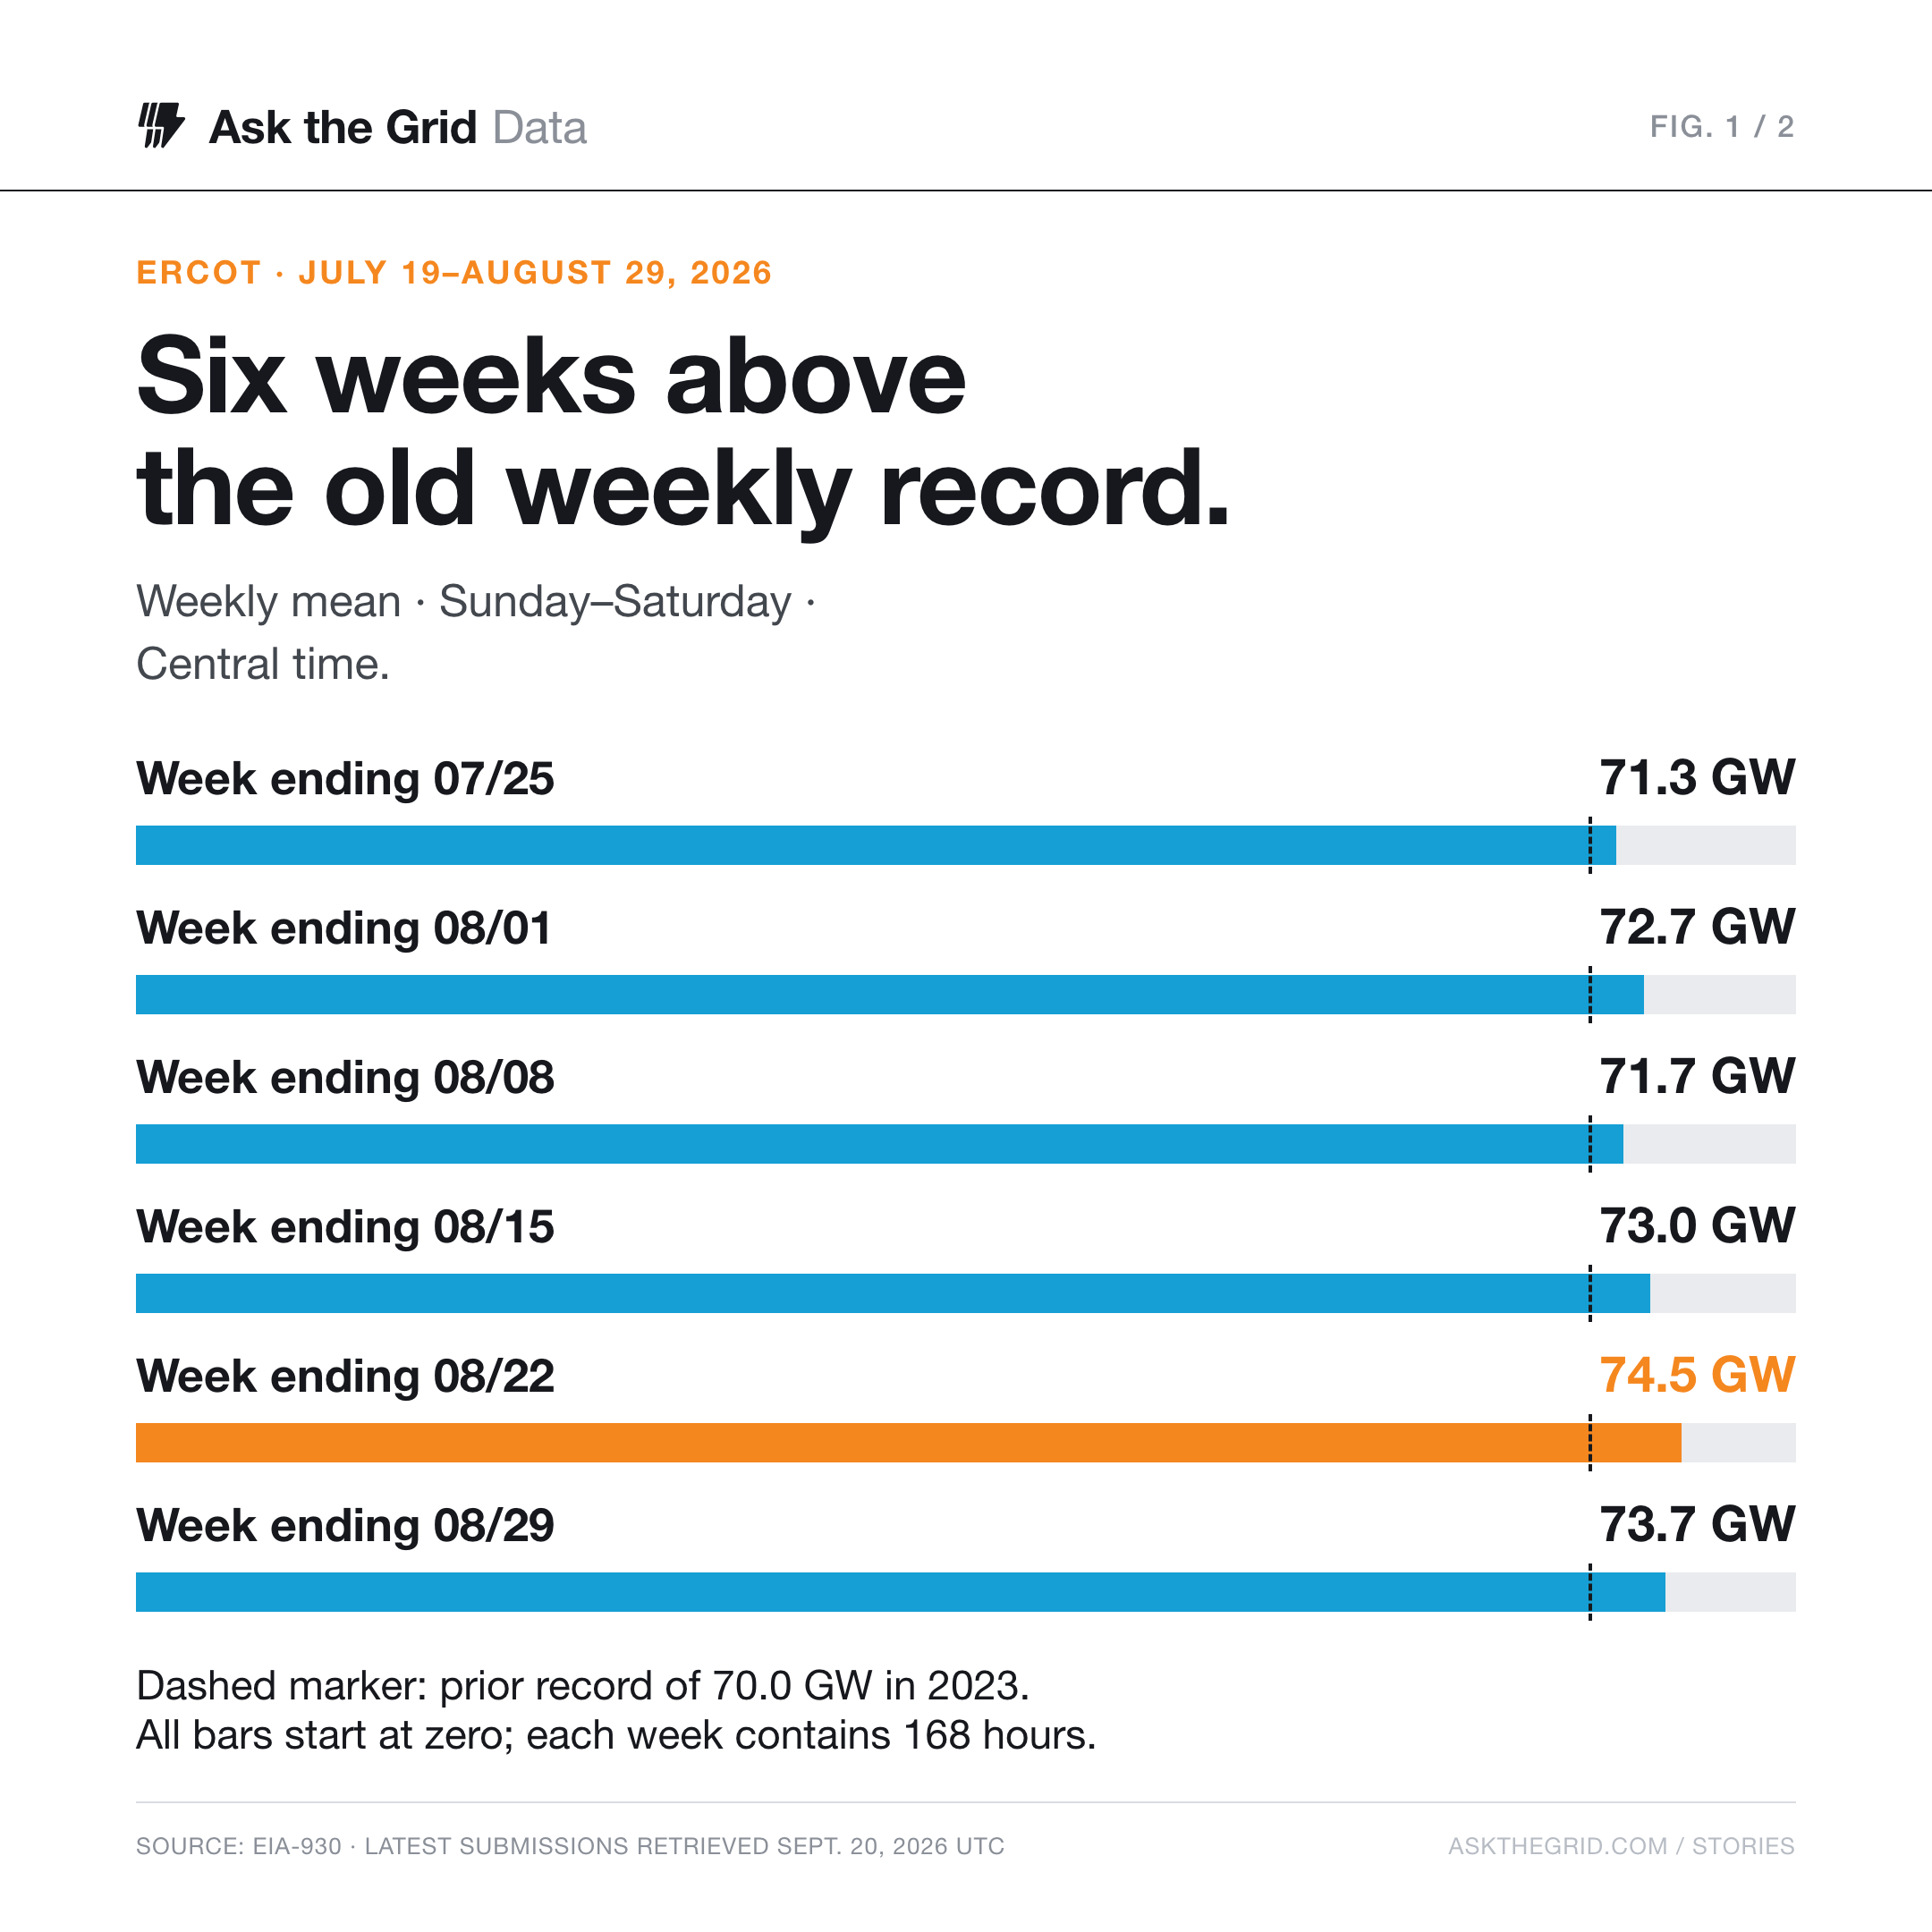
For six straight weeks in summer 2026, ERCOT’s average demand across all 168 hours exceeded its previous weekly record. The week ending August 22 averaged 74.5 GW. Even the lowest of the six weeks averaged 71.3 GW, above the old benchmark of about 70.0 GW.
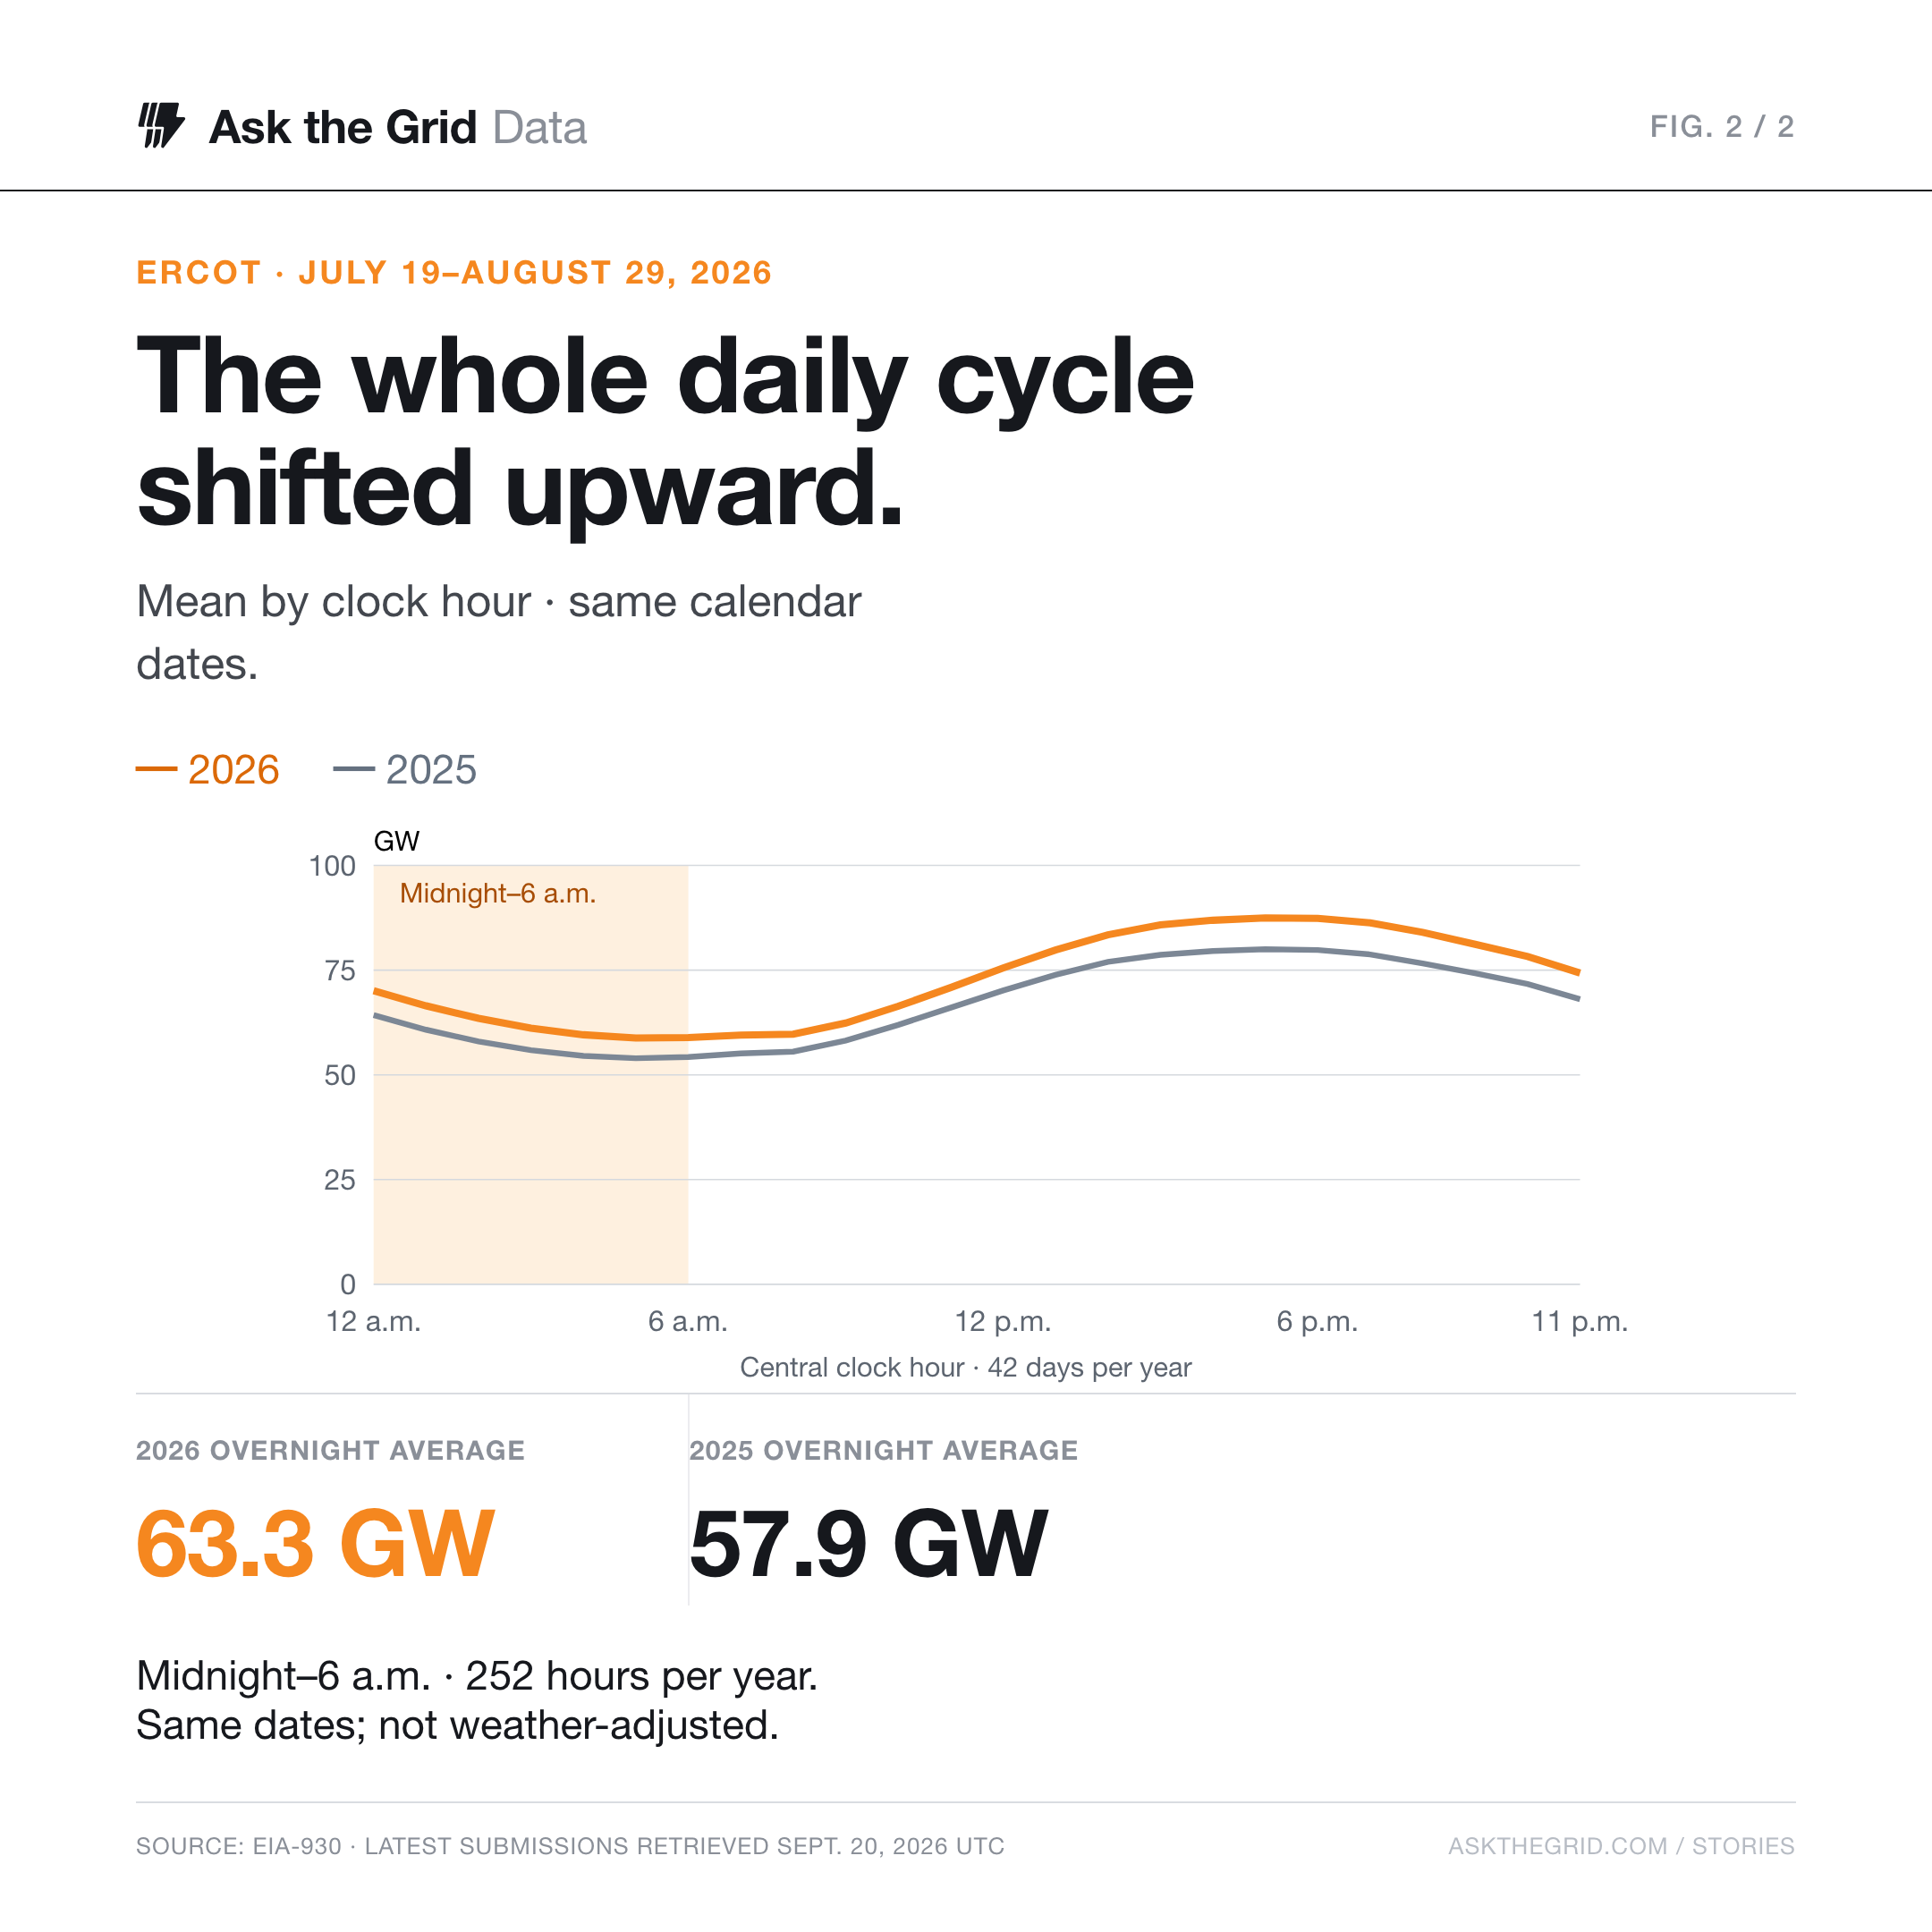
That is a different measure from the afternoon peak. In ATG’s analysis of hourly demand reported to the U.S. Energy Information Administration, the six weeks required 73.4 million MWh of electricity in total. Demand remained elevated after dark: the midnight–6 a.m. average was 63.3 GW, compared with 57.9 GW on the same calendar dates in 2025.
The distinction matters for a system that must supply energy through every hour of a long hot spell. A peak tells planners the highest hourly demand they faced. A sustained average tells them how much electricity had to be delivered across nights, weekends and successive working days.
The record lasted longer than an afternoon#
EIA’s September 3 report identified the run from the week ending July 25 through the week ending August 29. ATG reproduced that comparison using Sunday–Saturday weeks in Central time. All six contain 168 nonmissing hourly observations. Their averages range from 71.3 GW to 74.5 GW; the final week averaged 73.7 GW.
Six full weeks above the former record
ERCOT average demand · Sunday–Saturday weeks · 168 hourly observations per week
Dashed marker: prior weekly-average record. Bars begin at zero.
ERCOT demand reported to EIA, averaged over each complete Sunday–Saturday week in Central time. Dates label the week ending, not an instantaneous reading. Each point contains 168 hourly observations. The reference is the highest complete 168-hour week in the 2019–2025 comparison. Source: EIA-930 demand, latest submission retrieved September 20, 2026 UTC.
The highest complete 168-hour week in ATG’s 2019–2025 comparison was the week ending August 12, 2023, at 69,994 MW. The August 22, 2026 week was 6.4 percent higher. The comparison is between averages over equally long periods, rather than a 2026 weekly average and an earlier instantaneous peak.
At 74,465 MW for 168 hours, that one week represents 12.51 million MWh. Holding the earlier weekly-record average constant over the same 168 hours would yield 11.76 million MWh. The difference is about 751,000 MWh. That calculation measures additional energy relative to a benchmark; it does not estimate a supply shortfall or the cost of serving the load.
The overnight hours also moved higher#
The rise was visible well outside the afternoon maximum. From July 19 through August 29, the six hours beginning at midnight through 5 a.m. averaged 63,256 MW. The same overnight window averaged 57,901 MW in 2025 and 57,927 MW in 2023. The increase from 2025 was 5.4 GW, or 9.2 percent.
The overnight rise is visible across the daily cycle
Average demand at each clock hour · July 19–August 29 · Central time
Each point averages the same clock hour across 42 days. Overnight is midnight–6 a.m. (hours beginning 0–5), with 252 observations per year. Same calendar dates; not weather-adjusted. EIA-930 latest submissions retrieved September 20, 2026 UTC. Source: EIA demand.
Across the full six-week window, demand averaged 72.8 GW, up from 66.9 GW on the same dates in 2025. Hourly demand was at least 70 GW for 554 of the 1,008 hours, or about 55 percent of the period. The old weekly-average benchmark became a level exceeded by individual hours for more than half of this window.
That threshold is a comparison tool, not a grid operating limit. An hour above 70 GW is not automatically an emergency, and an hour below it is not automatically comfortable. Available generation, imports, reserves and the ability to move power still determine the operating position.
Demand exceeded 70 GW for more than half the window
554 of 1,008 hours · July 19–August 29, 2026 · select a day to inspect its demand range
Aug 22, 2026
14 of 24 hours ≥70 GWCell values count hourly-average demand observations at or above 70 GW in each Central-time day; darker cells indicate more hours. Each day has 24 observations. The 70 GW comparison is a rounded prior weekly-average record, not an operating limit. Daily low and high are hourly averages. Source: EIA-930 demand.
The lowest hourly reading anywhere in the six weeks was 53.8 GW. In the record-average week, even the lowest hourly reading was 56.3 GW. Daily demand still rose and fell substantially; the record did not erase the daily cycle. It raised the amount of electricity that had to be supplied through that cycle.
A demand record does not identify its cause#
EIA pointed to sustained high temperatures as a contributor. The hourly totals used here do not divide the increase among air conditioning, industrial activity, population growth or data centers. Nor is this a weather-adjusted comparison: the dates match, but temperatures, weekdays and customer behavior need not.
The nighttime finding therefore describes a measured change in the demand profile. It does not establish a new permanent minimum or show how much any one customer class contributed. Separating those effects would require weather normalization and more detailed customer or end-use data.
For planning, the six-week duration is the useful addition to the peak-day story. Resources must cover repeated daily cycles, and storage must have opportunities to recharge between discharges. This demand-only analysis does not measure whether those opportunities narrowed or whether reserve margins fell. Those questions require the supply and operating record alongside load.
Our August operating-day comparison shows why that second step matters: the highest-load day was not the day with the least committed-capacity headroom. The next test for this longer window is how supply availability, storage charging and reserves varied from week to week.
Data and method#
This retrospective is dated to EIA’s September 3 report. Calculations were prepared from the latest EIA-930 submissions retrieved September 20, 2026 UTC; they are not archived September 3 data vintages. The measured 2026 window ends August 29. EIA reports ERCOT as balancing authority ERCO; the numbers describe that footprint, not every utility in Texas.
Weekly means use complete Sunday–Saturday weeks in America/Chicago. The six-week window is July 19 at midnight through August 30 at midnight, with the endpoint excluded. Each year’s calendar-date comparison contains 1,008 hourly observations; the overnight subset contains 252. Missing hours are not filled. The earlier-record search covers complete 168-hour weeks in 2019–2025. Energy is the sum of hourly-average MW multiplied by one hour. Display values are rounded after calculation.
Share this story#