New York's load zones, on the map
Locate NYISO's eleven load zones, A through K, and compare their latest reported electricity demand. Open the same zone geography and pricing points on the live map.
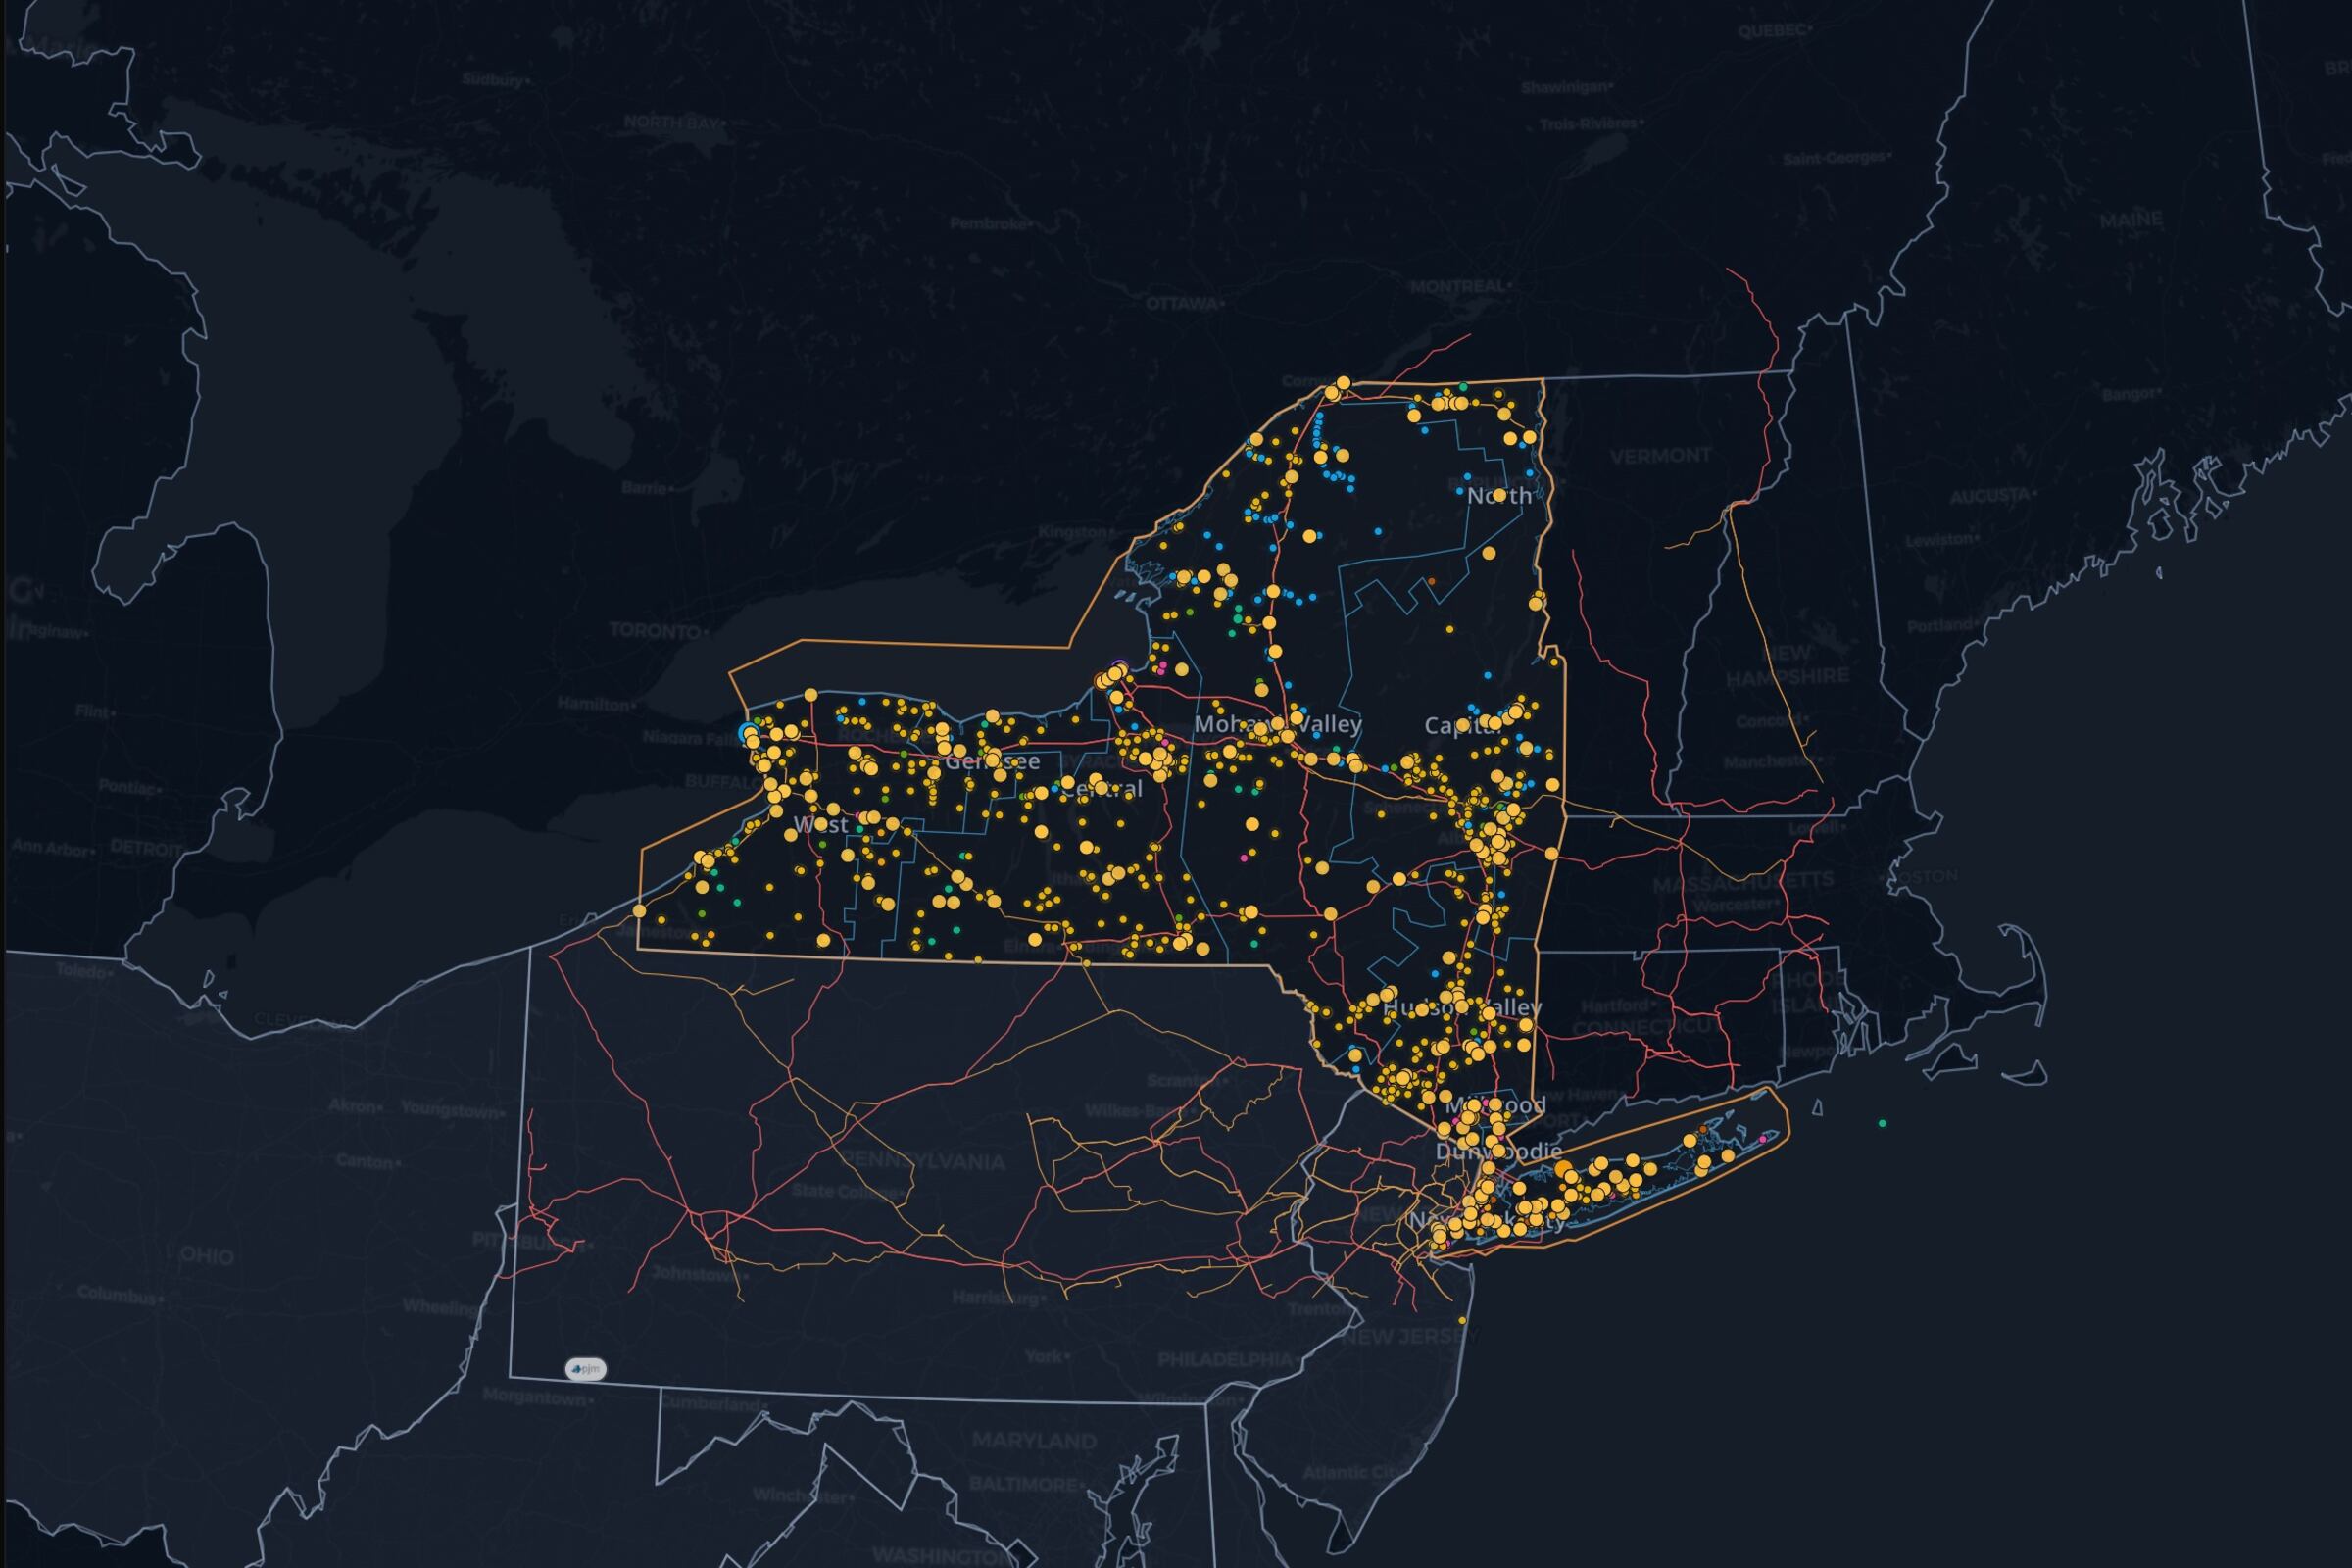
See it on the live NYISO map, updating as the market publishes.
Explore the zone mapAbout this view
Eleven zones across New York
NYISO divides New York into West (A), Genesee (B), Central (C), North (D), Mohawk Valley (E), Capital (F), Hudson Valley (G), Millwood (H), Dunwoodie (I), New York City (J) and Long Island (K). The live demand table retains the operator's zone identifiers.
Demand and price answer different questions
Zonal demand measures electricity use in MW at the published observation. The price map shows the value of the next MWh at a location. Compare matching times before relating the two; a zone's demand alone does not establish congestion.
Explore a zone in context
Open the zone map to inspect pricing points and surrounding infrastructure. Use the transmission View for the public line inventory and the forecast for NYISO's demand outlook.
Questions
Which NYISO zones cover New York City and Long Island?
New York City is Zone J; Long Island is Zone K. Hudson Valley, Millwood and Dunwoodie are zones G, H and I respectively.
Are NYISO zones utility service territories?
These are NYISO load zones. A zone label is not a determination of which utility serves a particular property.
Does the demand table show zonal prices?
It shows zonal demand in MW. Follow the real-time LMP View for published location prices in $/MWh.
Can I open this zone map in the platform?
Yes. The map action restores New York with the zone and pricing-point layers, ready to explore.