
NYISO grid conditions, prices and zones
New York Independent System Operator · New York
Explore New York's electricity grid with NYISO location prices, zonal demand, fuel mix and operator messages. Open the map to compare the eleven load zones, inspect infrastructure and investigate conditions with the agent.
NYISO on the live map
LiveWhat you can ask NYISO
Open the agentClick any question to open it in the live agent with the market already selected. The answer keeps its sources attached.
What's live here
Every dataset, sourced12 coverage areas live today. Each row is backed by named source feeds in the public data catalog — cadence and provenance included.
| Coverage | Detail | Cadence | Status |
|---|---|---|---|
| Zonal prices (LBMP) | Real-time five-minute and day-ahead hourly LBMP for all eleven zones, with energy, congestion, and loss components | 5-min / hourly | Live |
| Generator prices | Generator-level LBMP in real time, day-ahead, and hourly-integrated settlement form | 5-min – hourly | Live |
| Limiting constraints | Real-time and day-ahead constraint records naming the facility, contingency, and constraint cost | 5-min / hourly | Live |
| Interface flows | Five-minute external interface flows with transfer limits, ATC/TTC by interface, and Lake Erie loop-flow circulation | 5-min – hourly | Live |
| Demand | Five-minute preliminary and hourly integrated actual load by zone, plus hourly zonal forecasts with vintages | 5-min / hourly | Live |
| Fuel mix | System generation by fuel category — dual fuel, gas, nuclear, hydro, wind, and more | 5-min | Live |
| Ancillary services | Real-time and day-ahead reserve and regulation prices by location — spinning, non-synchronous, 30-minute, regulation | 5-min / hourly | Live |
| Behind-the-meter solar | Estimated BTM solar actuals, day-ahead forecasts, and installed capacity | Hourly | Live |
| Emissions | Implied marginal emission rates in real time and day-ahead | 5-min / hourly | Live |
| Outages & operations | Outage schedules, real-time and scheduled line outages, operator commitments, real-time events, and operator messages | As published | Live |
| Assets & weather | Plant profiles from EIA-860 and HIFLD, NYISO weather forecasts, and ERA5 history grids | Reference / hourly | Live |
| Radar cockpit | Live system conditions plus transmission weather sensitivity, external interfaces, zonal prices, generation, and operator events | Streaming / 5-min | Live |
Live intelligence for NYISO
Browse every live viewEverything Ask the Grid publishes on NYISO, in one place — what the grid is doing now, where it is headed, and what has been written about it.
Live views
Forecasts and outlooks
Coverage and analysis
Data and access
NYISO power plant registry
NYISO’s EIA-anchored plant registry is searchable by operator, technology, and county, with capacity ranked.
Registry assets
1,037NYISO plant records
EIA nameplate capacity
44.5GW
The product, as it runs
Recorded from the live product, with this market's data.
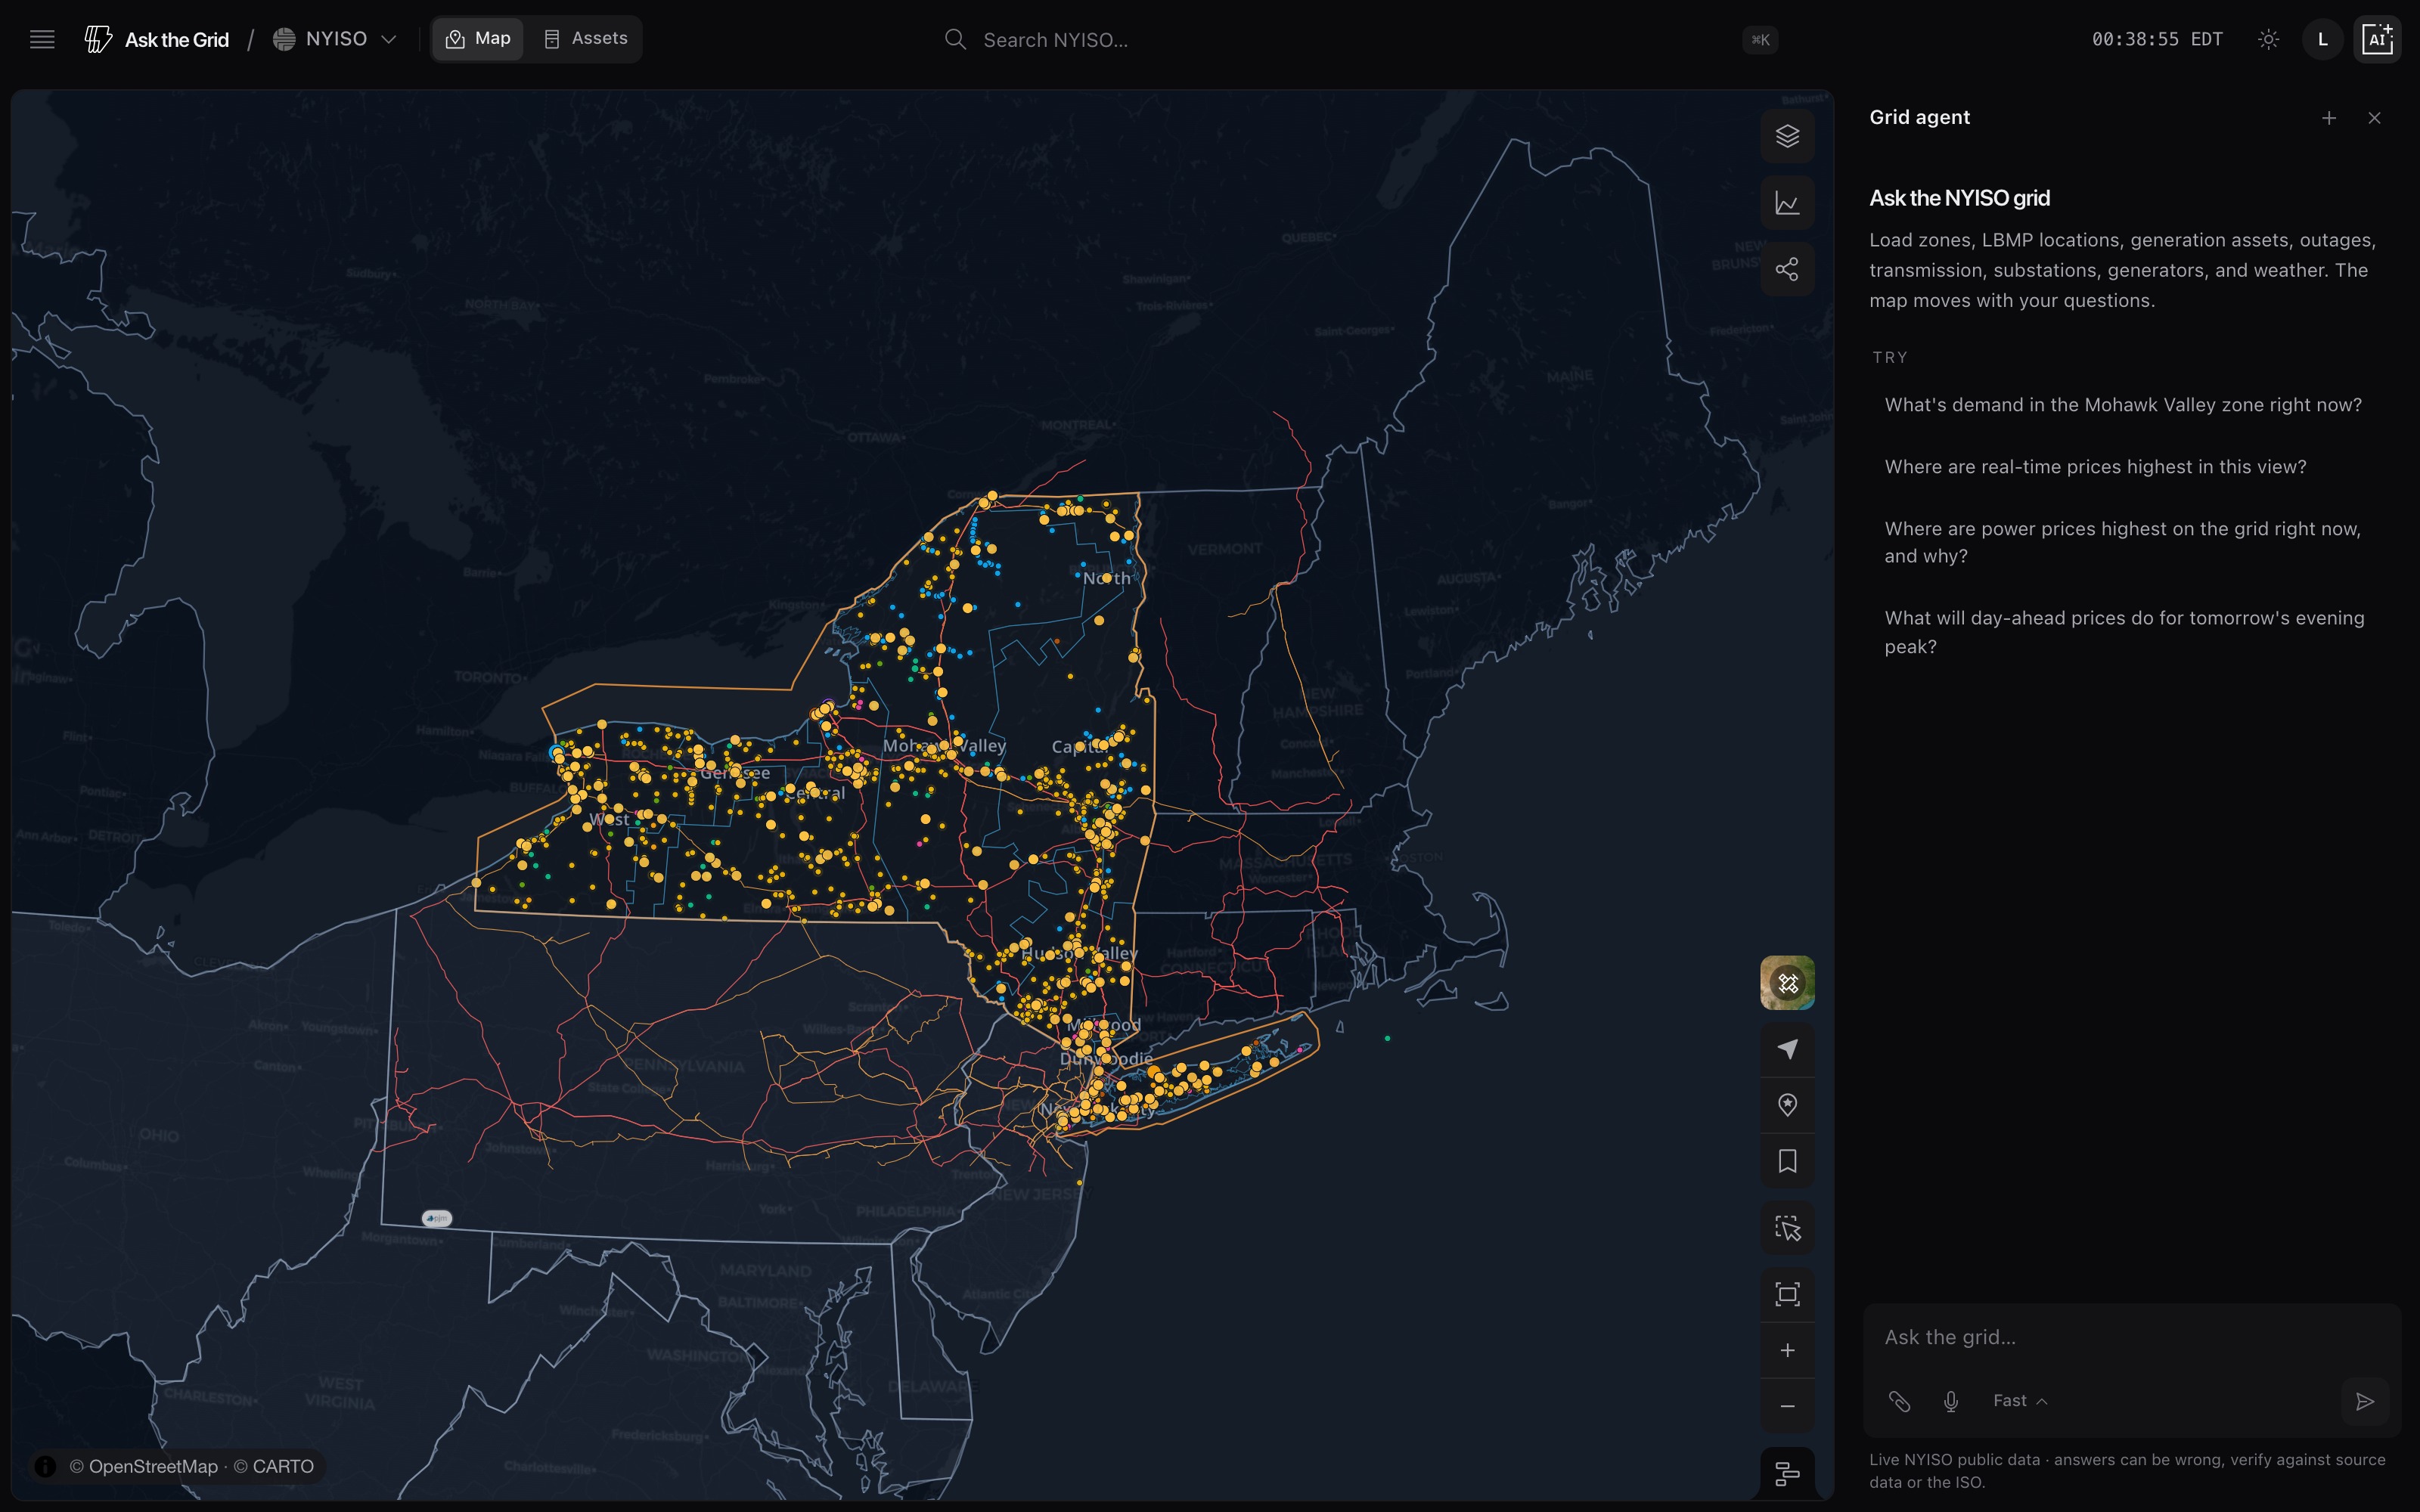
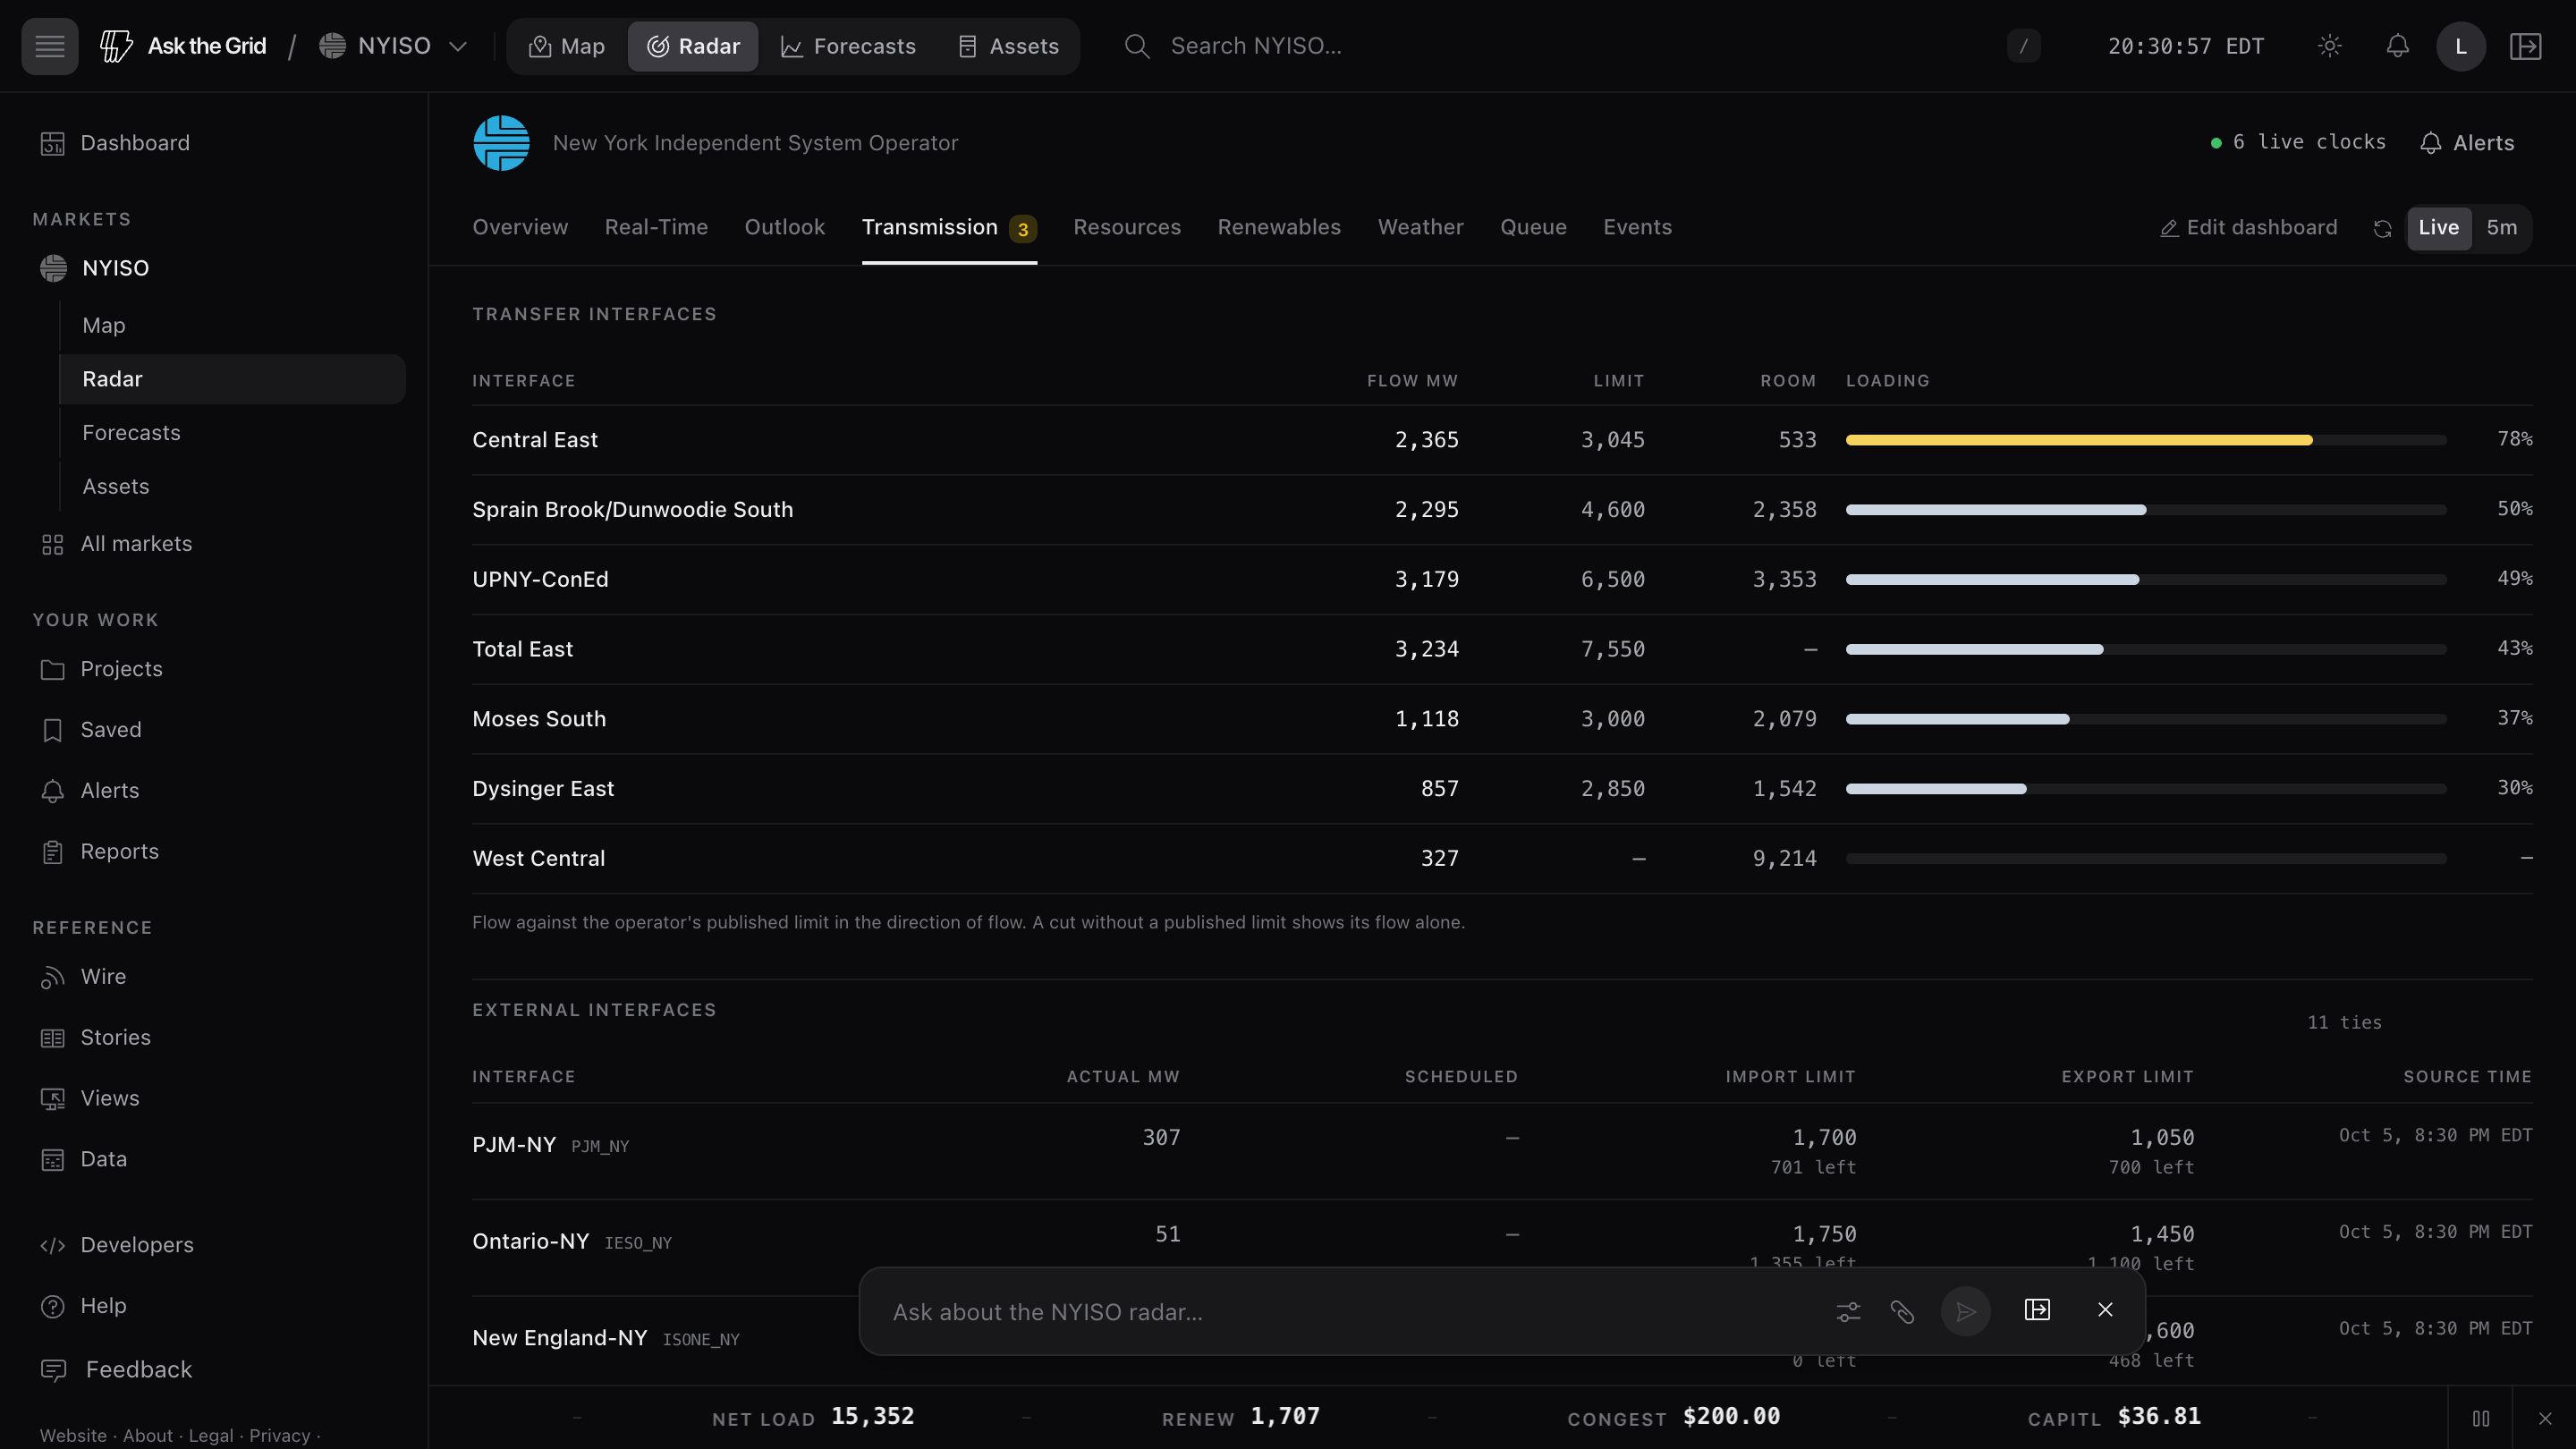
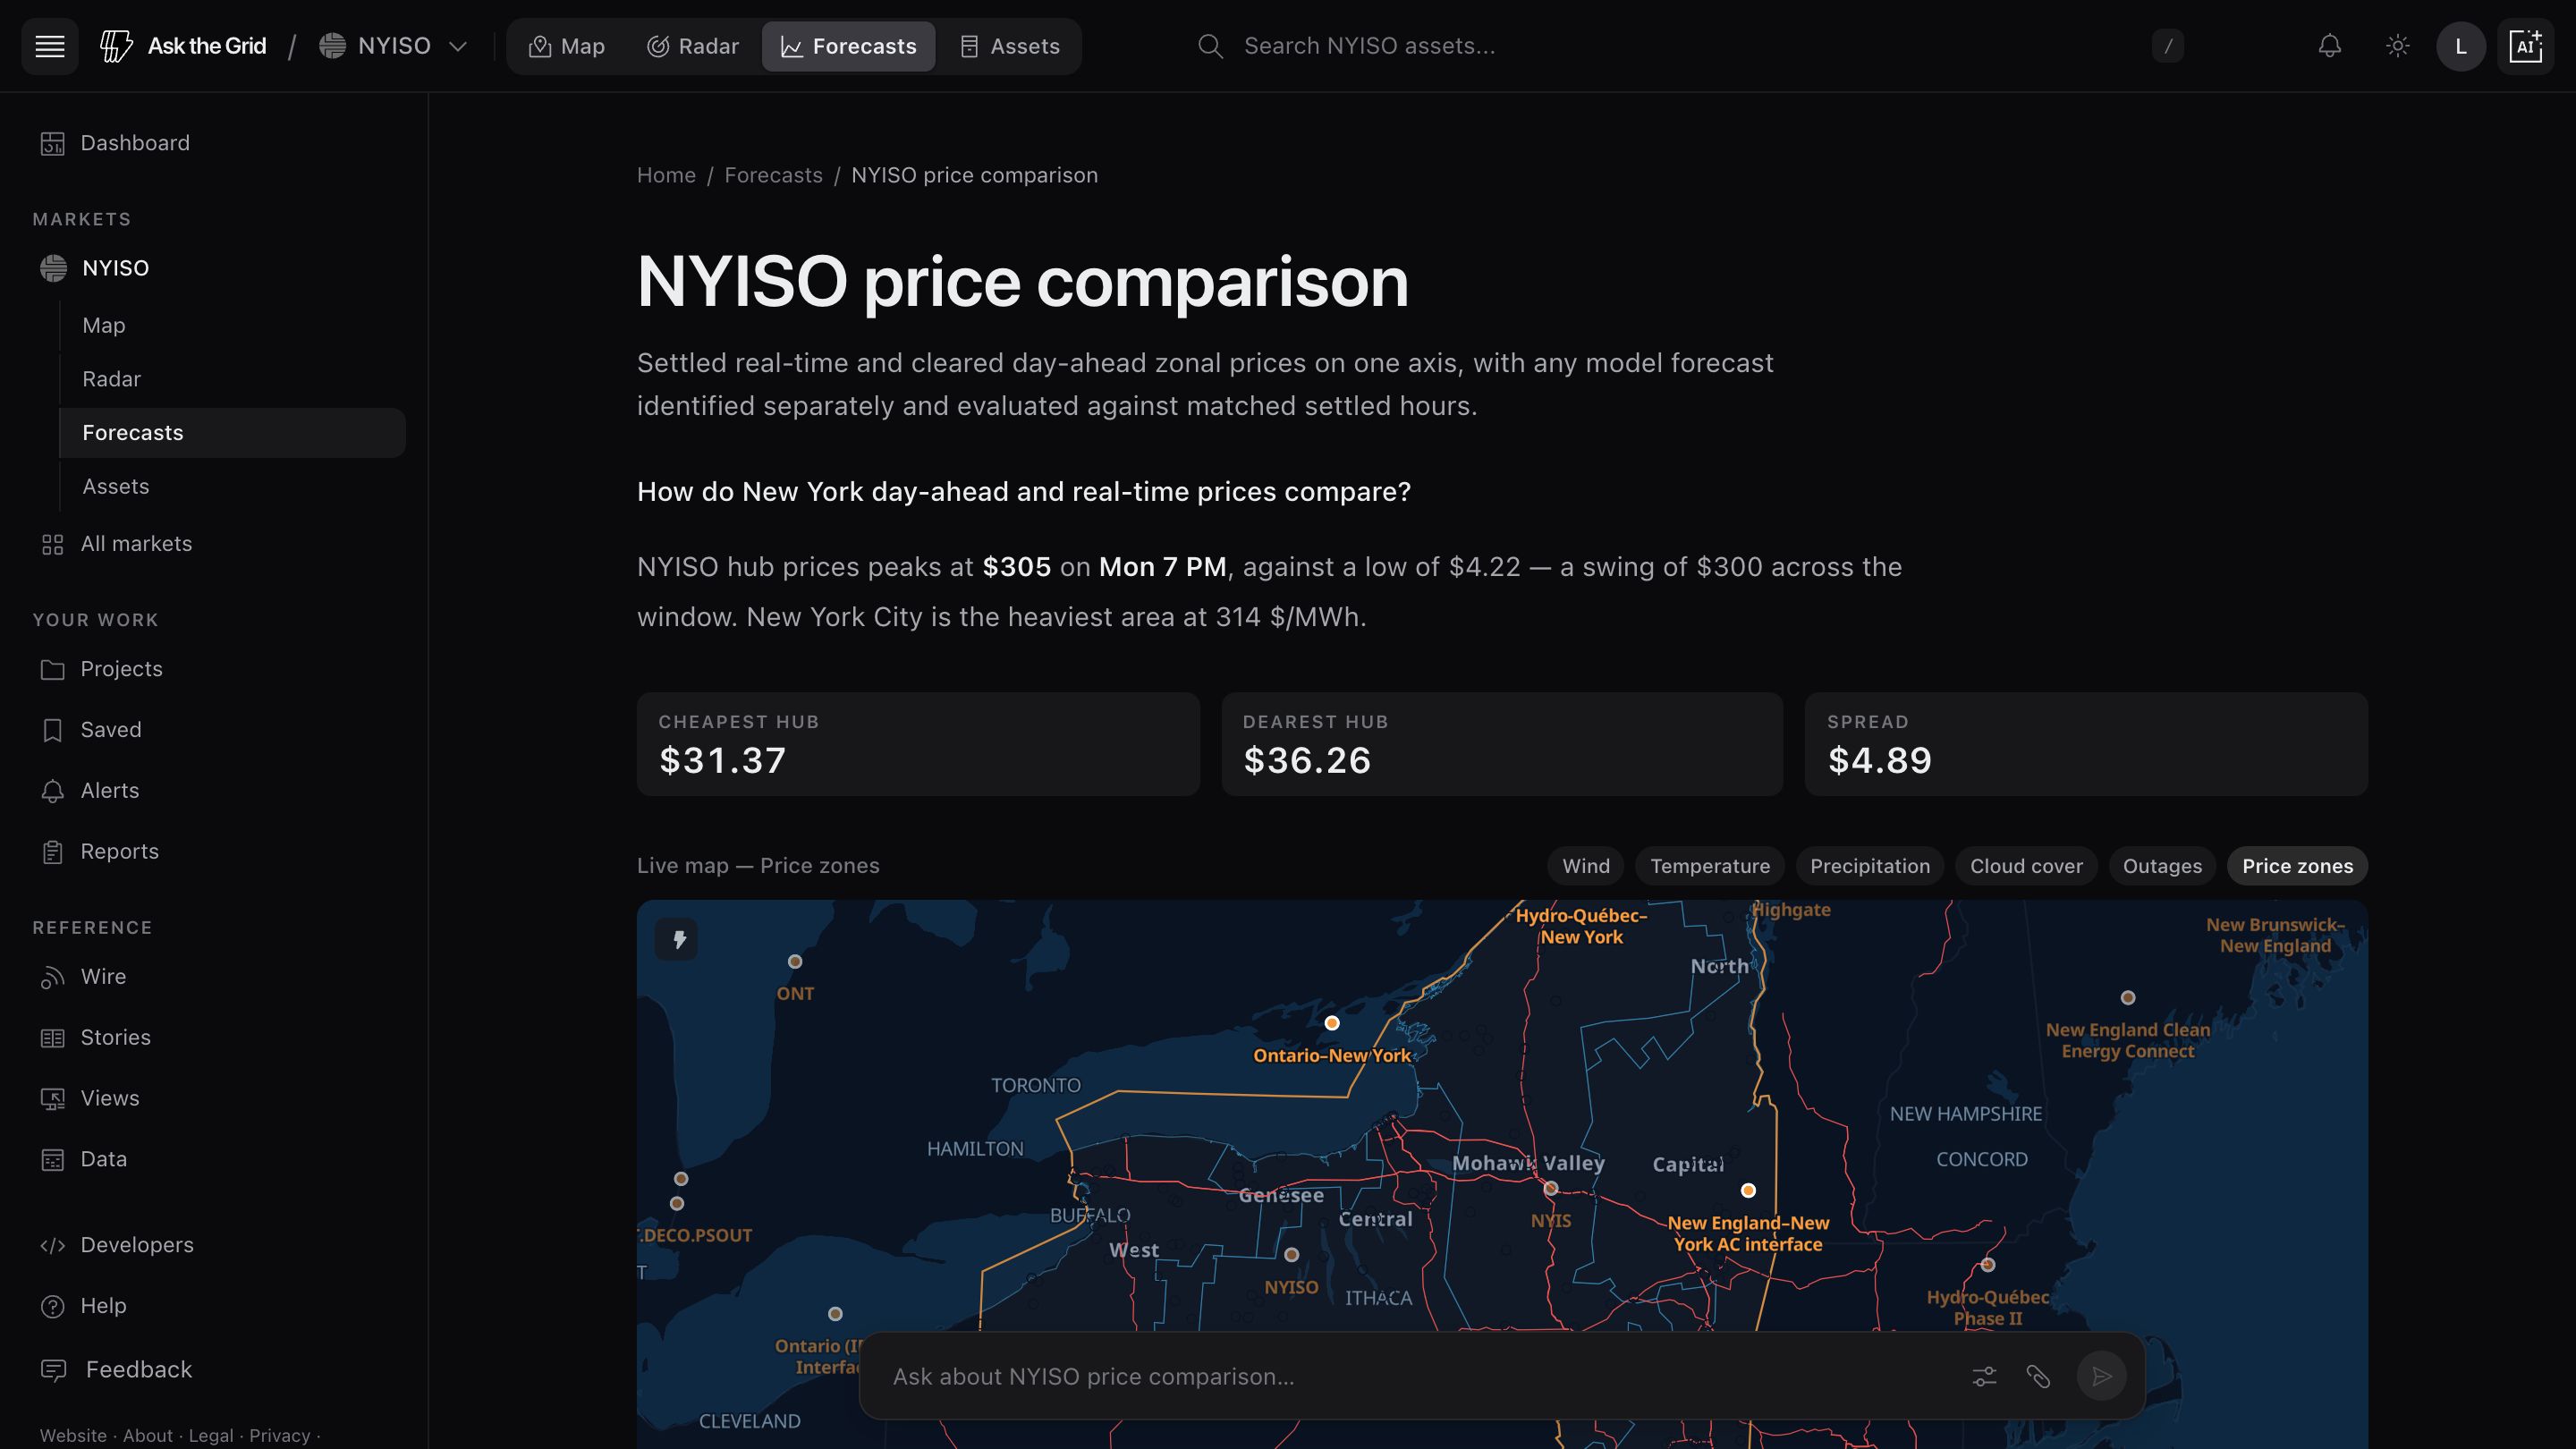
Read New York load zones, prices and interfaces
NYISO publishes load-zone and generator prices as locational based marginal prices, or LBMP. New York's eleven load zones run from West (A) to Long Island (K). The zone map shows that geography alongside reported demand; the price map shows the published location prices.
Compare zonal prices with the same interval's demand, interface flows and transfer limits. Published constraint data provides additional evidence about dispatch limits. A price spread between upstate and downstate locations alone does not establish the cause.
Use the map to inspect a zone, pricing point or asset, then ask the agent to investigate the available source records. Forecasts, operator messages and interconnection requests remain separate from observed operating values.
Ask NYISO what changed.
Open the live market and begin with a question, a place, or an interval.