NYISO LMP map: real-time electricity prices
Compare the latest published prices at generator and load-zone buses, in $/MWh. Review the highest-priced locations below, then open the price map to compare locations across the grid.
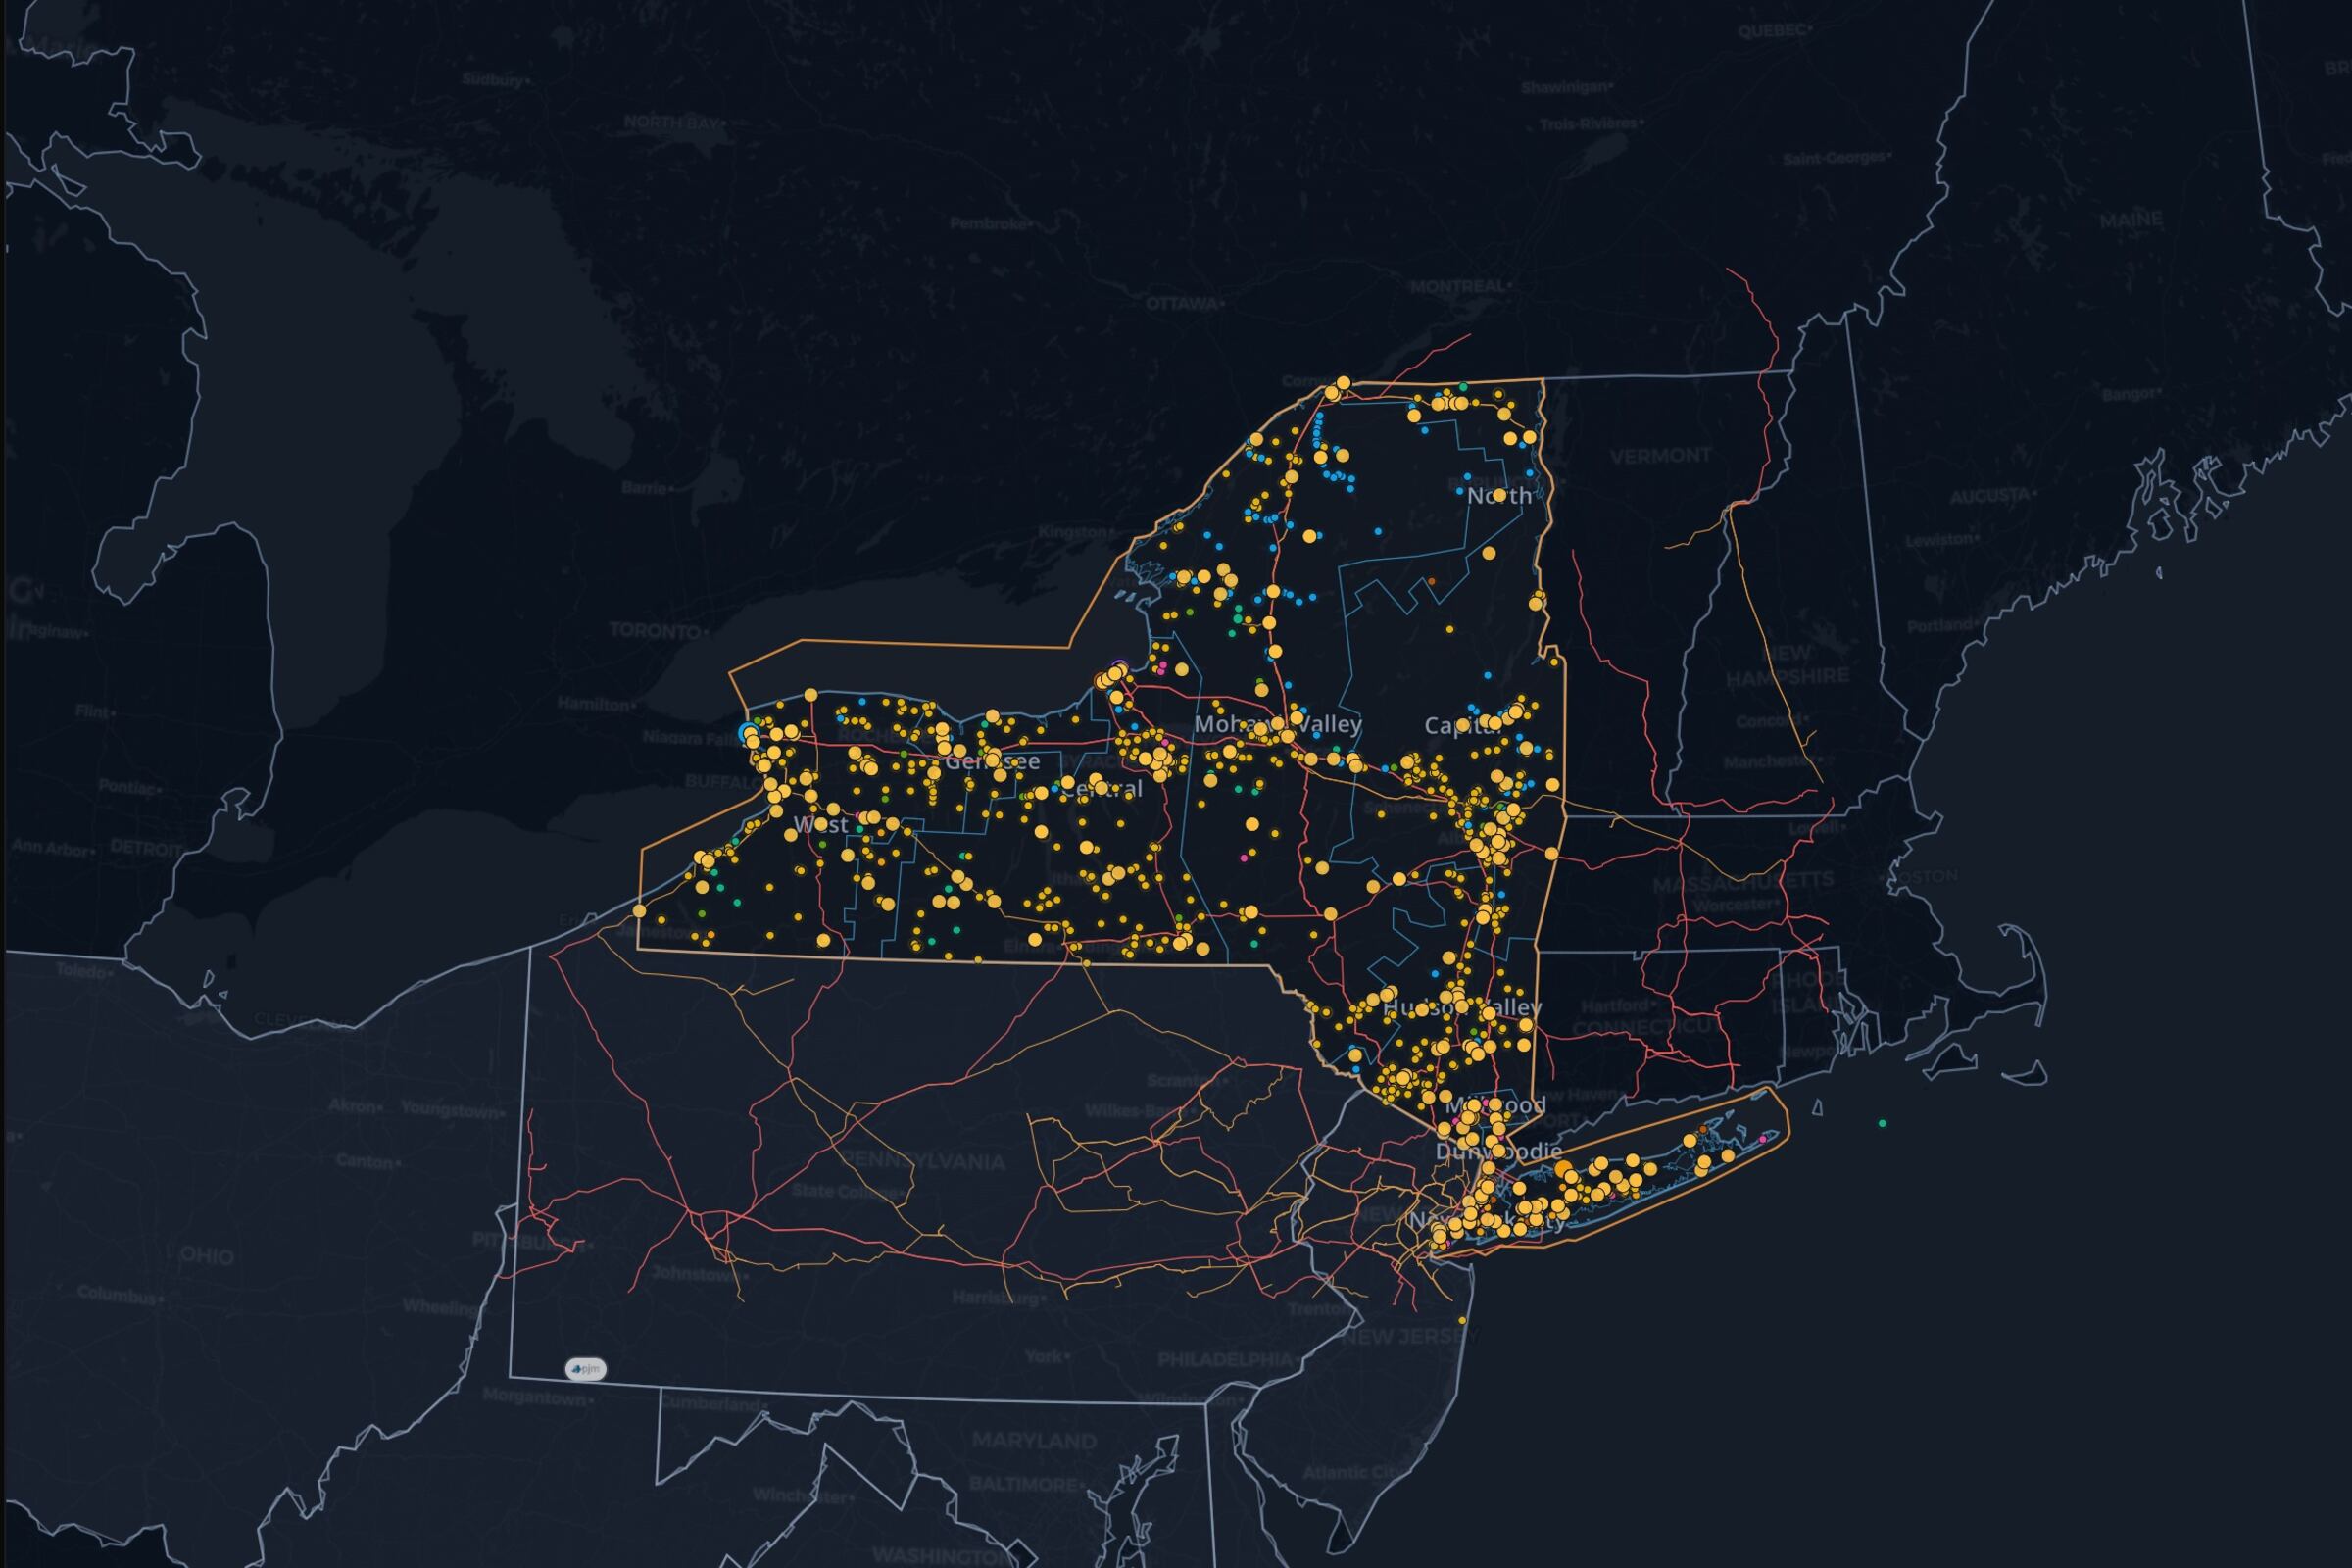
See it on the live NYISO map, updating as the market publishes.
Explore NYISO prices on the mapAbout this view
Read NYISO real-time LMPs
The table ranks reporting locations by their latest published 5-minute RTD prices, from highest to lowest. Locational marginal price is the marginal cost of serving another MWh at a location; the table and map retain the operator identifiers.
Compare price differences across the grid
Select a pricing location on the map, compare nearby prices, and investigate published demand, generation and constraint data. A price difference is a starting point for that investigation; the price alone does not identify its cause.
Questions
Is this the day-ahead or real-time price?
Real-time. This View shows NYISO's live 5-minute Real-Time Dispatch (RTD) LMP, not the day-ahead market clearing price.
What's the difference between a zonal and generator price?
NYISO prices both its eleven load zones (A through K) and individual generator buses. This table lists whichever pricing points NYISO is currently publishing, exactly as reported.
Does a high price mean congestion?
Not on its own. A high price can reflect system-wide scarcity, local congestion, or both. Compare nearby pricing points and check demand, generation, and outage context before concluding congestion specifically drove one point's price.
Will the map open with these layers?
Yes. It carries the same layers, filters, viewport, and timeline state shown on this page into the live NYISO workspace.