What is actually happening on the NYISO grid right now?
Every recent operating event and market notice NYISO has published, newest first — then open the exact same live view on the map.
Every recent operating event and market notice NYISO has published, newest first — then open the exact same live view on the map.
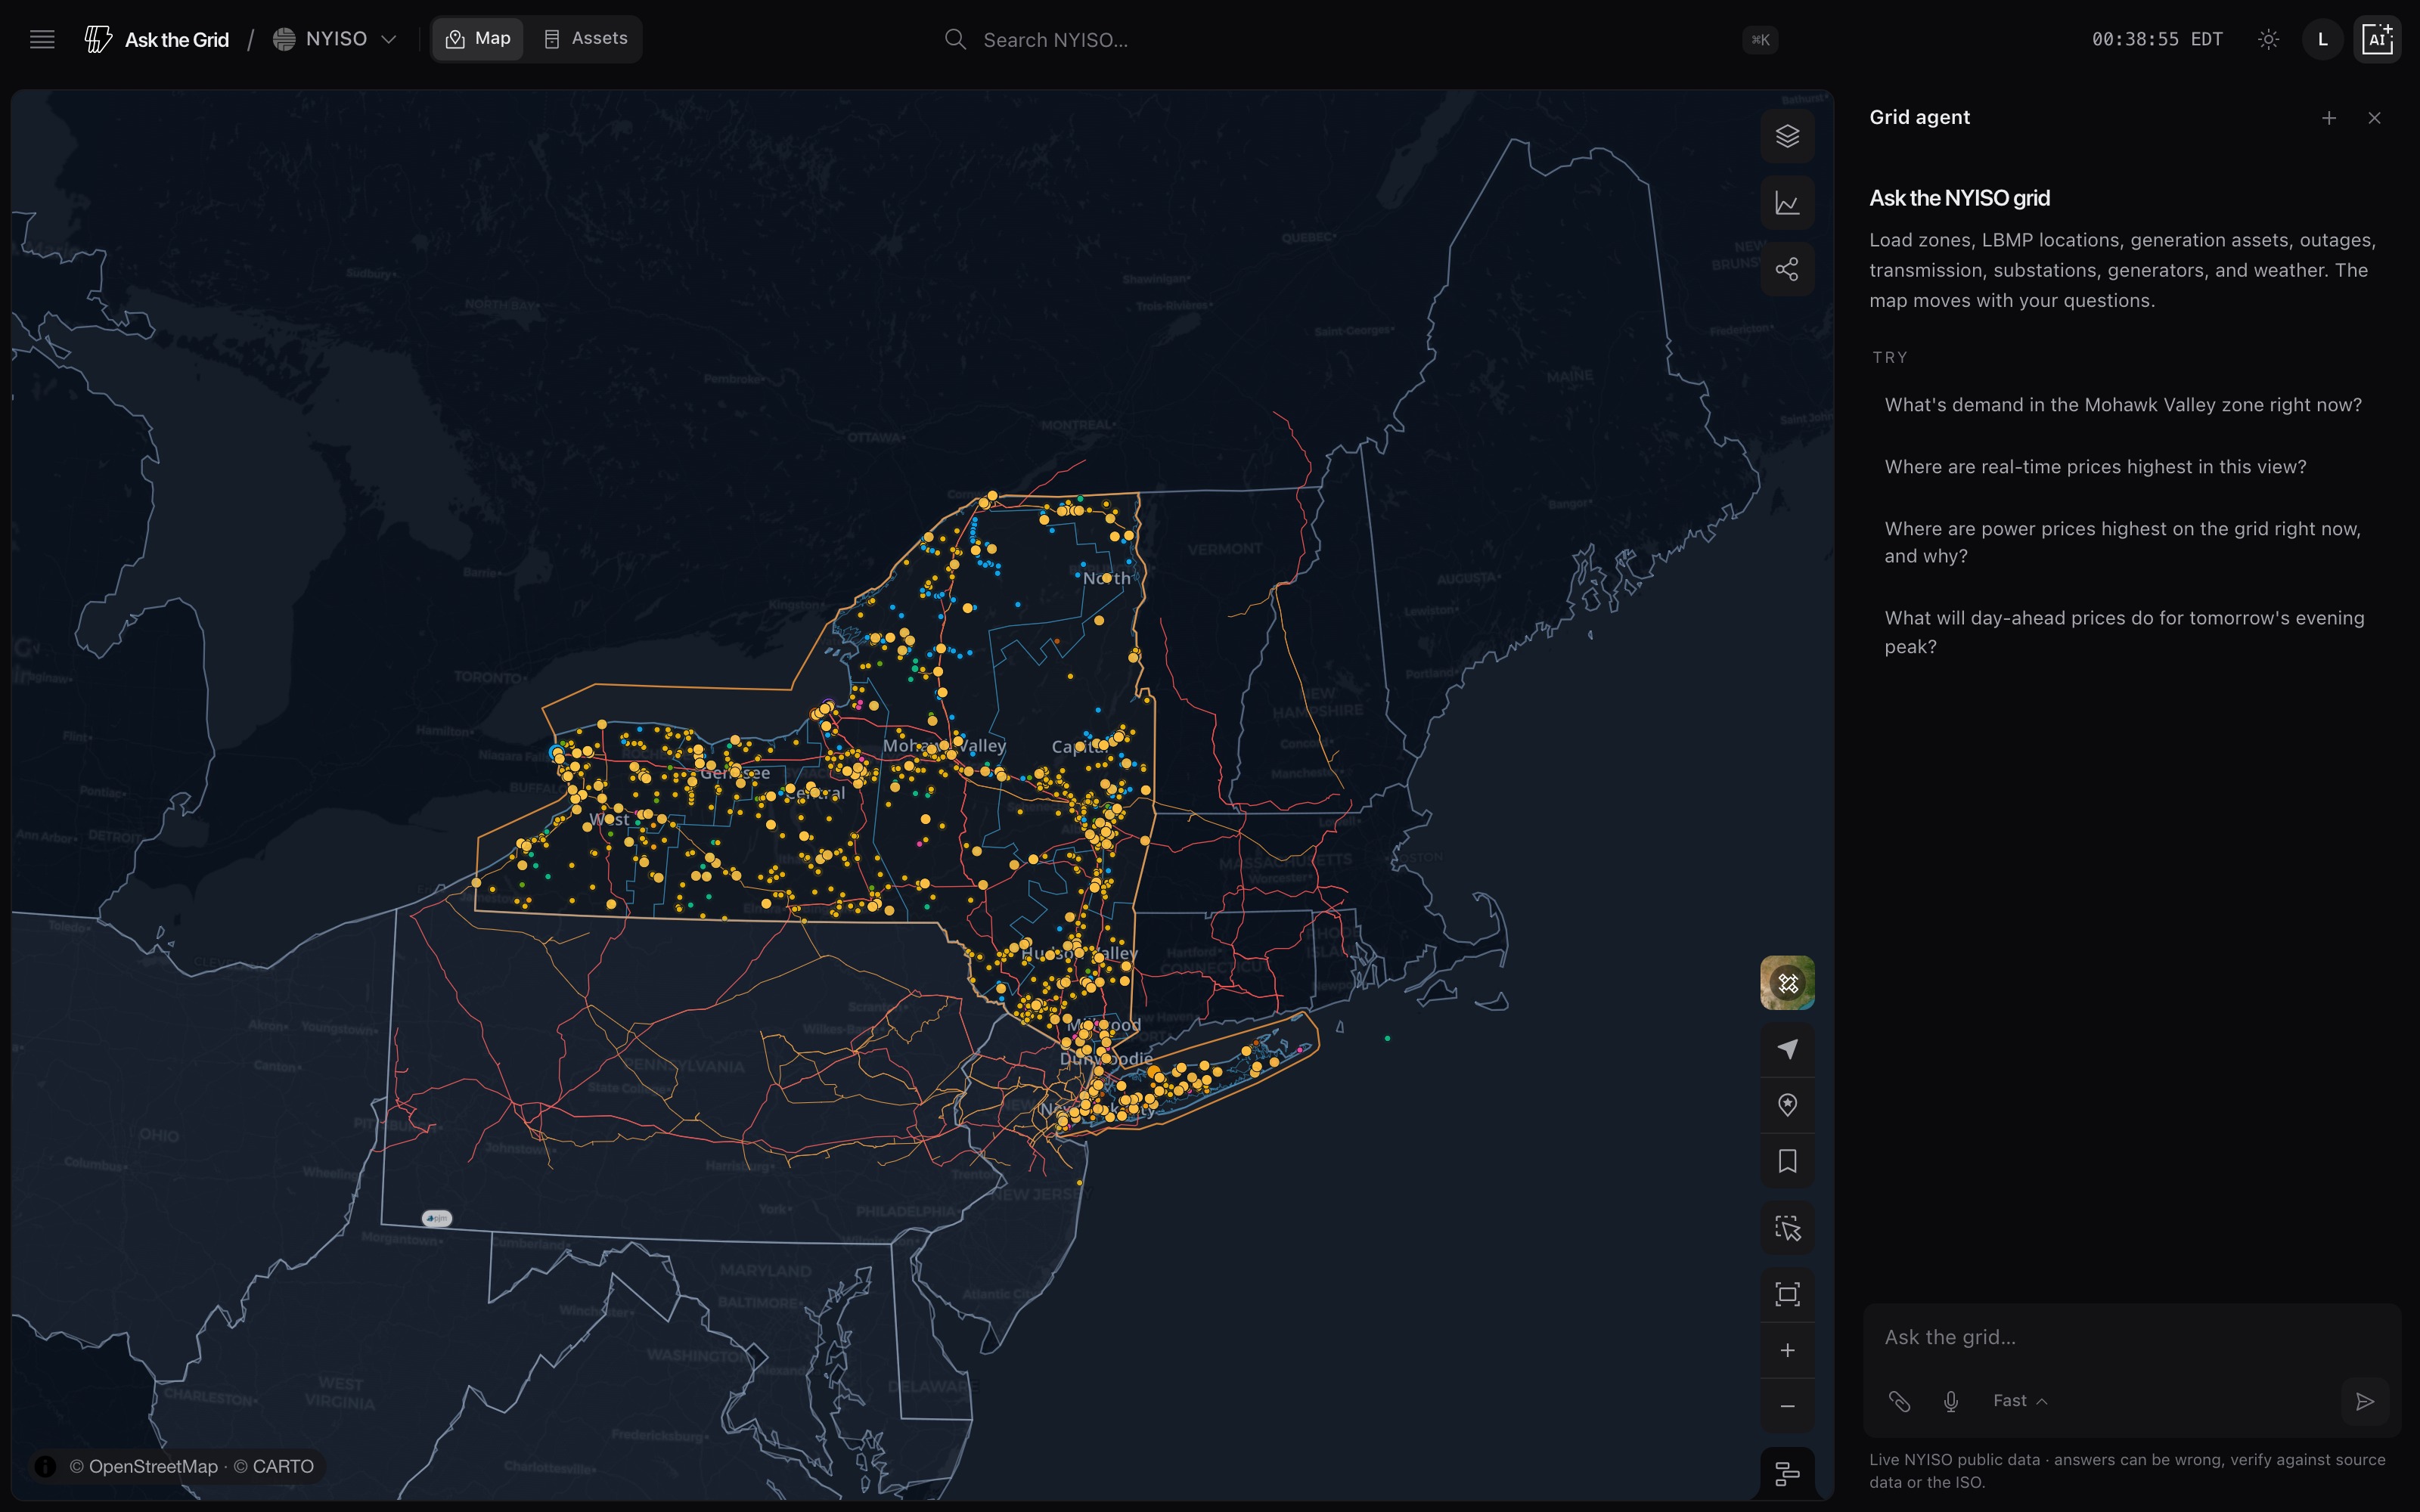
Normalized operating events and market notices from NYISO — weather watches, reliability advisories, market and operations notices — each with its scope, category, severity, and the time window it's valid for.
A price spike, an outage cluster, or unusual generation behavior usually has a published event or notice behind it. Reading events next to live prices, outages, and generation is a faster route to a source-backed explanation than any of those layers alone.
| Event | Category | Starts |
|---|---|---|
| RAMAPO___345KV_76-2X scheduled outageOpen on map | transmission | Sep 18, 5:58 AM |
| RAMAPO___345KV_T76-2 scheduled outageOpen on map | transmission | Sep 18, 5:58 AM |
| PLSNTVLY_345KV_RN5 scheduled outage | ||
They're normalized from NYISO's own published operating events and market notices. Each row keeps its original category, severity, and validity window rather than reinterpreting what NYISO reported.
Severity levels (info, watch, warning, emergency) reflect how the source or a stated rule classified the event, not an independent Ask the Grid judgment call.
Not by itself. Treat an event as the operator's own account of what's happening; verify a specific outage or price claim against the outage and price Views directly.
Showing the top 100 of 300 events in the last 14 days. Open the live map for the full, filterable view.
Yes. It carries the same layers, filters, viewport, and timeline state shown on this page into the live NYISO workspace — the same save/restore system behind a personal saved view.