Forecast the grid with Metis.
Parisi Labs' world models for physical systems, starting with energy. Forecast price across ERCOT, NYISO, CAISO, and PJM, with uncertainty for each interval.
Forward outlook
6:45 PM
$110p50
p10–p90 $67–$176
58% chance above $100
Brighter is likelier. Run a finger or cursor along the day, or switch to Fan to see the same forecast as nested bands.
Forecast outputs
Public preview outputs open in the console for every account. Private preview outputs are set up for your organization on request.
- Outputs
Price
Forecast price across ERCOT, NYISO, CAISO, and PJM, with uncertainty for each interval.
- Horizon
2 days
Each published output has its own available horizon and native interval.
- Coverage
ERCOT, NYISO, CAISO, and PJM
Choose a native target for each output in the developer console.
- Re-issued
1 hour
Compare issue times and model versions alongside each returned forecast.
Loading published forecast outputs…
Same average, different risk
A point forecast says tomorrow’s 7 PM price will be $50. That could be a quiet hour that settles between $35 and $65. It could also be a nine-in-ten chance of $30 and a one-in-ten chance of $230. The average is identical.
For a battery deciding when to discharge, or a desk carrying short exposure into the evening, those are opposite days. Metis forecasts the distribution itself, so the second day looks like the second day.
Quiet evening
Chance above $100 0%
Spike in play
Chance above $100 10%
What you can read off it
One forecast, four readings. Each is a question a desk or an operator already asks, answered by the shape of the distribution.
In the product
Or ask in plain English
The agent reads the same forecast, lines it up with the day-ahead price and what has settled, and cites the issue time.
What it reads
For the price forecast, load, generation and weather describe the grid alongside recent and day-ahead prices. Every input is lined up to when it was actually available, the way it would have reached a trader at that hour.
Every forecast is kept, and scored against what settled.
Each hourly issuance is stored as its own vintage, so one interval is forecast again and again as it approaches. When it settles, every one of those forecasts is scored as it was issued, against the real-time price and the day-ahead auction. Nothing is redrawn with hindsight.
Scores by market and location sit on the accuracy board, beside every other forecast Ask the Grid tracks.
Where it runs
Forecast pages and the map
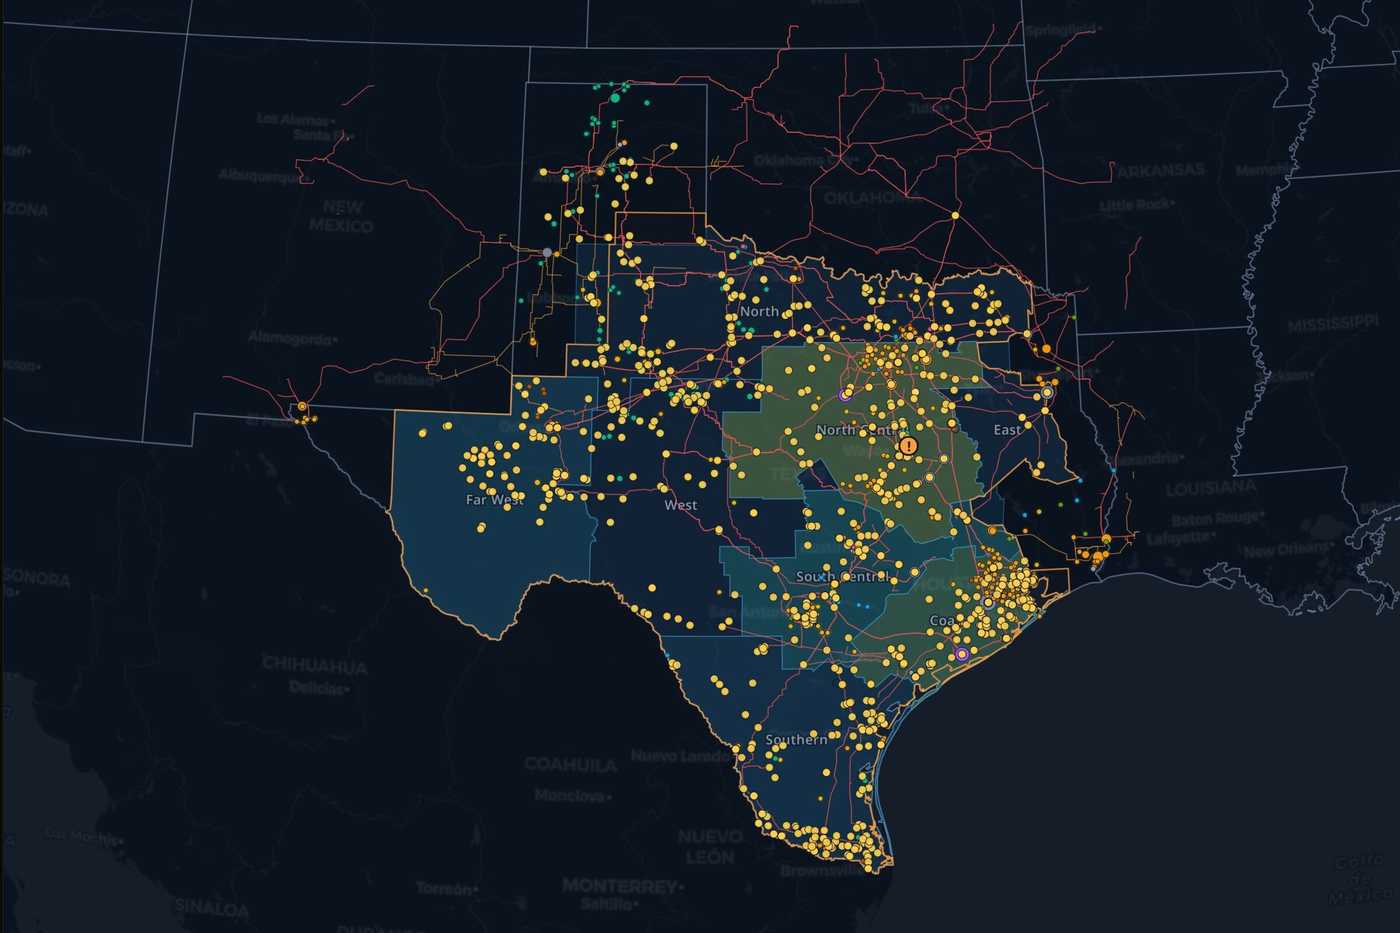
The distribution sits beside observed real-time prices and the cleared day-ahead price, on forecast pages, node pages, and the map.
ERCOT price forecastThe agent
Ask about upside risk or tomorrow's peak in plain English. The agent reads the same forecast and cites its issue time.
Ask about ERCOTForecast API
Request a node, zone, or hub over HTTPS and get the same bands, issue times, and settled prices the product draws.
Open the playgroundMCP
The Metis family
Metis is how Parisi Labs builds world models: models that learn how a physical system behaves and explore the futures it could take. Power comes first. It couples many physical systems, repeats its decisions every few minutes, and settles every one of them against an outcome you can measure.
Prices are where the family starts. The direction from here is the one in the Parisi Labs thesis: from forecasting how a system usually evolves to learning how it changes when you act on it.
Model card
Intended use
- Comparing a location's outlook with cleared day-ahead prices
- Sizing upper-tail spike risk and when the highest-price interval lands
- Scoring forecast vintages against the prices that settled
Limits
- Accuracy varies by market and lead time. Evaluate the horizon your decision depends on.
- It is not a power-flow or transmission-network simulation.
- Each published forecast source sets its own market coverage, issue cadence, and model version.
Questions
What does Metis forecast?
Parisi Labs' family of world models for physical systems, starting with energy. Forecast price across ERCOT, NYISO, CAISO, and PJM, with uncertainty for each interval.
See the range before it settles
Create a workspace to explore published forecasts, switch between outputs and compare their issue times, units and horizons in the console.