Writing from the grid.
Essays on power markets, physical infrastructure, and the product systems that make both easier to reason about. For analysis built from real ISO records, see Data stories.
October 17, 2026 · Grid · 9 min
Transmission Planning With AI Agents: A Study You Can Check
A three-bus transmission planning study: a 200 MW request fits one bus and not the other. What an AI agent should keep, and what a DC screen leaves out.
Read the essay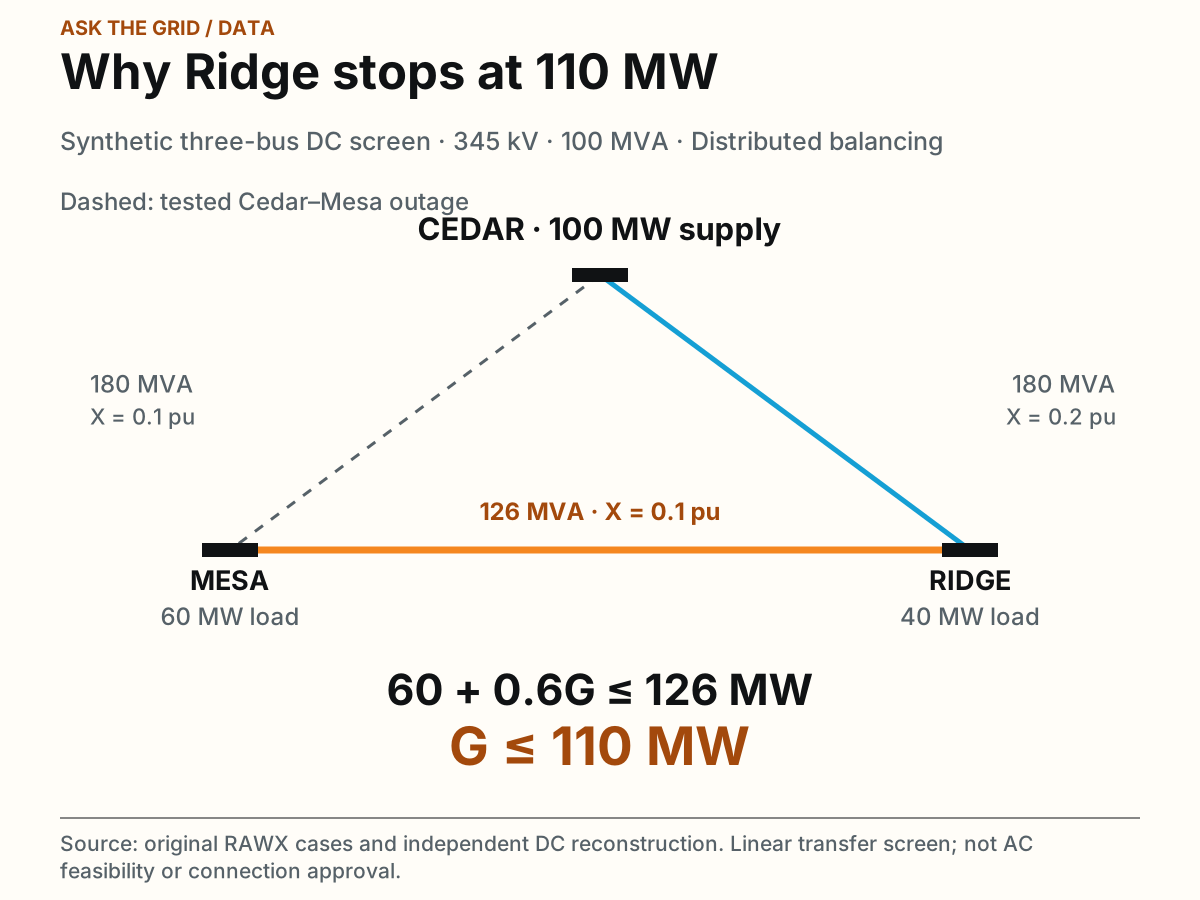
October 14, 2026 · Markets · 7 min
Day-Ahead vs Real-Time Electricity Prices: ERCOT Example
The day-ahead market sets a price the day before; the real-time market charges for every megawatt-hour you miss. One ERCOT evening shows how the two meet.
Read the essay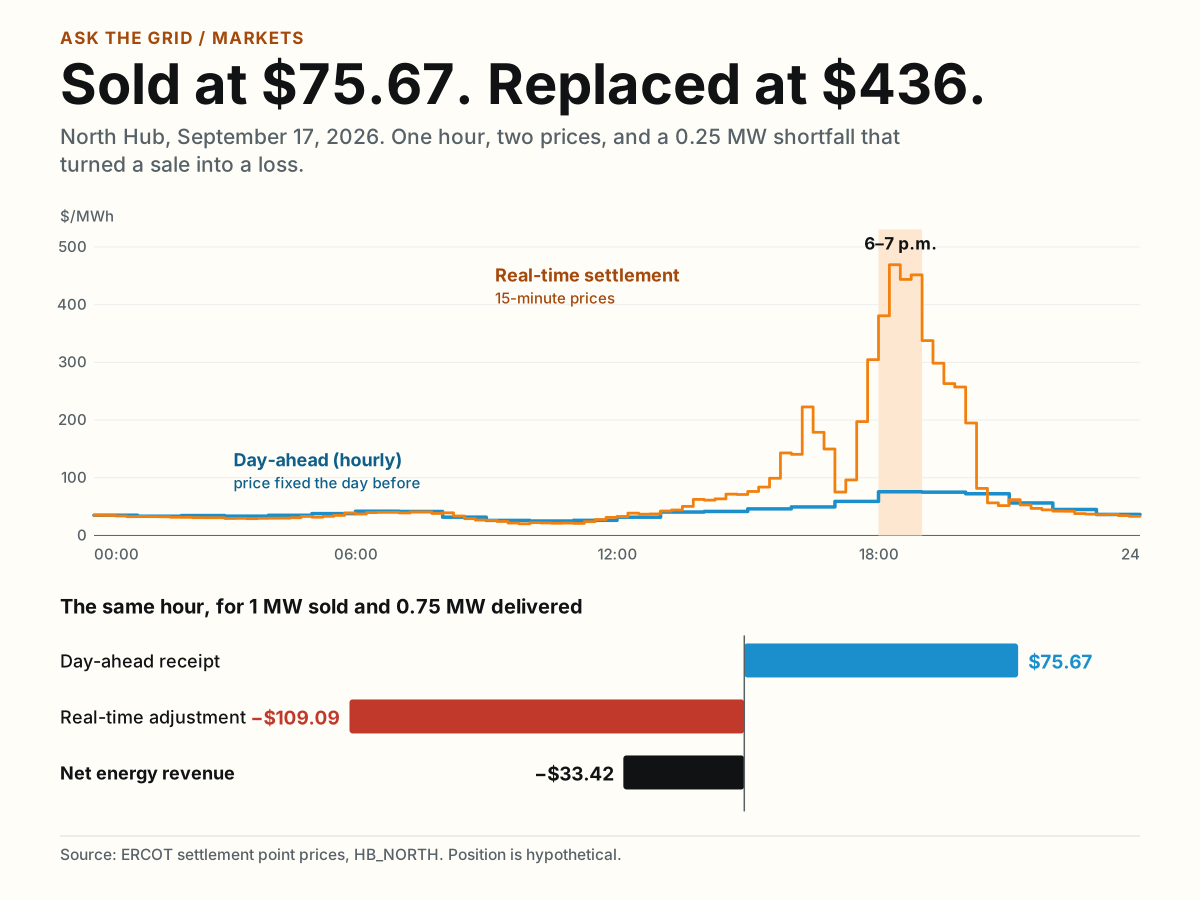
October 14, 2026 · Markets · 6 min
Basis Risk in Energy: Node vs. Hub Prices Explained
A hub hedge leaves the node-to-hub gap open. In September 2026 that gap was $1.79/MWh on average and $4.11/MWh for a solar-shaped output profile.
Read the essay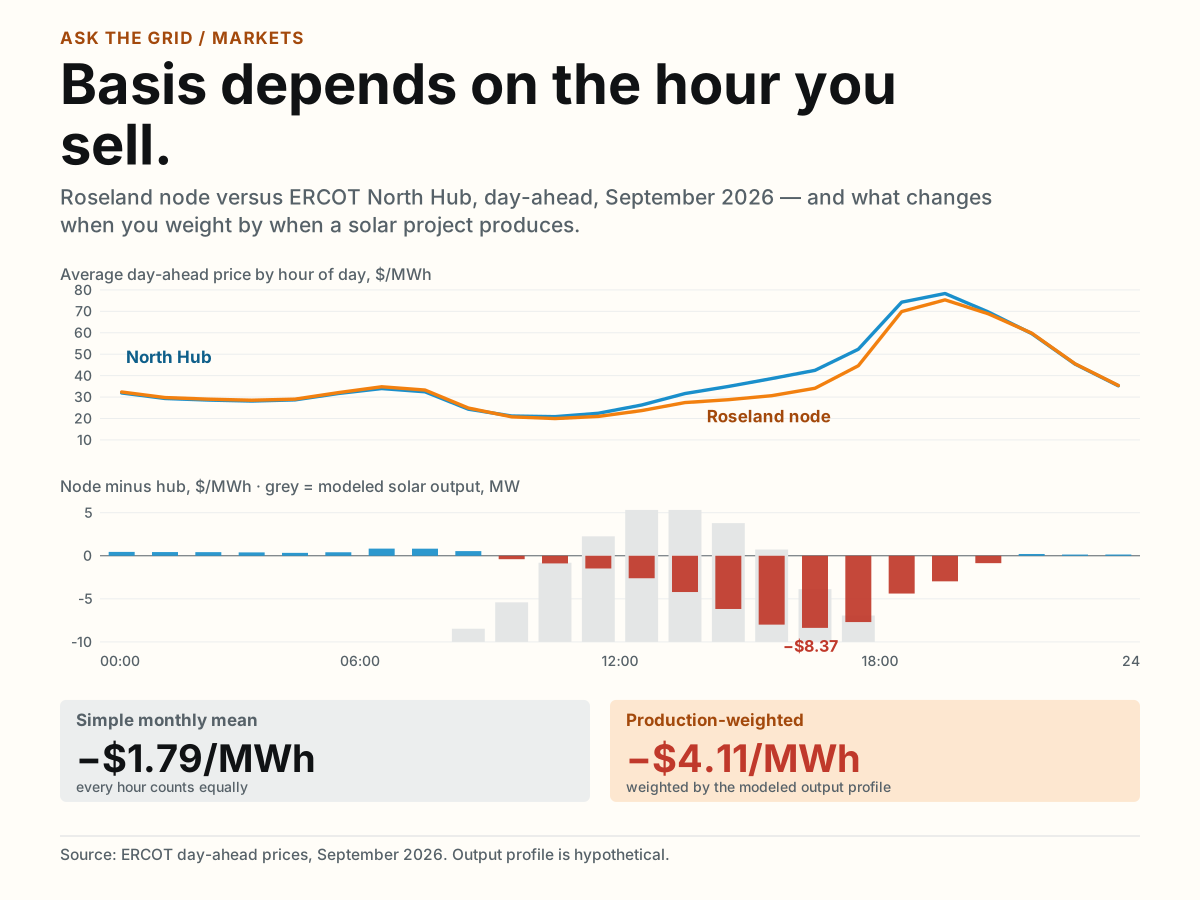
October 14, 2026 · Markets · 8 min
ERCOT Battery Arbitrage: Why Price Spread Overstates Revenue
Multiply a day’s price spread by a battery’s size and you overstate arbitrage by about a quarter. Real ERCOT prices show where the money goes.
Read the essay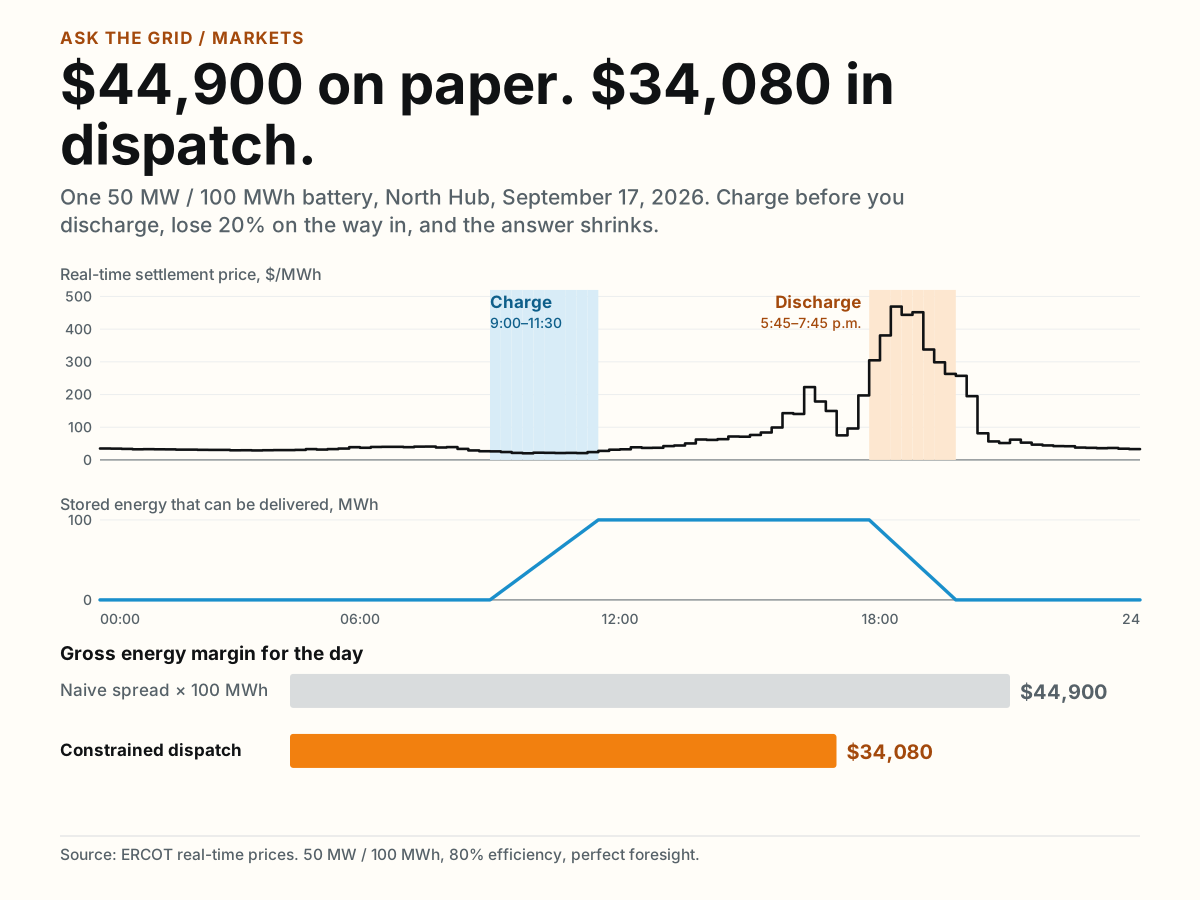
October 14, 2026 · Grid · 7 min
Data Center Power Capacity: What Public Records Show
Riot’s Rockdale site: 700 MW of gross power, 25 MW delivered to AMD, 25 MW contracted, up to 200 MW optioned. What each figure does and doesn’t mean.
Read the essay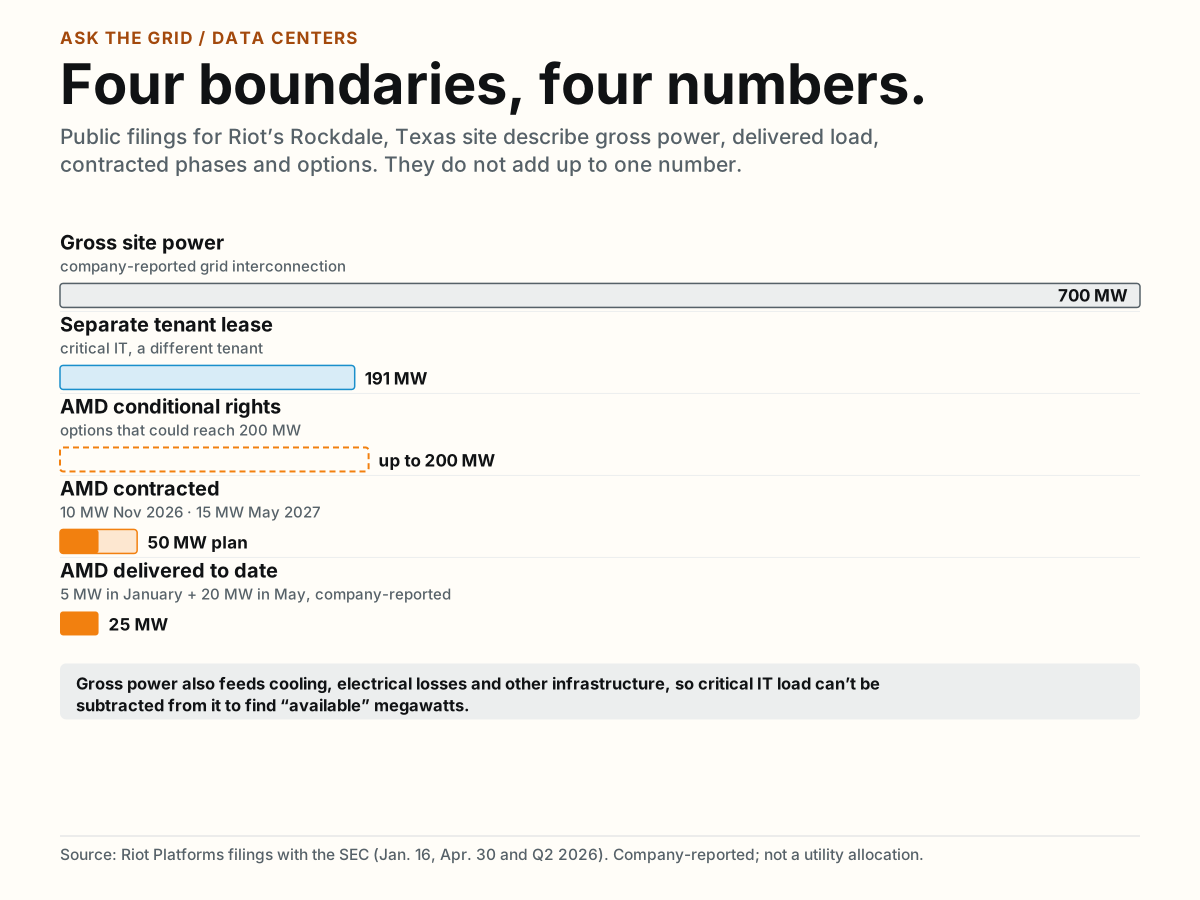
October 5, 2026 · Platform · 6 min
September 2026 Update: Forecasts, Bonneville and Baja Maps
What shipped in September: Metis forecast charts you can step back through, Bonneville and Baja California on the map, and richer asset context.
Read the essay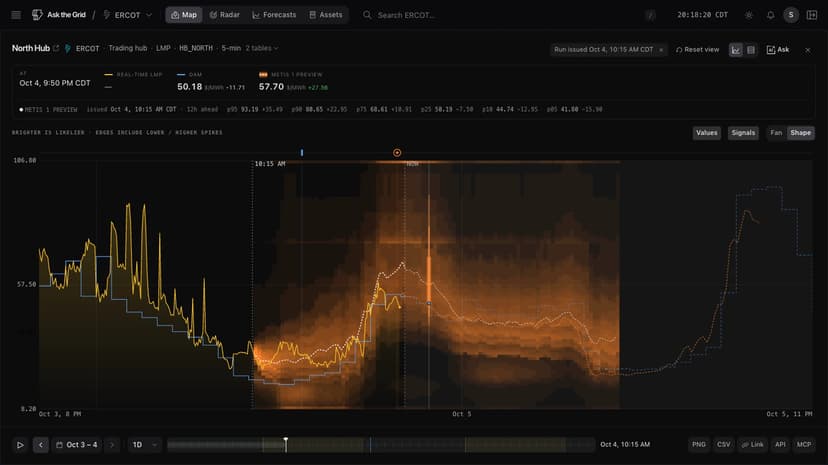
September 19, 2026 · Markets · 8 min
Probabilistic Forecasting in Energy: Reading a Missed Tail
What quantiles mean, how to score them, and what a real miss looks like: an archived ERCOT price forecast whose outcome landed 2.5× above its p95.
Read the essay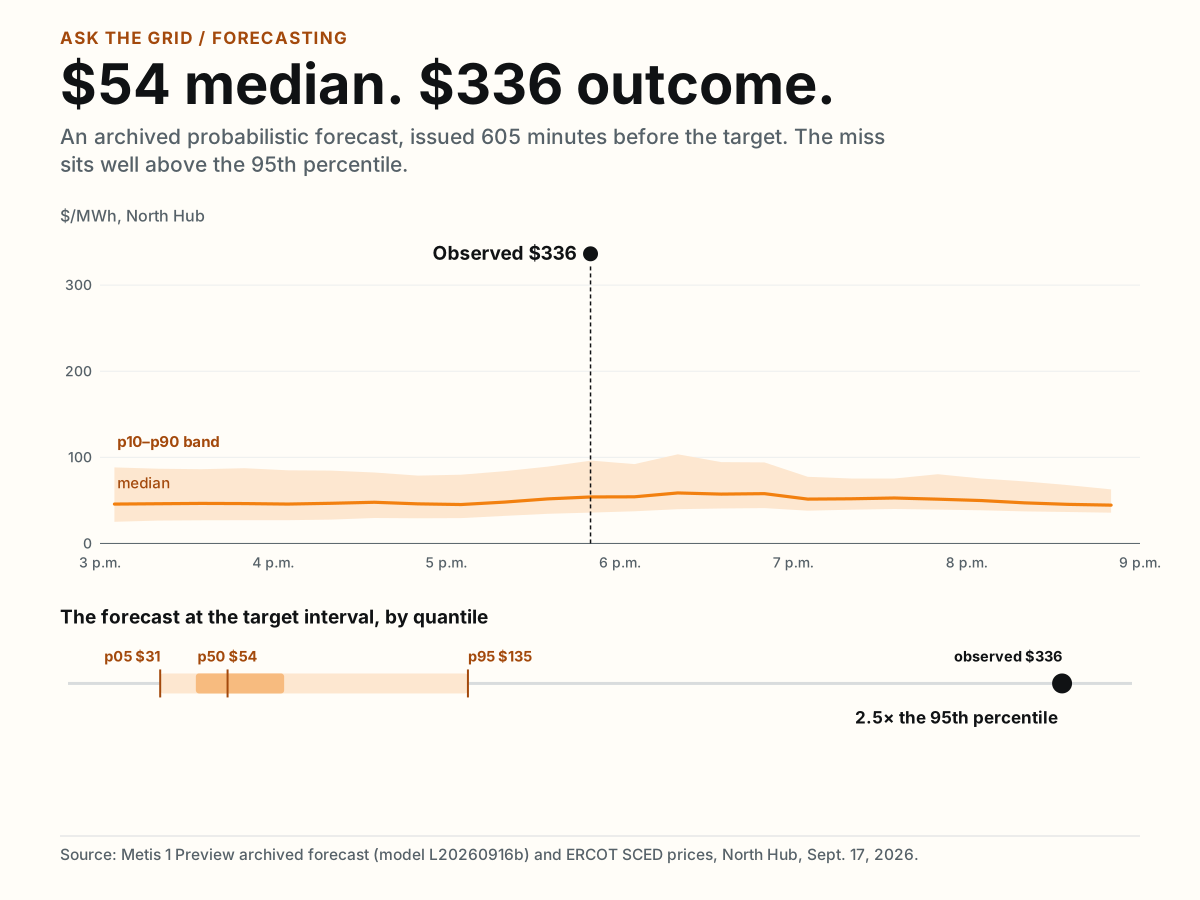
August 29, 2026 · Grid · 9 min
Neural Network Power Flow Solvers: Speed After Correction
CANOS, GridSFM and GENCO are fast on a prediction and slower once corrected. What each paper shows about AC power flow and optimal power flow.
Read the essay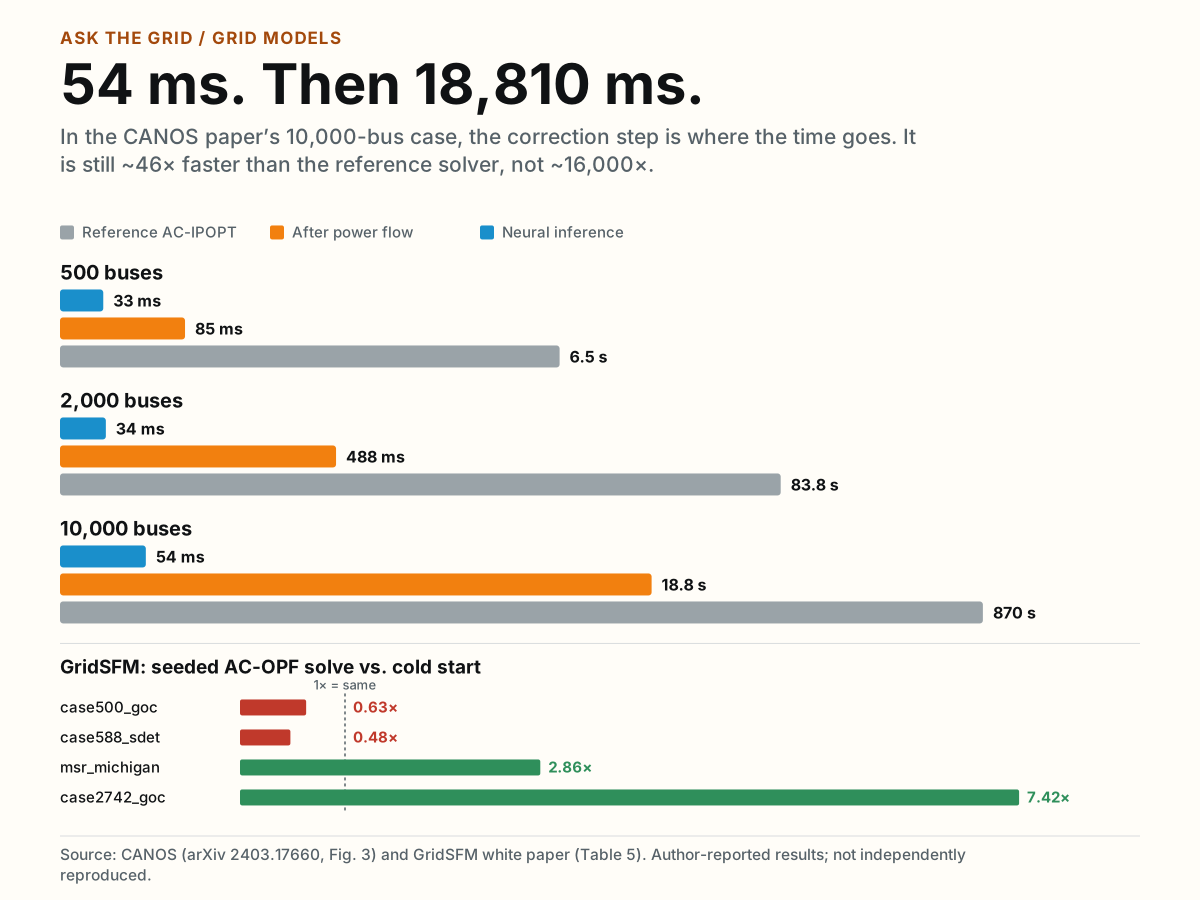
August 12, 2026 · Grid · 5 min
US Power Grid Map: The Electricity Network From Orbit
74,190 transmission line records, 19,762 substations and 13,640 power plants, rendered as one orbital image of the contiguous US grid. Free high-resolution download.
View and download
July 26, 2026 · Platform · 7 min
ERCOT Interconnection Queue Near Data Centers: West Texas
Pecos city is in Reeves County, not Pecos County. A West Texas case shows how to read the ERCOT generation queue without confusing it with data-center load.
Read the essay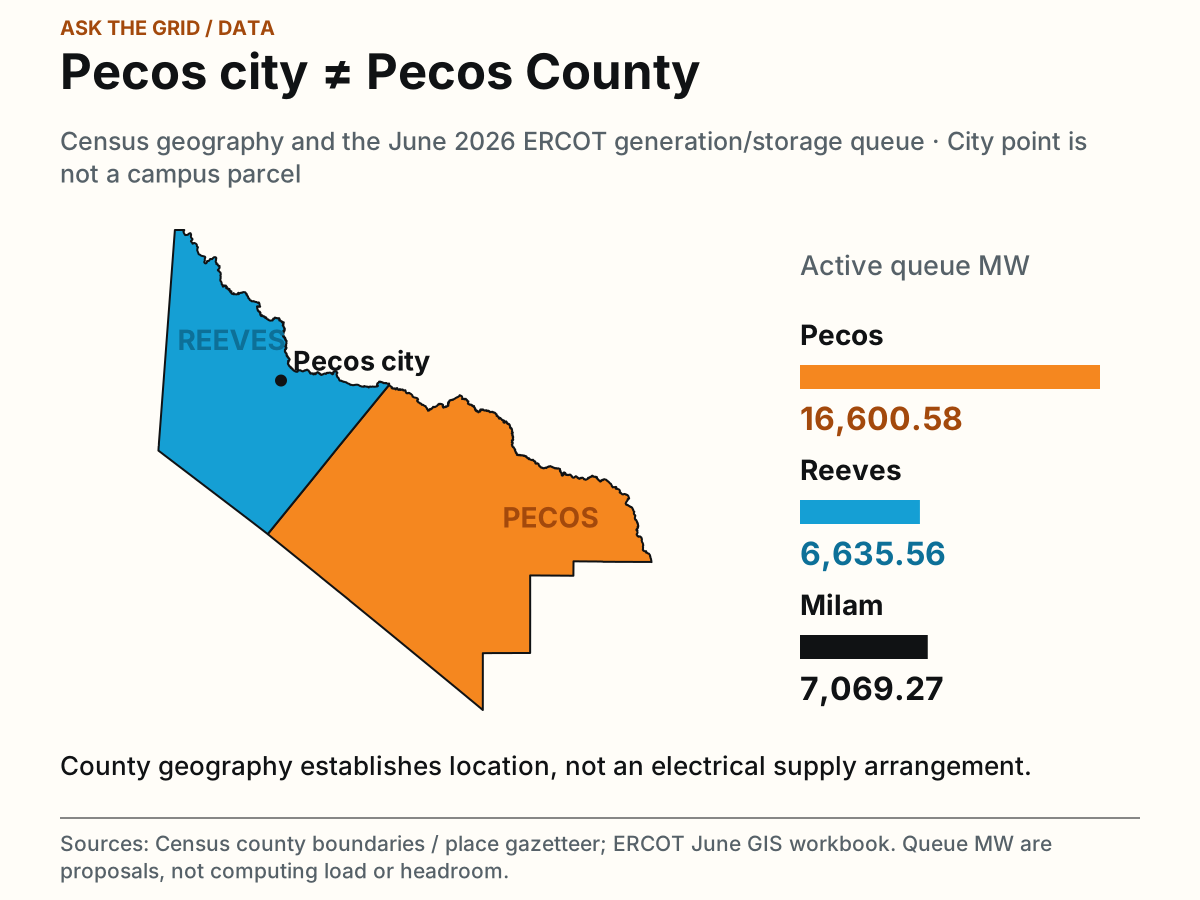
July 23, 2026 · Platform · 7 min
How an AI Agent Answers a Grid Question: A Real Trace
A catalog-to-query trace behind an ERCOT price comparison: the dataset, the time semantics, the returned rows and the failures an agent has to keep visible.
Read the essay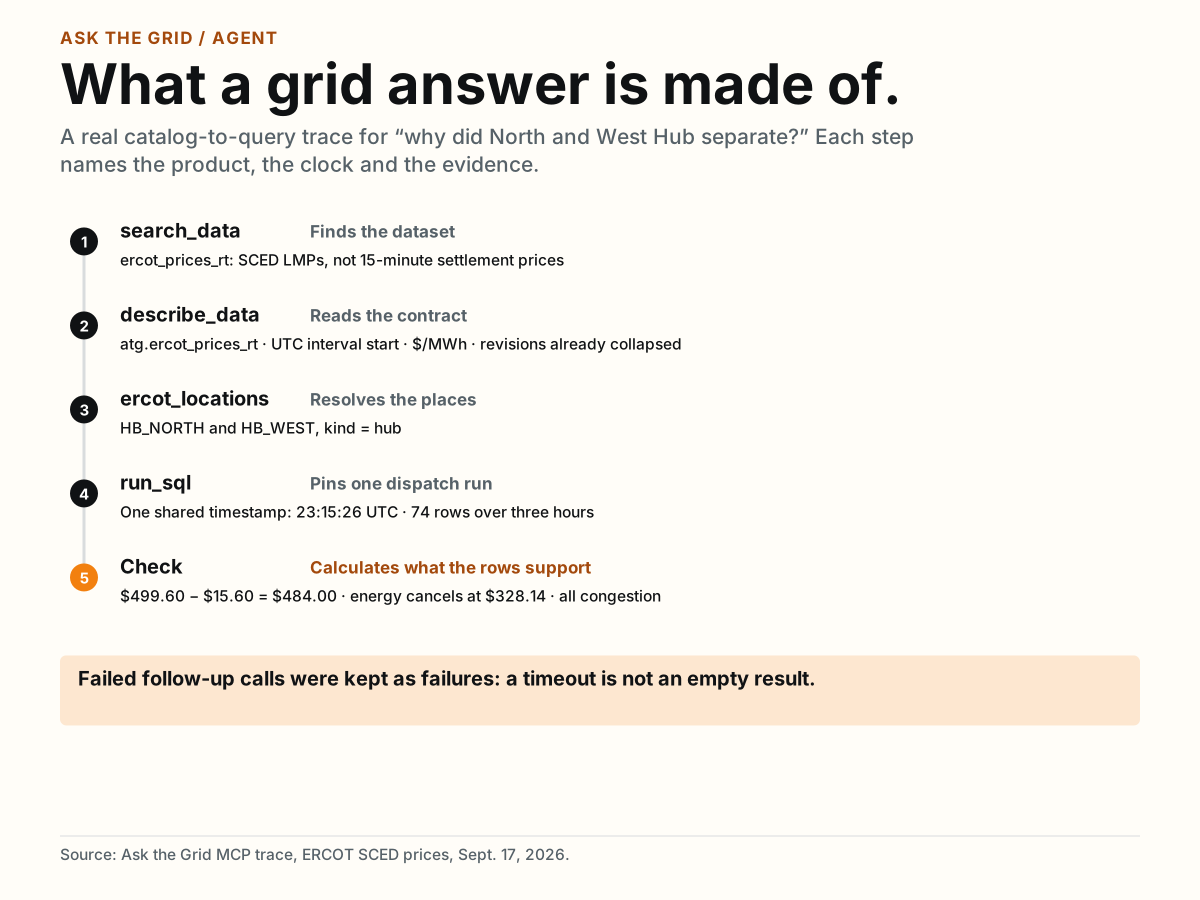
July 16, 2026 · Markets · 8 min
Transmission Congestion in ERCOT: A $484/MWh Price Split
At 6:15 p.m. on September 17, 2026, ERCOT’s North and West hubs were $484/MWh apart. Price components, named constraints and a dated estimate show why.
Read the essay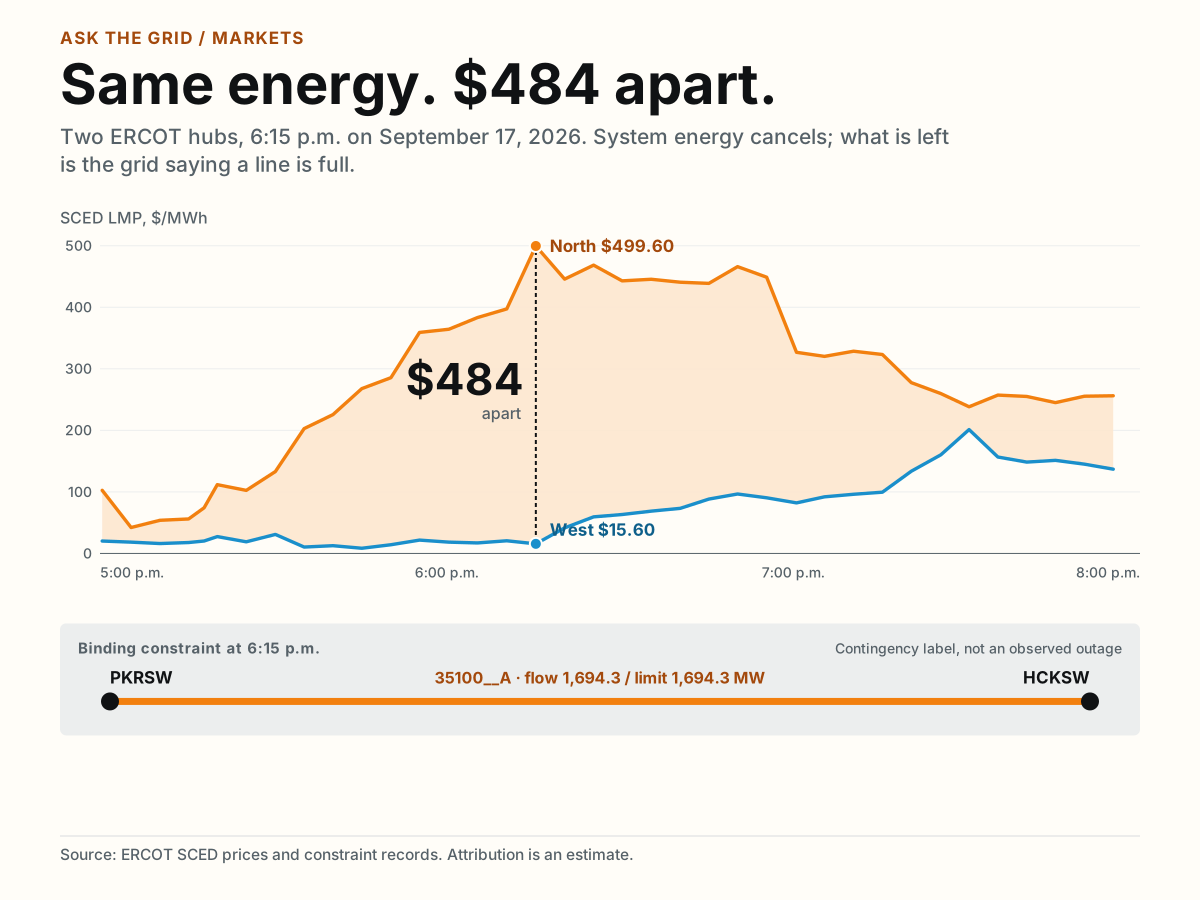
July 9, 2026 · Platform · 6 min
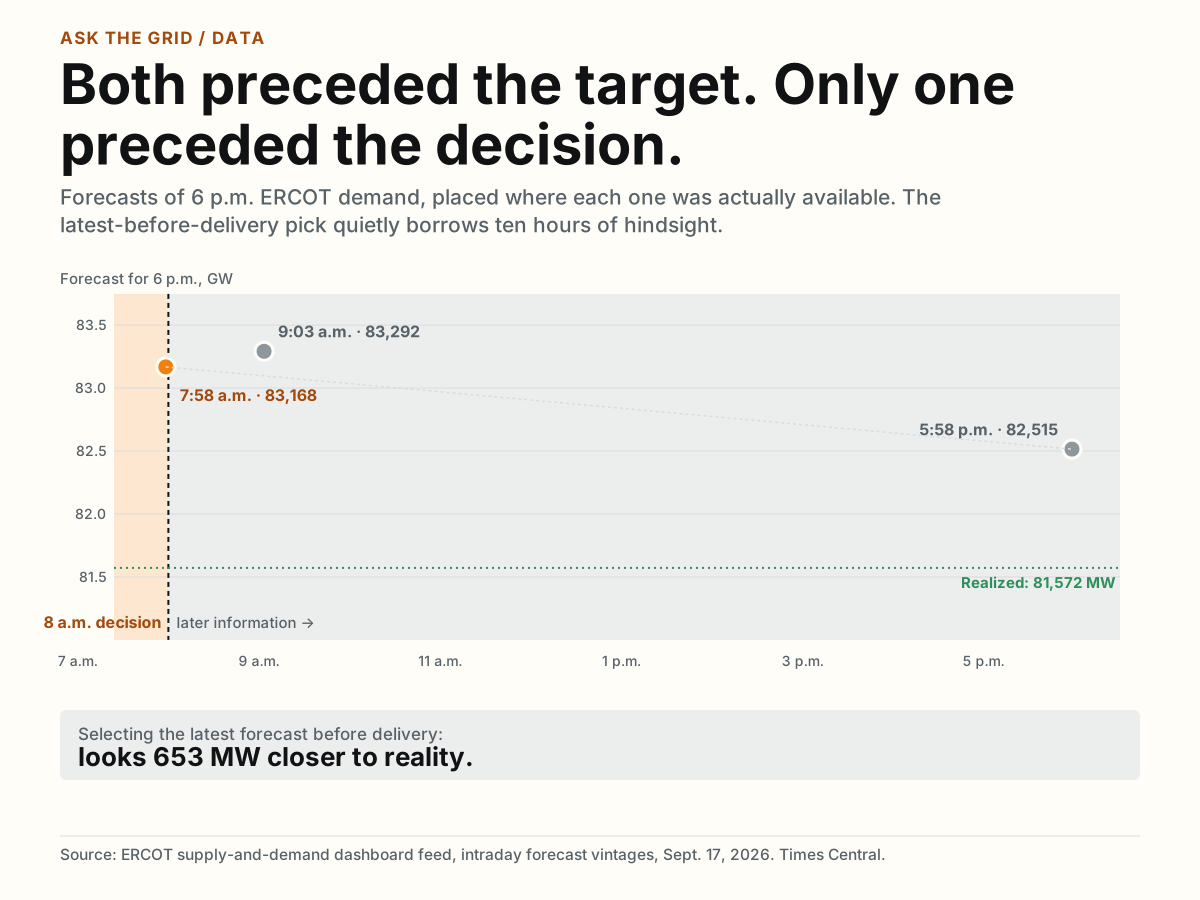
Forecast Vintages: Why Backtests Need a Decision Time
The last forecast before delivery is not the forecast you had when you decided. ERCOT demand vintages show a 653 MW gap from using later information.
Read the essay