ERCOT grid events and operating notices
Read recent ERCOT operating events and market notices, newest first. Check each posting’s time and source, then open the grid map to investigate the available location context.
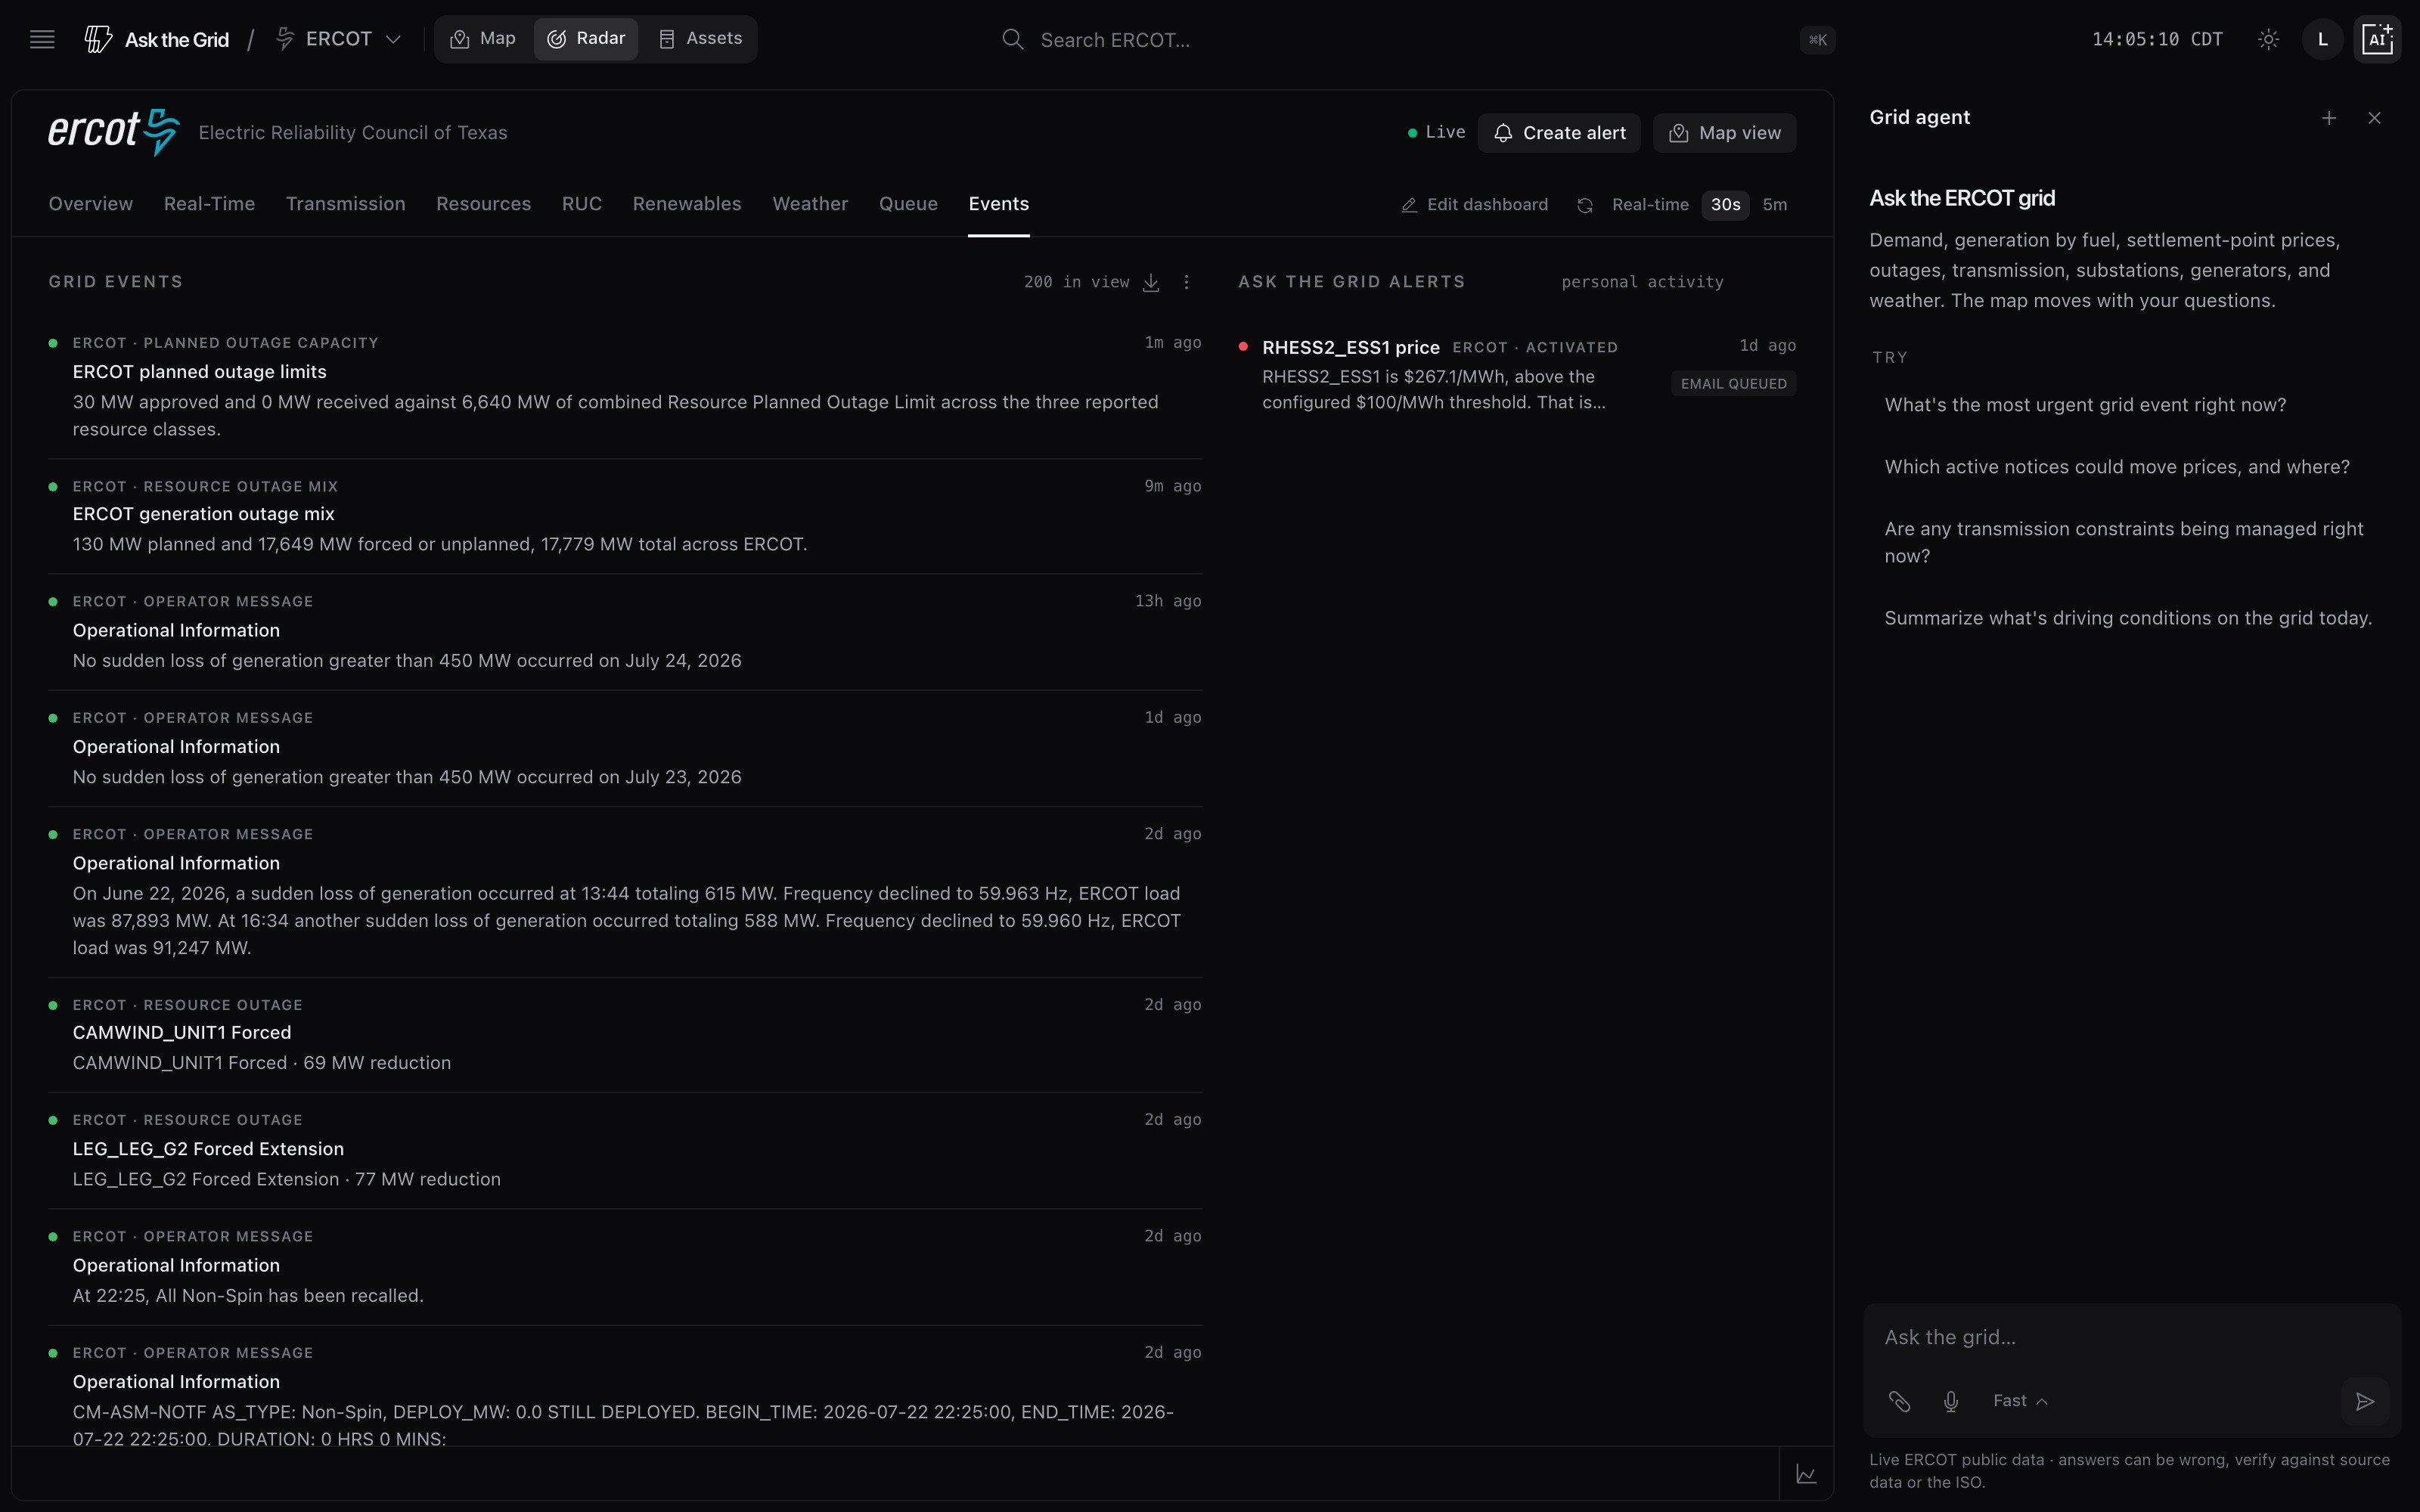
See it on the live ERCOT map, updating as the market publishes.
Explore ERCOT grid events on the mapAbout this view
What this View shows
Normalized operating events and market notices from ERCOT — weather watches, reliability advisories, market and operations notices — each with its scope, category, severity, and the time window it's valid for.
Why it matters
A price spike, an outage cluster, or unusual generation behavior usually has a published event or notice behind it. Reading events next to live prices, outages, and generation is a faster route to a source-backed explanation than any of those layers alone.
Questions
Where do these events come from?
They're normalized from ERCOT's own published operating events and market notices. Each row keeps its original category, severity, and validity window rather than reinterpreting what ERCOT reported.
What does severity mean here?
Severity levels (info, watch, warning, emergency) reflect how the source or a stated rule classified the event, not an independent Ask the Grid judgment call.
Does an event confirm a specific outage or price move?
Not by itself. Treat an event as the operator's own account of what's happening; verify a specific outage or price claim against the outage and price Views directly.
Will the map open with these layers?
Yes. It carries the same layers, filters, viewport, and timeline state shown on this page into the live ERCOT workspace.