Node vs. hub prices: why a $60 hedge can leave a project earning $40
A worked basis-risk example for renewable-project developers and investment analysts evaluating a hub-settled hedge.
October 14, 20266 min read
A renewable project has a $60/MWh hub hedge. In a hypothetical delivery period, it generates 100 MWh, fulfills the hedge’s volume exactly, and earns only $40/MWh across the energy sale and hedge. Nothing in the hedge calculation has failed. The project’s node traded $20/MWh below the hub.
That gap matters when you turn a term sheet into a revenue assumption. A node is the project’s local electricity pricing point. A hub is a trading reference made from a defined collection of locations. A contract tied to the hub can leave the developer exposed to the price at the plant.
For an investment analyst, the practical question is who carries that difference and how large it becomes when the project generates. Start with the matched-volume example below. Then follow the same exposure through a production-weighted comparison and the contract questions it should trigger.
What does the hub hedge leave exposed?
Generate 100 MWh at the node. Receive $60/MWh fixed and pay the hub price on the same volume.
The location exposure that remains
$30 − ($50) = -$20
Node-minus-hub basis, per MWh
Energy + hedge, for 100 MWh
$4,000
Realized $40/MWh = $60 fixed + -$20/MWh basis. The hub hedge leaves the location difference with the project.
Hypothetical matched-volume hedge. Same market and delivery period; excludes other revenues, charges, and costs.
In this article · 5 sections
01
Follow the physical sale and the financial hedge
Assume the project sells 100 MWh at its node for $30/MWh, earning $3,000. Separately, a simplified financial hedge pays the project a fixed $60/MWh and requires it to pay the hub price on the same 100 MWh. The hub price is $50/MWh, so the hedge pays 100 × ($60 − $50) = $1,000.
Combined revenue is $4,000: $3,000 from energy and $1,000 from the hedge. Divide by 100 MWh and the realized value is $40/MWh, before costs and other revenues. The fixed price in the contract is one input into project revenue.
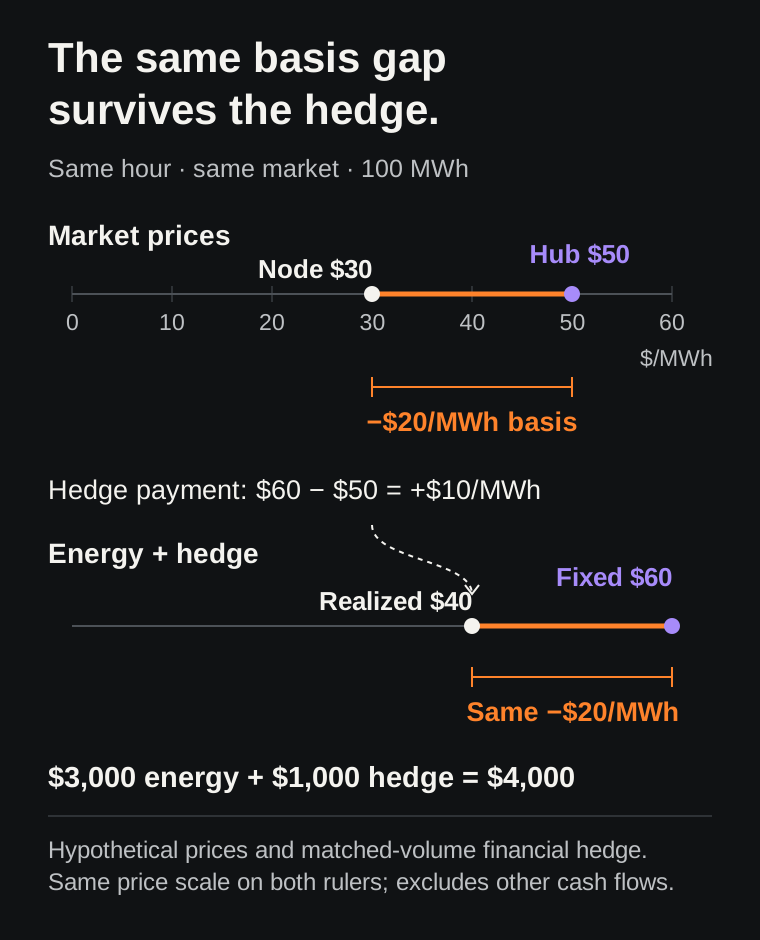
Define basis here as node price minus hub price, using the same market and delivery interval. It is −$20/MWh in this example. With matched volumes, combined revenue per MWh equals the fixed hedge price plus basis: $60 + (−$20) = $40. The interactive example uses that identity; move the node price while holding the hub unchanged.
02
The hub and the plant answer different pricing questions
A hub makes a useful trading reference because it combines a defined set of pricing locations. ISO New England’s explanation describes its Hub and how transmission constraints and losses can cause prices to differ across the system. Hub definitions and settlement rules vary by market.
The physical point matters because electricity cannot always move freely from one part of the network to another. A location with abundant generation and limited export capability can have a lower price than a trading hub. A total price difference alone, however, does not identify the line or outage responsible.
For a proposed project, resolve the commercial settlement identifier before collecting a price history. The nearest dot on a map may represent another pricing location. If the project has no operating history, record how the selected node and production profile represent the proposed connection. A nearby operating plant is a proxy with its own limitations.
03
A −$10 average can become −$26 when the plant produces
Consider two hypothetical hours. Basis is −$30/MWh in the first and +$10/MWh in the second. The simple average is −$10/MWh. But the project generates 90 MWh in the unfavorable hour and only 10 MWh in the favorable one.
The first hour contributes −$2,700 of location exposure; the second recovers $100. Across 100 MWh, the net is −$2,600, or −$26/MWh. Weighting each price difference by actual output changes the answer by $16/MWh.
If the same $60 hedge applies to exactly the energy produced in these hours, combined energy and hedge revenue is $3,400, or $34/MWh. Using the simple −$10 average would imply $5,000. That $1,600 gap comes entirely from ignoring when production occurs.
This calculation is generation-weighted basis: sum output × (node − hub) across matching intervals, then divide by total output. For an operating asset, use metered output. For a proposed asset, label modeled production and keep the weather period aligned with the price history.
| Hour | Node − hub | Production | Basis contribution |
|---|---|---|---|
| First | −$30/MWh | 90 MWh | −$2,700 |
| Second | +$10/MWh | 10 MWh | +$100 |
| Total | −$26/MWh weighted | 100 MWh | −$2,600 |
04
Read the volume rule before using the shortcut
The identity above assumes the physical sale and financial hedge cover the same quantity. A fixed-volume hedge can behave differently. Suppose the project produces 60 MWh at the $30 node but the hedge still settles 100 MWh against the $50 hub. The physical sale earns $1,800 and the hedge pays $1,000, for $2,800 combined.
You cannot apply the matched-volume $40/MWh result to those 60 MWh and obtain the correct answer. The hedge quantity has stayed at 100 MWh. Inspect whether the agreement settles a fixed hourly block, measured production, or another quantity, and how it treats curtailment and shortfalls.
Market timing is another separate exposure. A day-ahead hub reference against real-time nodal revenue combines location and timing differences. The day-ahead and real-time example explains how to reconstruct the quantity adjustment. First compare node and hub within the same market to isolate location basis.
A transmission hedge also needs to match the exposure. PJM financial transmission rights reference day-ahead hourly congestion differences on a defined path. That scope is narrower than every difference between a project’s total realized price and its contractual reference.
05
Turn the result into a better project review
Before putting $60/MWh into the investment model, write down the physical settlement point, the contractual hub, the market timing, and the hedge volume rule. Have the commercial team confirm who bears the resulting basis under the actual agreement. A quoted fixed price is too little information to establish realized revenue.
Then build the interval comparison. Calculate generation-weighted basis, inspect the days contributing most to the dollar result, and identify gaps in prices or output. Compare multiple periods and explain material network or operating changes; a historical average is an observation about those periods, not a forecast of future congestion.
Use Ask the Grid’s market locations to orient the node-and-hub comparison, then preserve the originating price series and the production assumptions behind the result. The deliverable for the project review is a bridge from contract price to modeled revenue, with the remaining location and quantity exposures visible.