Battery arbitrage: turning an $80 price spread into a credible revenue estimate
A worked 50 MW / 100 MWh battery example for investment analysts: account for charging losses, available hours, price-spike duration, and costs.
October 14, 20266 min read
A battery investment presentation shows electricity at $20/MWh overnight and $100/MWh in the evening. For a 100 MWh battery, multiplying the $80 spread by its energy capacity suggests $8,000 per cycle. Under the hypothetical operating assumptions below, the energy trading margin is $7,500—and capturing even that amount requires enough time to charge.
The gap is a useful screening exercise for a storage investment analyst. A spread chart identifies a possible opportunity. A revenue estimate must show how a particular battery could buy energy, store it, and deliver it in sequence.
Use a 50 MW battery with 100 MWh of usable AC discharge energy, a 50 MW charging limit, and 80% AC-to-AC round-trip efficiency. Prices are assumed constant within each window. Change the inputs below, then follow the operating schedule to see what the margin requires.
Turn a spread into a battery cycle.
Deliver 100 MWh. Change prices and efficiency to see the charging energy and margin.
Bought → delivered
125 → 100 MWh
Energy trading margin
$7,500
125 MWh bought at $20/MWh. Enough charging time is assumed; margin is before other costs.
Hypothetical AC energy cycle with enough charging time. Margin excludes other revenues, charges, and costs.
In this article · 5 sections
01
The battery has to buy 125 MWh to sell 100 MWh
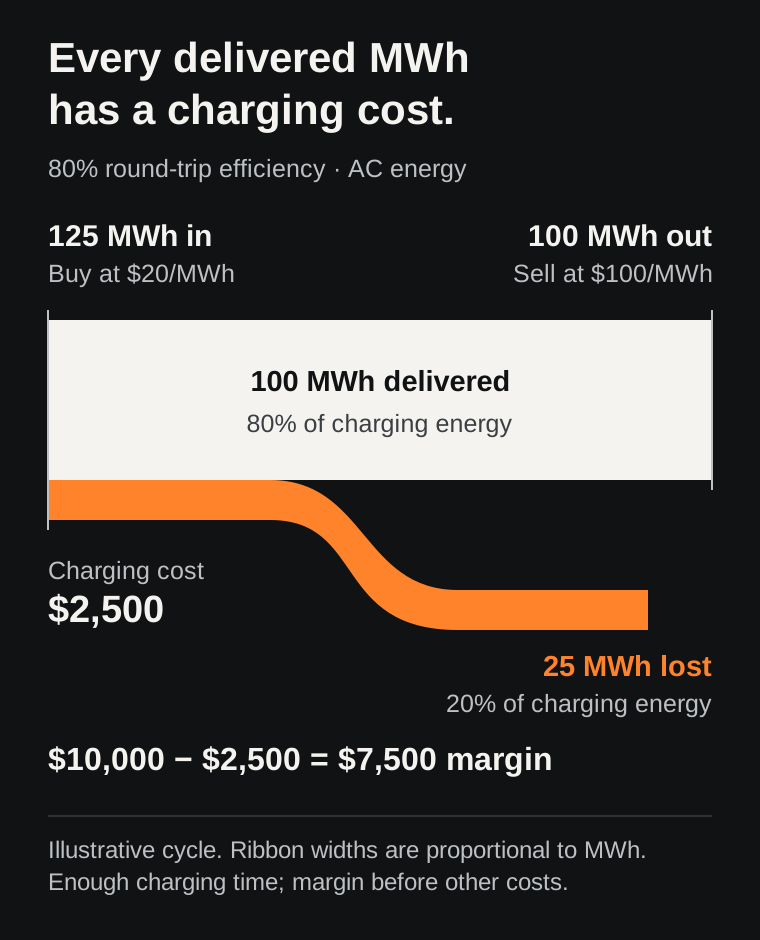
At 80% round-trip efficiency, 100 MWh of discharged energy requires 125 MWh of charging energy: 100 ÷ 0.80. Buying that energy at $20/MWh costs $2,500. Selling 100 MWh at $100/MWh earns $10,000. The difference is a $7,500 energy trading margin, before other costs and revenues.
The simple spread calculation understated charging purchases by 25 MWh. At $20/MWh that costs $500, which explains the gap between $8,000 and $7,500. In this example, the 25 MWh loss is 20% of input energy; the purchased quantity is 25% larger than the delivered quantity.
The EIA defines round-trip efficiency as energy discharged relative to energy charged. Our 80% is an explicit teaching assumption, not an estimate for a proposed project. Use the project’s documented efficiency and a consistent metering boundary, including the specified treatment of auxiliary consumption.
02
Write down a schedule that can actually deliver the margin
Assume the battery begins with no usable stored energy. It charges at 50 MW from midnight to 2:30 a.m., buying 125 MWh at $20/MWh. It holds that energy through the day and discharges at 50 MW from 6 to 8 p.m., selling 100 MWh at $100/MWh. It ends with the same usable energy it started with. Times are hypothetical local operating times on a day without a clock change.
This simplified AC energy budget assigns the cycle’s losses through round-trip efficiency. A detailed dispatch model would represent charging and discharging efficiencies, stored-energy limits, and auxiliary load separately. The budget is enough to test whether the quoted charging and discharge windows contain sufficient energy.
Now shorten the cheap charging window to two hours. The battery can buy only 100 MWh through a 50 MW import limit. At the assumed efficiency, that supports 80 MWh of discharge. Selling all 80 MWh at $100/MWh earns $8,000 against a $2,000 purchase: the energy margin falls to $6,000.
The spread is still $80/MWh. The available operating window changed. An analyst should ask for the schedule behind the claimed cycle, including the starting inventory and the power limits in each direction.
| Operating step | Full cycle | Only two cheap hours |
|---|---|---|
| Charge at 50 MW | 2.5 hours; 125 MWh | 2 hours; 100 MWh |
| Deliver at 80% efficiency | 100 MWh | 80 MWh |
| Sell at $100/MWh | $10,000 | $8,000 |
| Buy at $20/MWh | $2,500 | $2,000 |
| Energy trading margin | $7,500 | $6,000 |
03
A 15-minute spike cannot sell two hours of energy
Next, replace the two-hour evening window with one 15-minute interval at $1,000/MWh. The 50 MW discharge limit allows a maximum sale of 12.5 MWh in that interval: 50 MW × 0.25 hours. Gross discharge revenue is $12,500, assuming the battery has sufficient energy and can operate as assumed.
Multiplying $1,000/MWh by the battery’s full 100 MWh would report $100,000. To deliver that energy at 50 MW, the price would have to persist for two hours. The price peak and the usable duration belong in the same calculation.
If the battery had charged fully beforehand, it would retain energy after the spike. Value that remaining inventory consistently when comparing schedules. A case that sells stored energy and a case that retains it have different ending positions.
The order of the windows matters too. A cheap price after the spike cannot supply energy sold earlier. A schedule using it needs earlier inventory or another purchase, and that purchase belongs in the economics.
04
Separate a hindsight benchmark from a bidding strategy
A schedule built from completed prices knows exactly when the spike occurred. A bidding strategy must use information available when the operator makes a commitment. Ask whether the revenue case selects the best realized hours after the day ends, or simulates decisions using forecasts available at the relevant deadlines.
Perfect foresight can be a useful benchmark within a stated model, but its constraints still need to be physical. Enforce power limits and energy balances, and use the same starting and ending inventory across comparisons. Selecting high and low prices without those checks does not produce a feasible benchmark.
Location belongs in this review. A regional hub’s price window may differ from the battery’s settlement point. Compare the asset’s own synchronized price series; node-to-hub basis explains how a location difference can survive a financial hedge. For day-ahead and real-time positions, account for their separate settlement cash flows.
Energy and ancillary-service commitments also share the battery’s capability. A revenue case that independently assigns the full power and energy to each service can count the same flexibility twice. The combined schedule should show what is reserved and what remains available.
05
Ask for the revenue bridge, not just the spread chart
Apply an illustrative $10 cost per discharged MWh to the full cycle. At 100 MWh, that subtracts $1,000 and reduces the $7,500 energy margin to $6,500. This is a sensitivity input, not a degradation-cost benchmark. Replace it with the project’s documented assumptions and avoid counting the same cost twice.
An investment case then needs its own treatment of availability, augmentation, fixed operations, financing, and other revenues. One cycle’s margin cannot be annualized simply by multiplying by 365: first establish how often the price sequence occurs and how the strategy responds to it.
The useful follow-up to an $80 spread slide is a request for the interval schedule and revenue bridge: energy purchased, energy sold, losses, price location, information available when bidding, costs, and ending inventory. Those records let you reproduce the claim and see which assumption contributes most to it.
You can use Ask the Grid’s asset directory to begin locating a battery and its grid context. The investment question remains specific to the asset: what operating sequence supports this revenue estimate?