ISO-NE LMP map: real-time prices by node
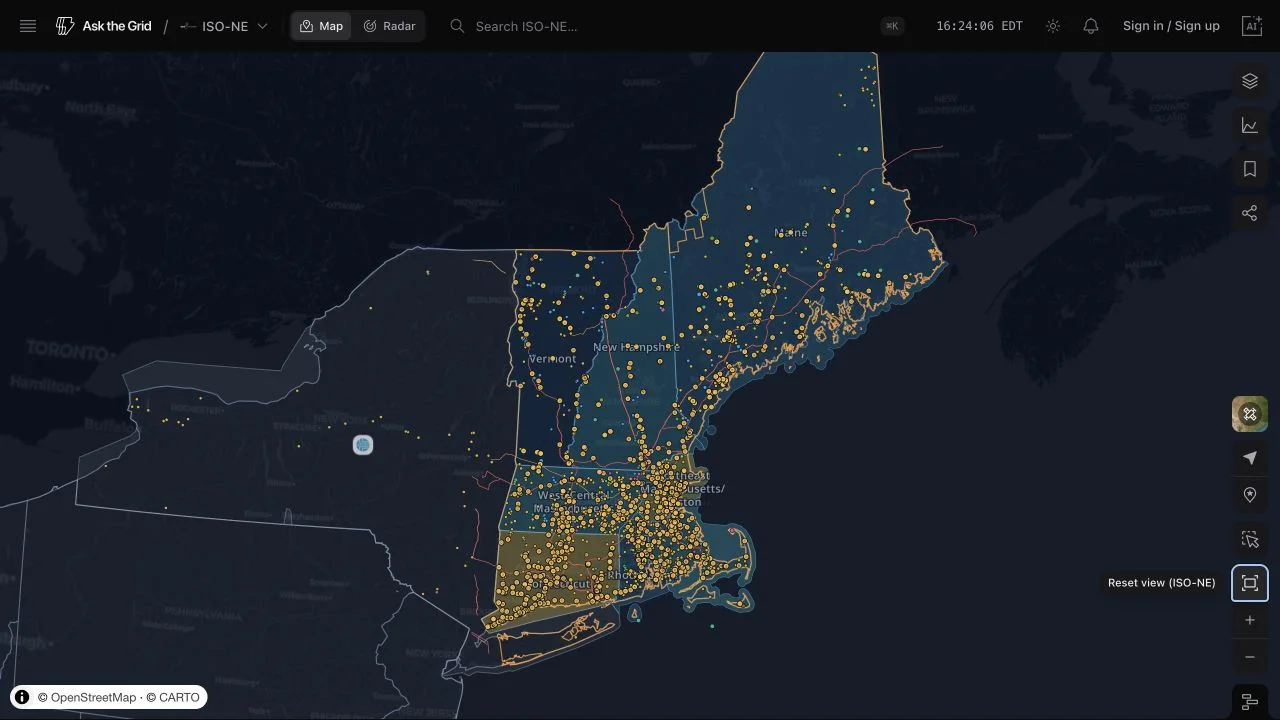
Every ISO New England pricing point currently reporting a real-time LMP, from Maine to Connecticut, ranked highest to lowest — then open the exact same live view on the map.
Every ISO New England pricing point currently reporting a real-time LMP, from Maine to Connecticut, ranked highest to lowest — then open the exact same live view on the map.
Highest-priced node
$26.86/MWh
4366
Nodes priced
1,148
ISO-NE real time
See it on the live ISO-NE map, updating as the market publishes.
Open in MapThis is ISO New England's live locational marginal price (LMP) at load zones, the Internal Hub, and generator nodes — the same 5-minute real-time feed the interactive map colors nodes with.
New England imports much of its winter energy over constrained gas and electric interfaces, so its prices separate sharply when pipelines and interties bind. Scanning current LMP across the eight load zones shows where the system is stressed right now — and how far zone prices are pulling away from the Internal Hub.
Real-time. This View shows ISO New England's live 5-minute real-time LMP, not the day-ahead market clearing price.
ISO-NE's Internal Hub is a reference price averaged over a set of central pricing nodes, used as the market's benchmark alongside the eight load zones. This table lists whichever pricing points the ISO is currently publishing, exactly as reported.
Not on its own. A high price can reflect system-wide scarcity, local congestion, or both — in New England, winter gas constraints move every zone at once. Compare nearby pricing points and check demand, generation, and outage context before concluding congestion drove one point's price.
Yes. It carries the same layers, filters, viewport, and timeline state shown on this page into the live ISO-NE workspace — the same save/restore system behind a personal saved view.
What Ask the Grid's detectors found in ISONE's published data over the last two weeks. A story that recurred is shown once, at its latest day.
Spread to a neighbor· on 15 days
ISONE's Internal Hub is at $82/MWh against $35/MWh at NYISO's zone average.
Price separation· on 2 days
Comparable real-time LMPs span −$33–$31/MWh across the market.
Price level· on 4 days
The latest live real-time reference LMP is $161/MWh.
Binding constraint
The published day-ahead constraint has a marginal value of −$133/MWh under contingency Actual, in the top 5% of what ISONE pays to hold a constraint.
Binding constraint· on 2 days
The published day-ahead constraint has a marginal value of −$135/MWh under contingency Generic Constraint, in the top 5% of what ISONE pays to hold a constraint.
Binding constraint· on 3 days
The published day-ahead constraint has a marginal value of −$120/MWh under contingency Generic Constraint, in the top 5% of what ISONE pays to hold a constraint.