Where are PJM prices highest right now?
Every PJM pricing node currently reporting a real-time price, ranked from highest to lowest — then open the exact same live view on the map.
Every PJM pricing node currently reporting a real-time price, ranked from highest to lowest — then open the exact same live view on the map.
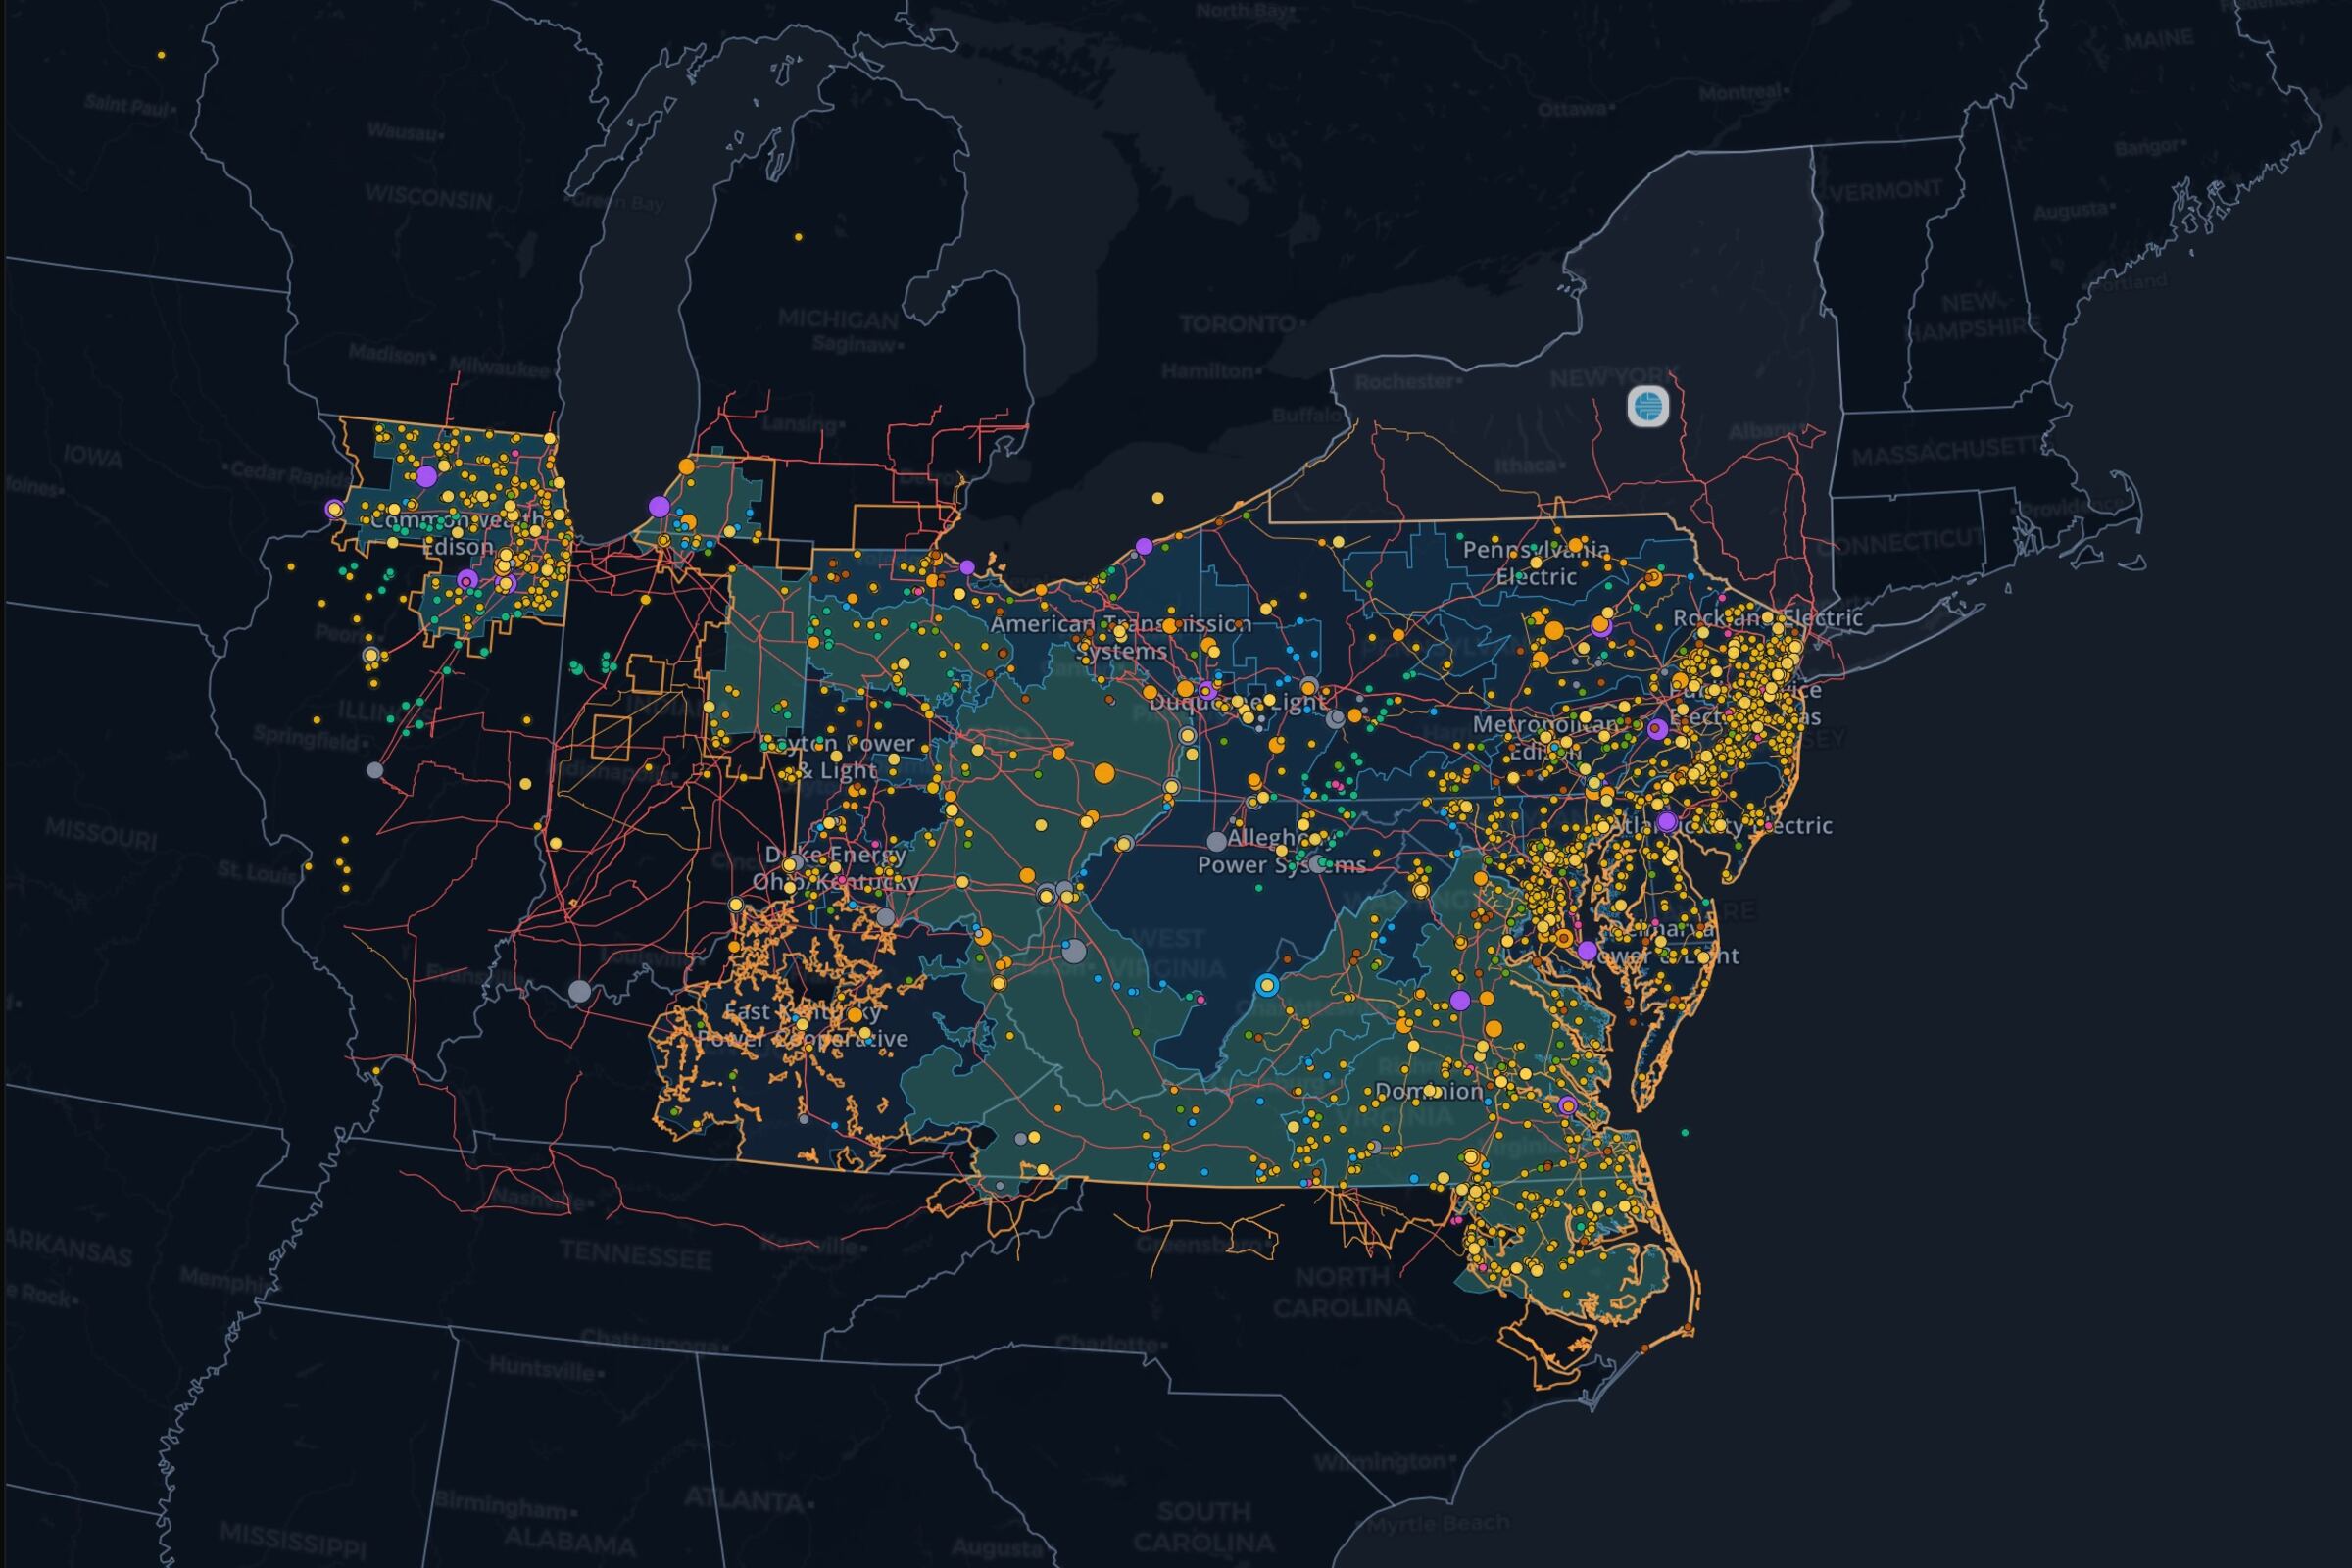
This is PJM's real-time locational marginal price (LMP) at pricing nodes, from the 5-minute unverified real-time feed — the same feed the interactive map colors nodes with.
PJM spans 13 states and DC, so price separation between pricing nodes often reflects transmission distance and congestion across a genuinely large footprint, not just local conditions. Scanning current nodal prices surfaces where that separation is showing up right now.
| Settlement point | Real-time LMP |
|---|---|
| EASTON | $296.03/MWh |
| PERRYMAN 1-2 | $39.42/MWh |
| PERRYMAN 3-4 | $39.42/MWh |
| PERRYMAN CT 4 | $39.42/MWh |
| PERRYMAN CT 51 | $39.42/MWh |
| PERRYMAN CT 3 | $39.42/MWh |
| PERRYMN6 PERYMAN6 | |
Real-time. This View shows PJM's 5-minute unverified real-time LMP, not the day-ahead market clearing price.
PJM prices individual pricing nodes across its 13-state-plus-DC footprint — generation, load, aggregate, and hub points. This table lists live-priced nodes exactly as PJM publishes them.
Not on its own. A high price can reflect system-wide scarcity, local congestion, or both. Compare nearby pricing nodes and check demand, generation, and outage context before concluding congestion specifically drove one node's price.
Showing the top 100 of 1,803 priced settlement points. Open the live map for the full, filterable view.
Yes. It carries the same layers, filters, viewport, and timeline state shown on this page into the live PJM workspace — the same save/restore system behind a personal saved view.