Where are CAISO prices highest right now?
Every CAISO pricing node currently reporting a real-time price, ranked from highest to lowest — then open the exact same live view on the map.
Every CAISO pricing node currently reporting a real-time price, ranked from highest to lowest — then open the exact same live view on the map.
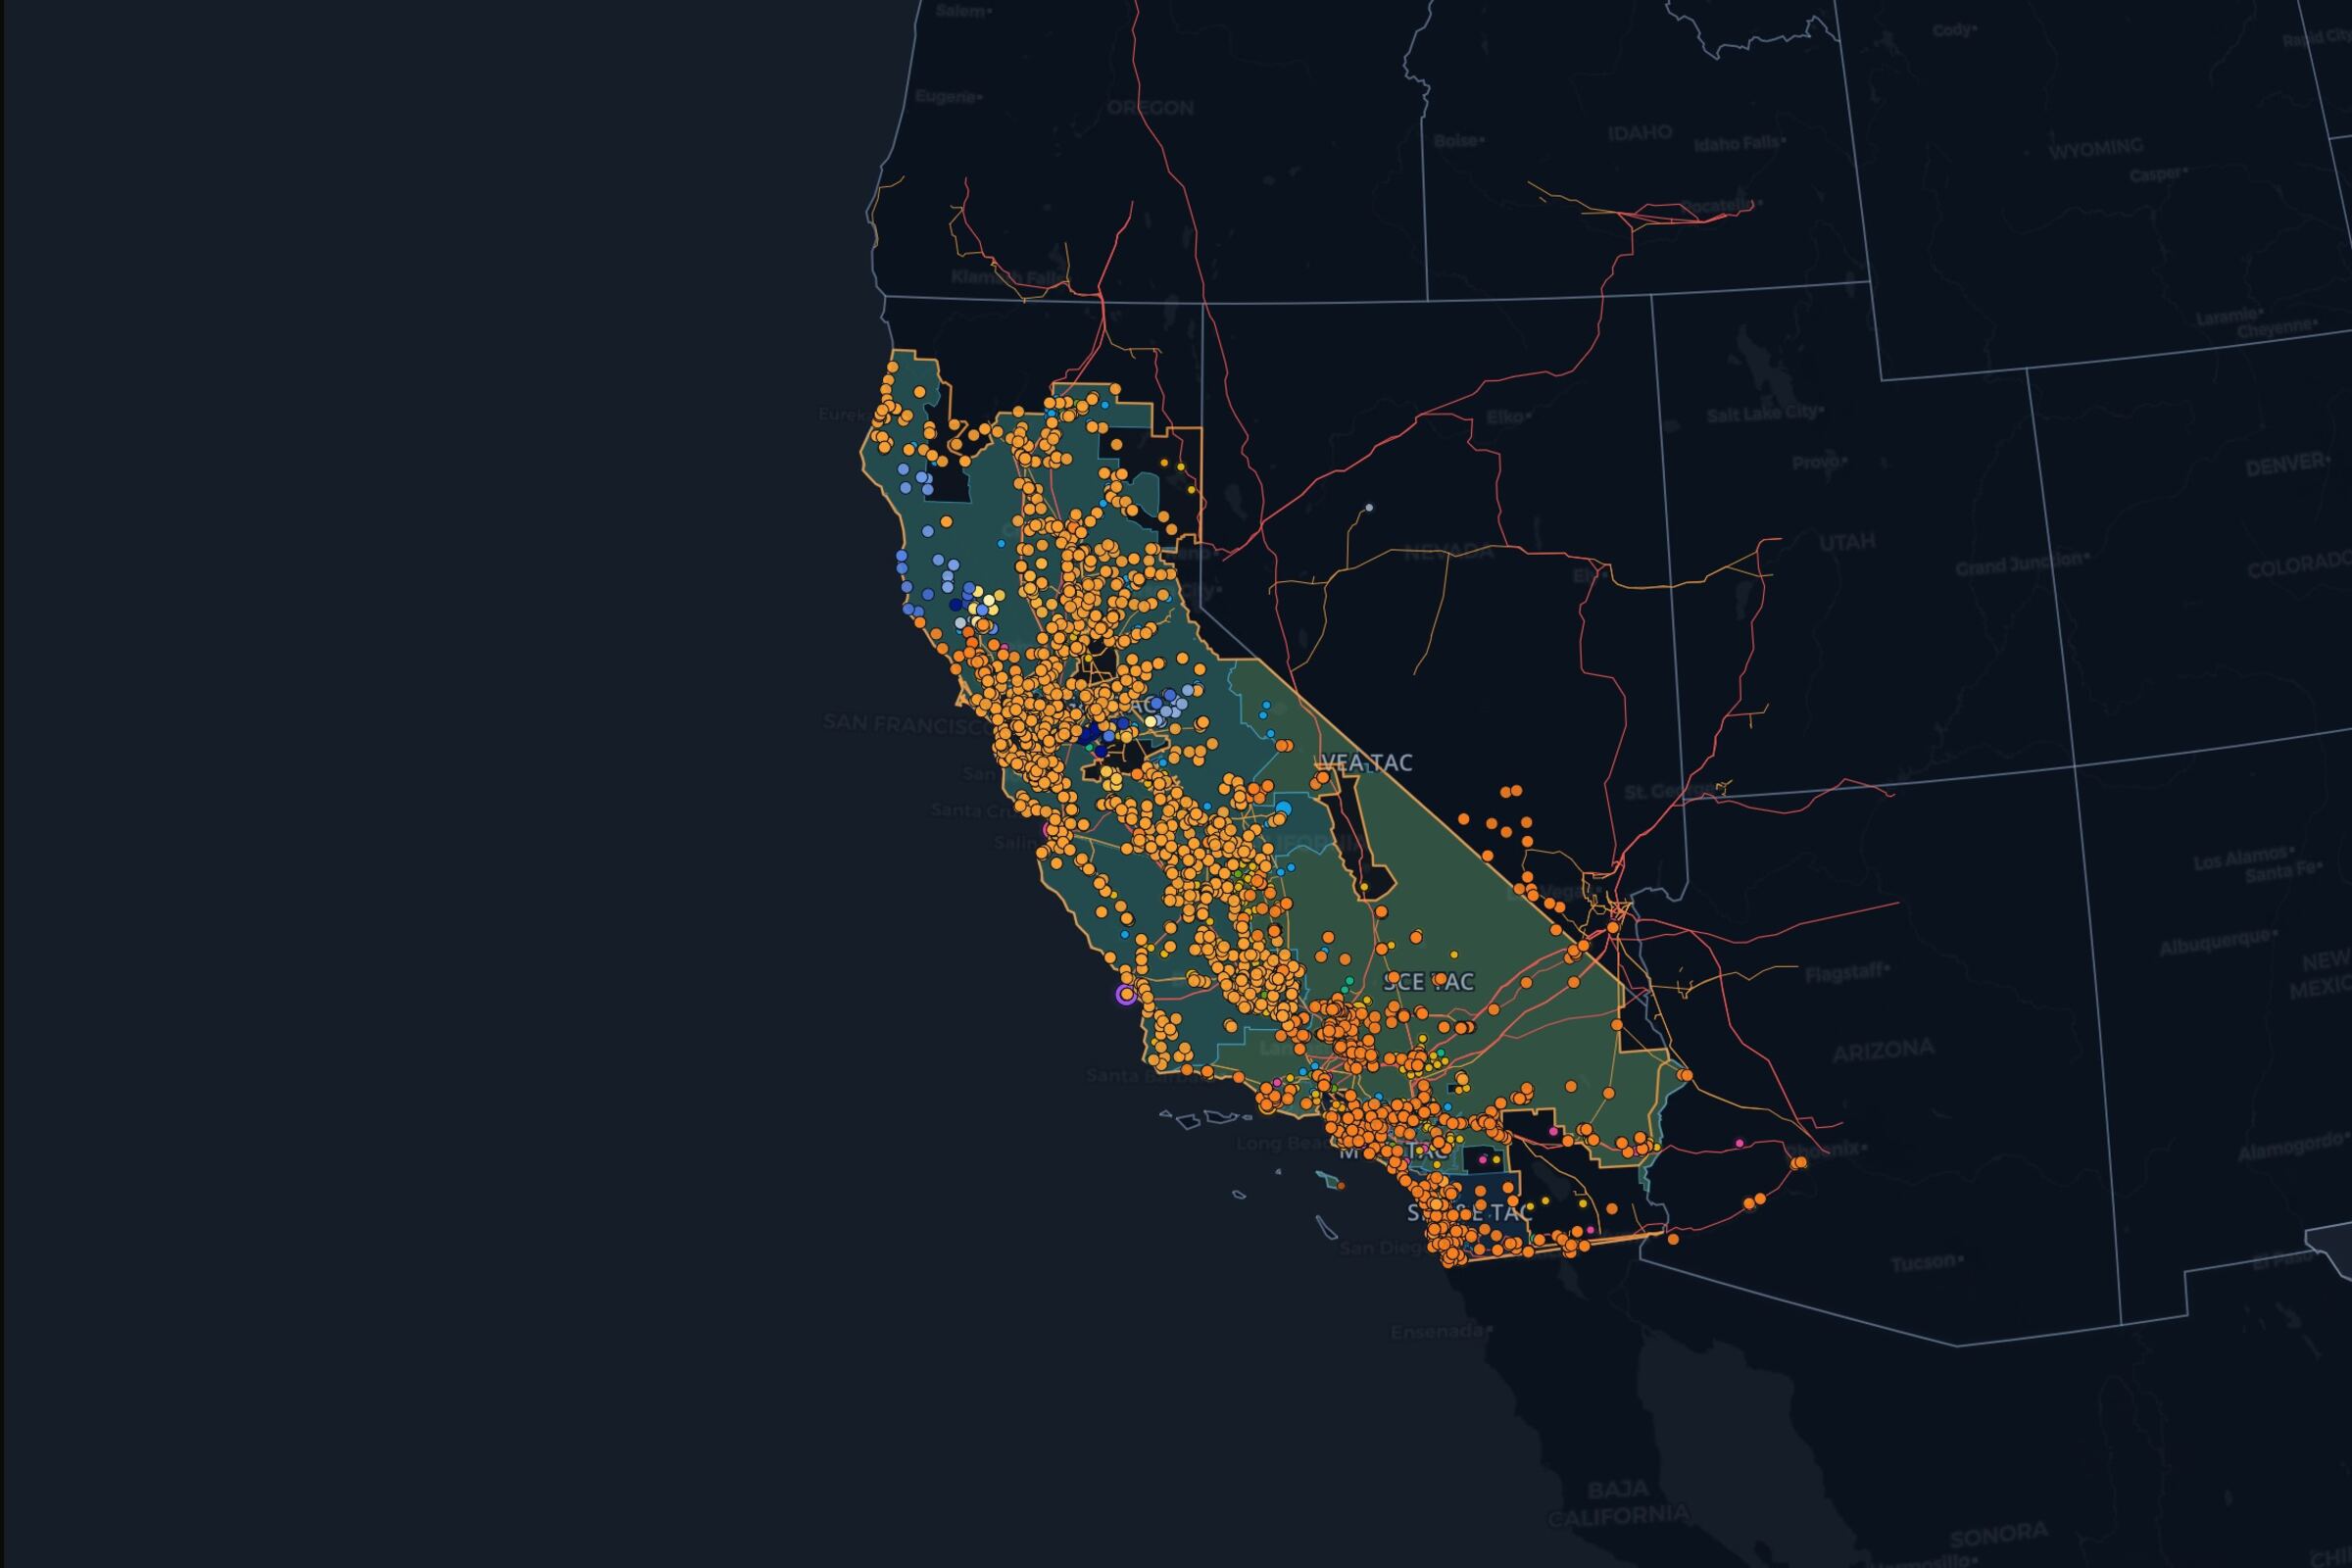
This is CAISO's real-time locational marginal price (LMP) at pricing nodes (PNodes), from the 15-minute Real-Time Pre-Dispatch (RTPD) market — the same feed the interactive map colors nodes with.
California's heavy solar penetration makes CAISO prices move fast and sometimes negative around midday, then spike as solar drops off in the evening ramp. Scanning current nodal prices surfaces where that ramp — or a transmission constraint — is showing up right now.
| Settlement point | Real-time LMP |
|---|---|
| FTCHMTN_6_N003 | $60.49/MWh |
| FTCHMTN_6_N001 | $60.49/MWh |
| GYSRVLLE_6_N001 | $60.43/MWh |
| GYSRVLLE_6_N005 | $60.43/MWh |
| GYSRVLLE_6_N003 | $60.43/MWh |
| HELDSBRG_6_N001 | $60.34/MWh |
| HELDSBRG_6_N009 | |
Real-time. This View shows CAISO's 15-minute Real-Time Pre-Dispatch (RTPD) LMP, not the day-ahead market clearing price.
CAISO prices individual pricing nodes (PNodes) — generation, load, and trading hub points. This table lists live-priced nodes exactly as CAISO publishes them.
Midday solar output can exceed what the system can use or export, pushing real-time prices toward or below zero. It's a real, published price — not a data error — and it's a distinctly CAISO pattern next to ERCOT, NYISO, or PJM.
Showing the top 100 of 14,784 priced settlement points. Open the live map for the full, filterable view.
Yes. It carries the same layers, filters, viewport, and timeline state shown on this page into the live CAISO workspace — the same save/restore system behind a personal saved view.