Where is MISO's interconnection queue asking to connect?
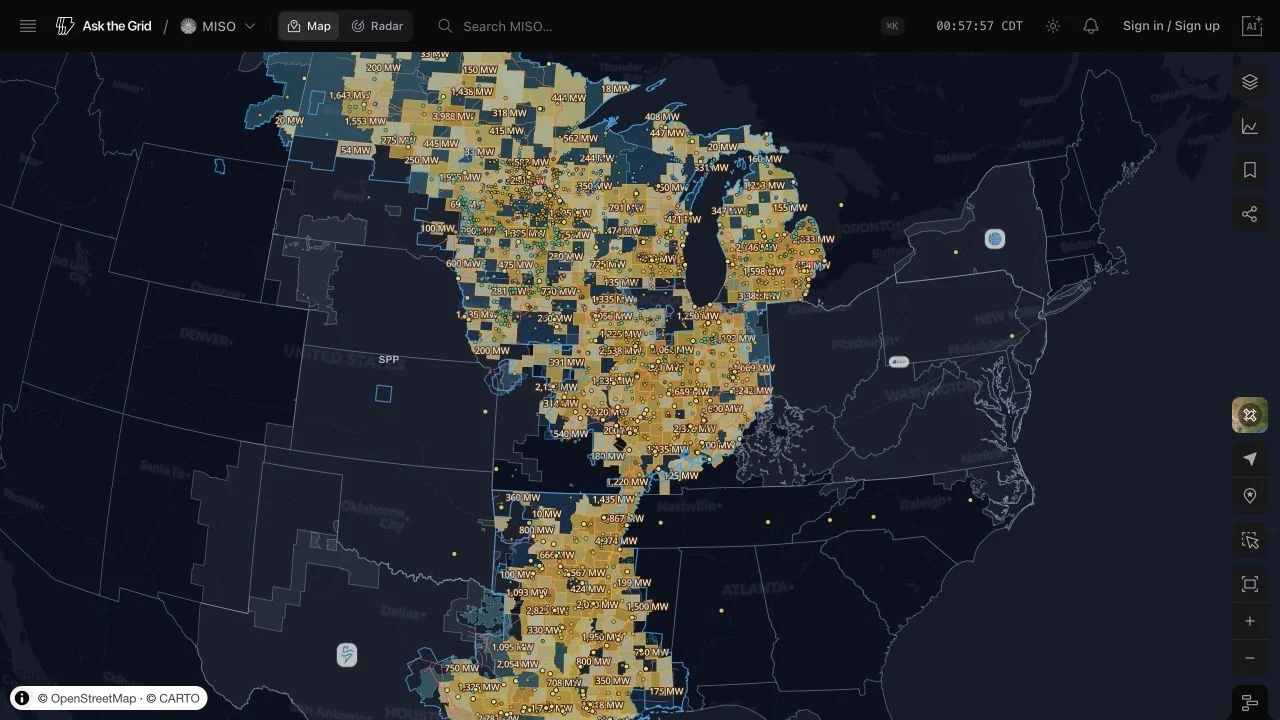
Every future generation and storage project MISO has published, from Manitoba to the Gulf, placed by county — then open the exact same live view on the map.
Every future generation and storage project MISO has published, from Manitoba to the Gulf, placed by county — then open the exact same live view on the map.
Projects in the queue
3,931
MISO's published queue
Largest request
2,220 MW
J3996
Published
Oct 12, 4:00 AM CDT
Latest queue report
| Project | Technology | Capacity |
|---|---|---|
| J3996J3996 | gas | 2,220 MW |
| J4241J4241 | other | 2,220 MW |
| J4256J4256 | ||
See it on the live MISO map, updating as the market publishes.
Open in MapThis is Ask the Grid's mirror of MISO's official generator interconnection queue — every wind, solar, battery, and gas project that has requested interconnection across the market, joined to its county with the operator's own status and proposed completion date.
MISO's queue concentrates the Midwest's wind and solar build-out, and its cycle-based study process makes the county-level picture move in waves. Reading it by county and technology shows where each wave of development interest is actually landing.
No. Queue capacity is the amount a project has requested to interconnect. It is not installed, operating, or likely-to-complete capacity, and it does not establish available transmission headroom.
MISO's official generator interconnection queue publication. Ask the Grid mirrors each release and stamps when the operator published it, so every row is attributable to a specific MISO publication.
The public queue does not publish exact project geometry, so projects are joined to counties and map interactions are placed at county level. A named point of interconnection is location evidence, not a feasibility measurement.
Yes. It carries the same layers, filters, viewport, and timeline state shown on this page into the live MISO workspace — the same save/restore system behind a personal saved view.