A searchable catalog of US power-market data.
Grid-operator publications from all 7 wholesale markets (ERCOT, CAISO, PJM, NYISO, MISO, ISO-NE, and SPP), federal records, grid infrastructure, and weather — reconciled into a single queryable catalog of 291 datasets, each carrying its source, how far back it goes, and how often it updates.
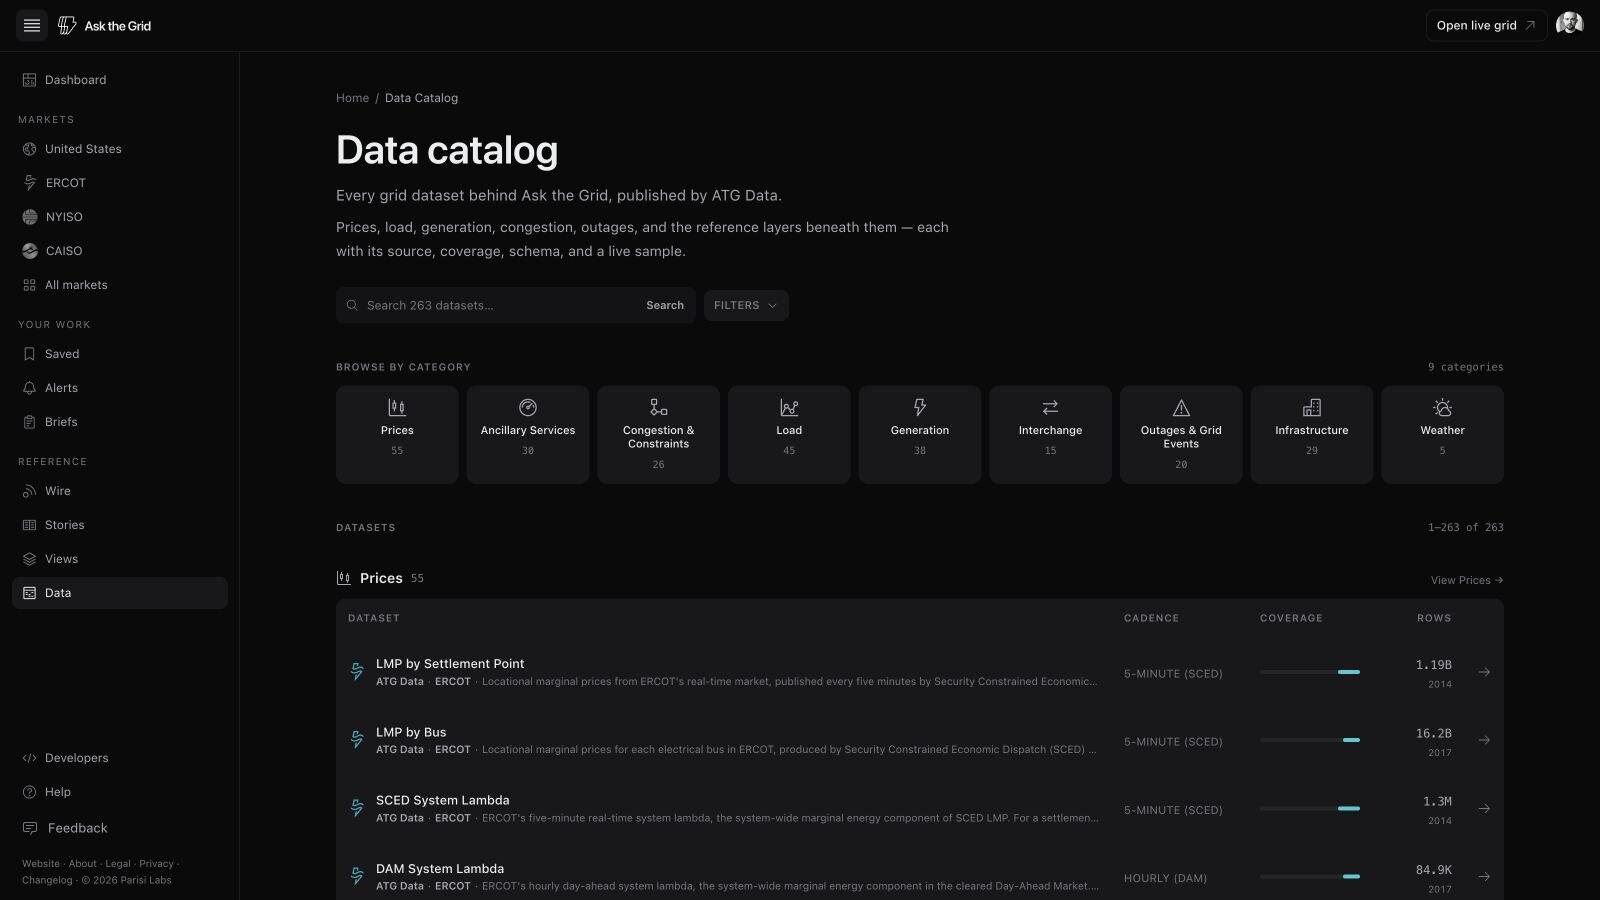
Browse every dataset
Coverage, cadence, source link, and a live preview of the newest rows.
Ask in plain English
The agent queries the same tables and cites the source on every number.
Query it over MCP
Point a compatible client at a scoped server and pull series into your tools.
Every dataset, browsable and source-attached.
Filter by category, source, and cadence; open a dataset to read its coverage window, publication vintage, and the record it came from.
What the catalog is made of.
Every dataset, sourcedBy domain
9 categories- 0157Prices
- 0245Load
- 0343Generation
- 0436Ancillary Services
- 0534Congestion & Constraints
- 0629Infrastructure
- 0722Outages & Grid Events
- 0820Interchange
- 095Weather
By source
15 feeds- 76ISONEISO New England
- 46NYISONew York Independent System Operator
- 43ERCOTElectric Reliability Council of Texas
- 31MISOMidcontinent Independent System Operator
- 29CAISOCalifornia Independent System Operator
- 27SPPSouthwest Power Pool
- 20PJMPJM Interconnection
- 6EIAU.S. Energy Information Administration
- 3HIFLDHomeland Infrastructure Foundation-Level Data
- 3Ask the Grid
- 2ODINOak Ridge National Laboratory outage feed
- 2Open-MeteoERA5 reanalysis and forecast weather
- 1NYSERDA IEDRNYSERDA Integrated Energy Data Resource
- 1NOAA
- 1FERC EBBFERC-mandated pipeline electronic bulletin boards
A sample of what's inside.
See all datasets10 datasets across the catalog’s domains and markets — at least one feed from each of the 7 live markets (ERCOT, CAISO, PJM, NYISO, MISO, ISO-NE, and SPP) alongside the federal and weather records — with the rows each one holds and the year its coverage starts, both read from the warehouse, not estimated. Each opens in the live catalog with its full schema, coverage calendar, and source of record.
Three ways to reach the data.
The same catalog answers a point-and-click browse, a plain-English question, and a typed programmatic call. Query it however you work; every path carries source and cadence with the result.
The live catalog
Browse every dataset with its coverage, cadence, source link, and a live preview of the newest rows — then open any table on the live grid.
- Query
- Point-and-click: filter by market and category, read the schema.
- Export
- Each dataset page carries its source of record and freshness.
The grid agent
Ask in plain English. The agent searches the catalog, calls typed grid tools, and answers with the source and as-of stamp attached to every number.
- Query
- Natural language over the same tables, no SQL required.
- Export
- Answers move the map and keep their evidence trail.
MCP & tools
Point a compatible client at a scoped Ask the Grid server. Discover datasets, call typed queries, and pull series into your own tools and reports.
- Query
- Programmatic: search_data, describe_data, query_data.
- Export
- Structured results built for downstream export and automation.
From publication to evidence
One flow feeds the map, radar, agent, and MCP — and every path out carries the source and as-of with it.
The warehouse behind the catalog.
Behind the catalog sits a warehouse of 98.0B stored rows, summed across 289 catalog tables with reported counts, out of 291. Five-minute prices, per-resource dispatch, and hourly forecast vintages accumulate fast: CAISO RTD LMP (5-minute) alone holds 25.4B rows.
Rows in the catalog
98.0Bstored
289 tables counted
Largest single feed
25.4Brows
CAISO · RTD LMP (5-minute)
Datasets cataloged
291
Publishing sources
15
Domain categories
9
5-minute live feeds
67
Disclosure-lag feeds
9
Deepest history
1970onward
SPP · Constraint Identity Evidence
The catalog is free to read.
Every dataset is free to browse — schema, coverage, cadence, source link, and a live sample, no account required. An account costs $0 and takes seconds — no card, ever — and it carries the live maps for all 7 markets (ERCOT, CAISO, PJM, NYISO, MISO, ISO-NE, and SPP), asset profiles, saved work, and the grid agent at 40 questions an hour. Direct SQL, programmatic access, and private-data workspaces are priced separately.
Honest about time and gaps.
The credibility wedge is discipline about provenance. Freshness is read per feed, disclosure lag is disclosed, and a missing source is drawn as missing.
Every table keeps its native meaning and its own clock, and every number stays attached to the source it came from.
Freshness, disclosure lag, and missing sources3
One clock per feed.
Five-minute real-time prices and annual infrastructure inventories never share a clock. Each dataset keeps its native cadence and publication vintage, so freshness is read per feed — not asserted for the whole catalog.
Disclosure lag is shown, not hidden.
Feeds released on a regulatory delay — ERCOT's 60-day SCED disclosures among the 9 in the catalog — render the trailing window as an expected lag, not a gap. What is not published yet is marked as such.
A missing feed reads as unavailable.
When a source has not published, the surface renders an empty or coverage state. Nothing is interpolated, back-filled, or fabricated to fill the space.
How rows, coverage, and depth are counted
ISO coverage runs deepest in SPP Constraint Identity Evidence (1970), SPP Constraint Identity Quality (1970), and ISONE Alerts (1970). The deepest EIA record, Henry Hub Natural Gas Spot Price, starts in 1997. Every dataset carries its own start date, read from the data rather than asserted.
Dataset, source, and category totals are computed from the catalog registry. Row counts and start dates are read from the warehouse hourly — stored rows as the engine reports them, before replacing-merge collapsing. A feed the warehouse does not report, or one indexed by a project milestone date rather than a publication clock, has no coverage start and renders as —.
Your private data, alongside the public catalog.
A utility brings its private grid data and internal models; a trading desk brings CEII and positions. They meet the public catalog at an explicit boundary — analyzed together, with provenance kept legible on both sides.
- Utility
- A utility joins its private grid data and internal models to the public market surface — analyzed together, never commingled.
- Trader
- A desk brings CEII — Critical Energy Infrastructure Information — and positions into the same workspace, scoped to your tenant alone.
- Ownership
- The seam stays legible: every answer shows which tools read public records and which crossed the boundary. Provenance never blurs.
Open the catalog. Follow any number to its source.
Browse 291 datasets across 15 sources in the UI, ask the agent in plain English, or pull it into your own tools over MCP. No card, no demo call.