PJM fuel mix right now
PJM's latest reported generation by fuel across its regional system. Compare the current output of gas, nuclear, coal, wind and the other published categories with prices and demand.
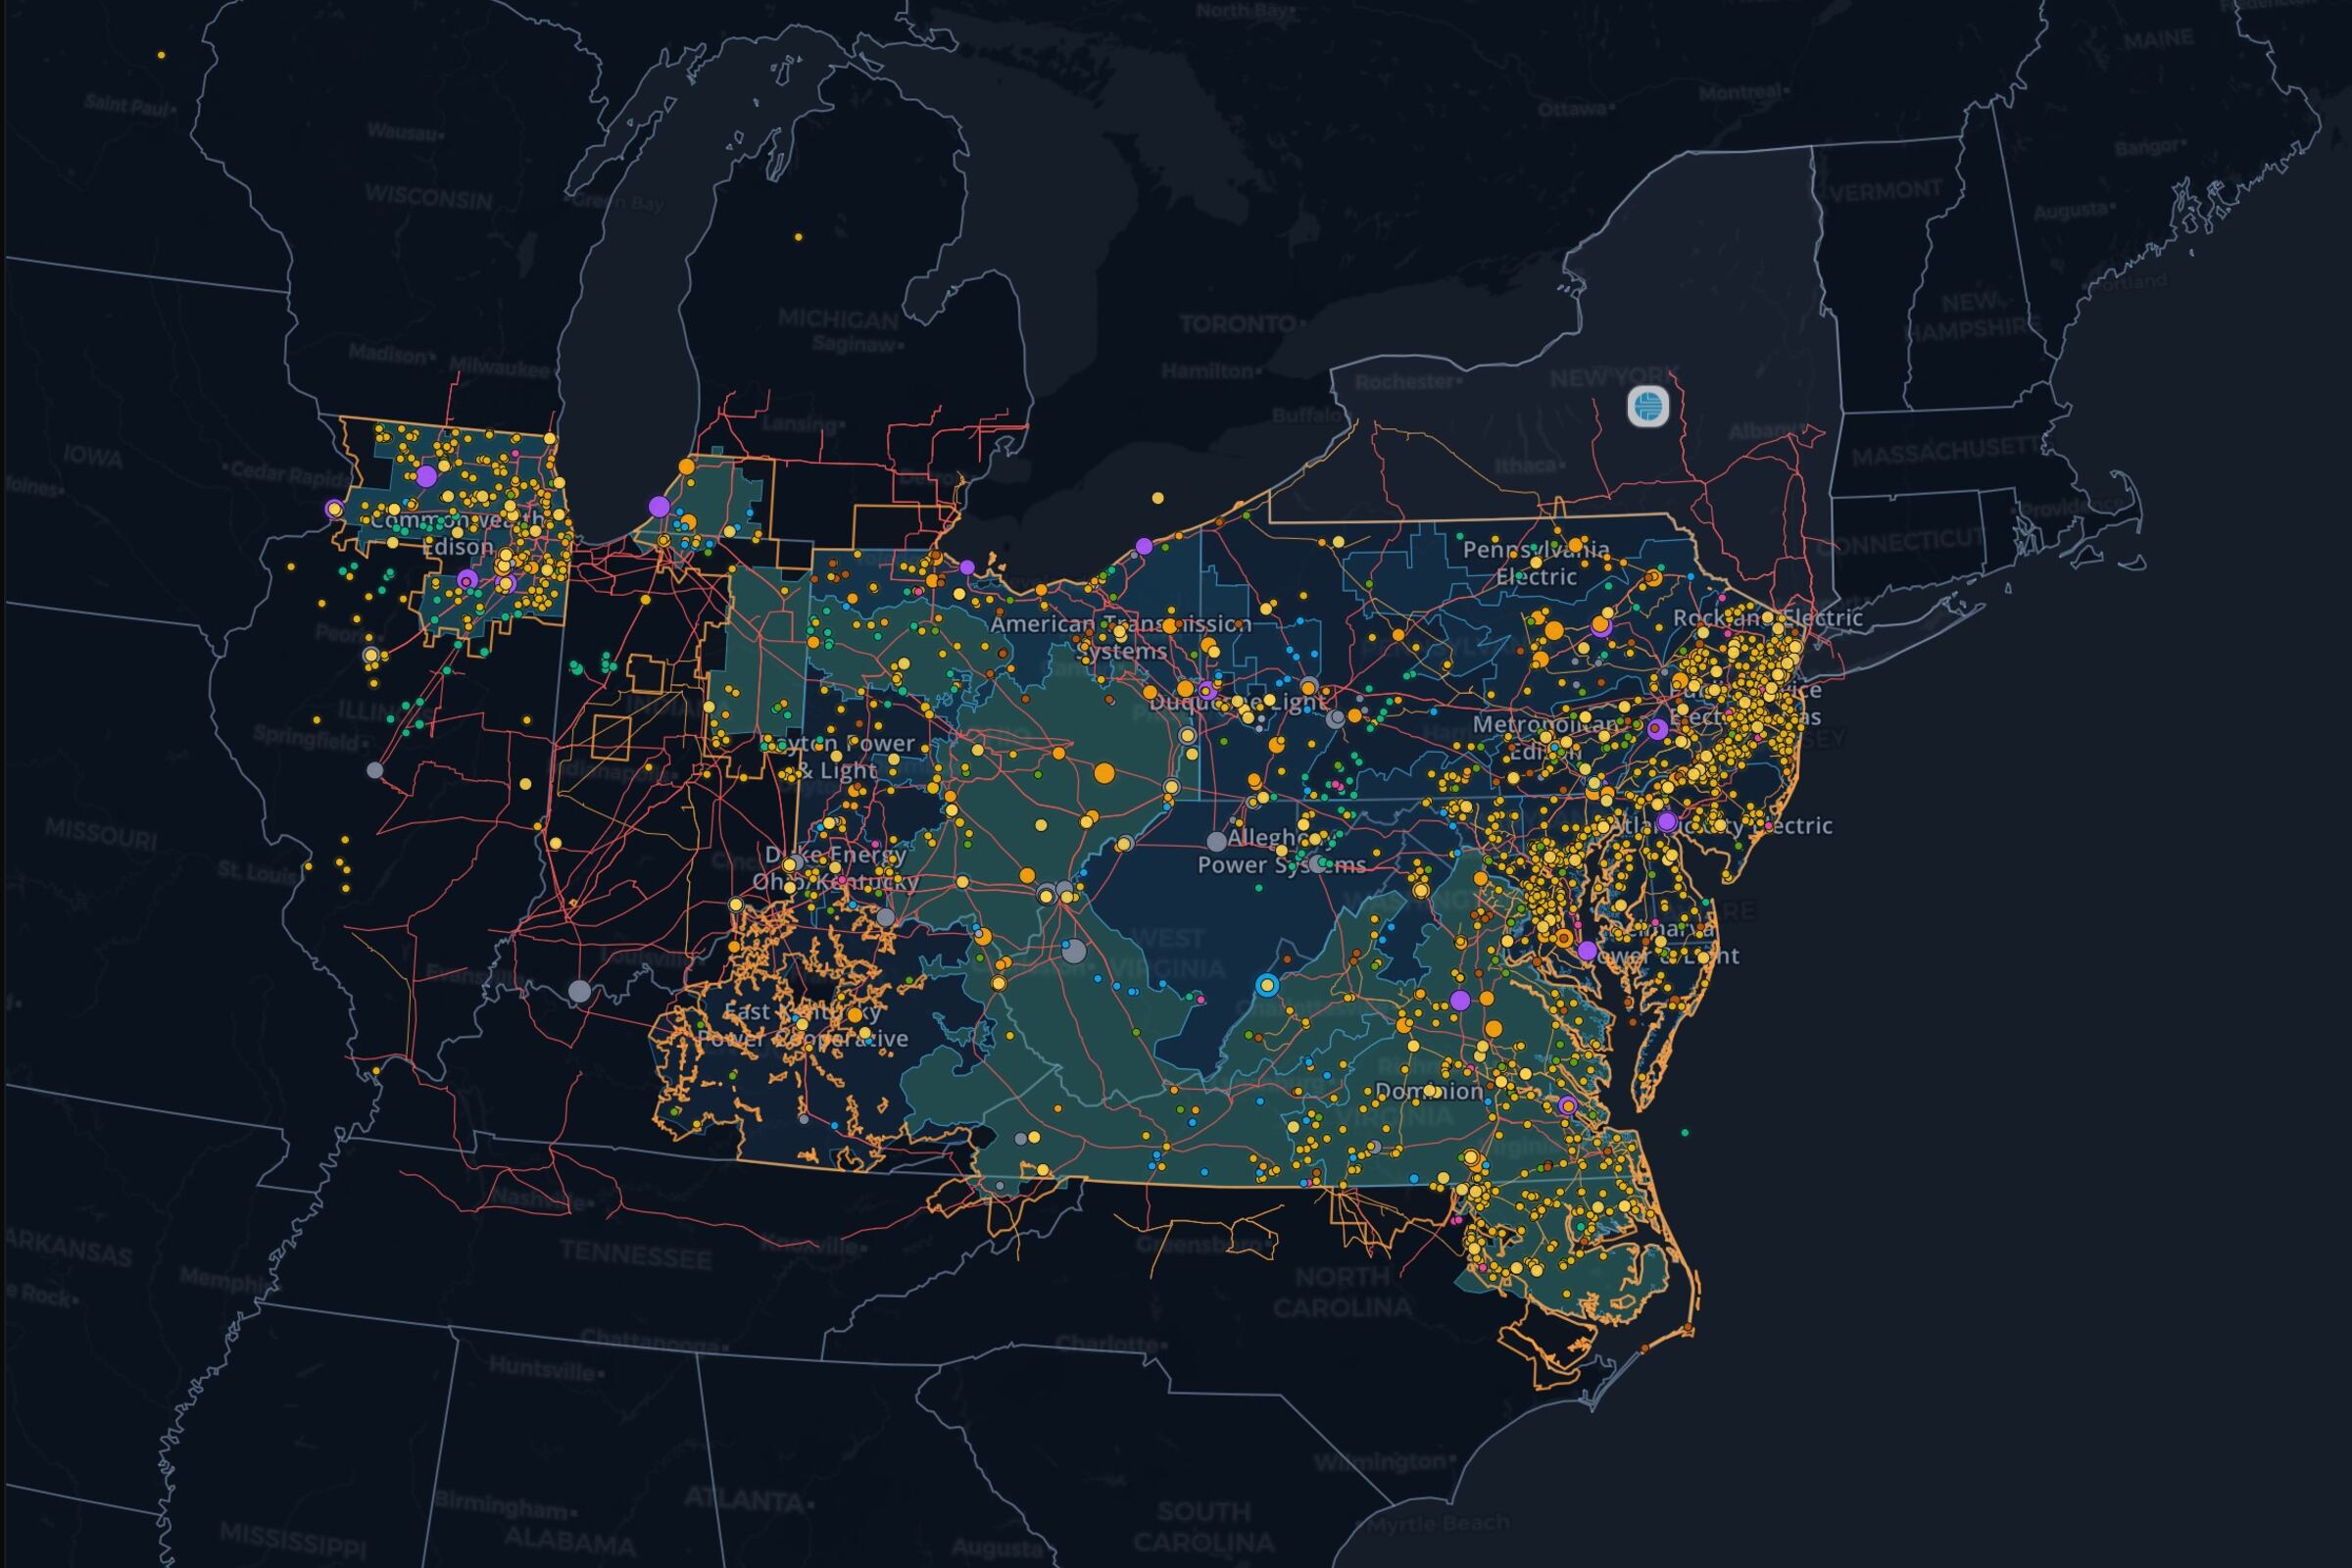
See it on the live PJM map, updating as the market publishes.
Explore generation on the mapAbout this view
Read the current generation mix
Start with the timestamp, then compare the published output of each fuel. Open the map to inspect generating facilities in the same grid, or compare the reading with real-time prices and the load outlook.
What the total measures
The generation total is the sum of the fuel categories in the same PJM snapshot. Each category is power in megawatts at that observation, not the fleet's nameplate capacity or a daily energy total. Imports and load are separate operating measures.
Continue into the live grid
A fuel mix describes supply across the system. Local prices and transmission constraints answer a different question. Read the mix alongside the price map and demand forecast, then ask the agent to investigate the published evidence.
Questions
Is this generation or installed capacity?
The generation total is the sum of the fuel categories in the same PJM snapshot. Each category is power in megawatts at that observation, not the fleet's nameplate capacity or a daily energy total. Imports and load are separate operating measures.
How current is this reading?
The observation time is printed with the generation total. It is the latest snapshot available from the operator feed, rather than a promise that every market publishes at the same time.
Can I use this as a daily energy mix?
The live reading is MW at one observation. A daily or monthly energy share requires integrating generation across that whole period, with the reporting coverage accounted for.
Can I explore the plants behind the mix?
Open the map to inspect published generating facilities and the surrounding network. Plant inventory capacity and the system's current fuel output are separate measures.