
PJM grid conditions, prices and demand
PJM Interconnection · Mid-Atlantic · Midwest
Explore PJM's published electricity prices, demand, fuel mix and operating notices. Open the grid map to compare locations, inspect transmission and interconnection requests, and investigate the source data with the agent.
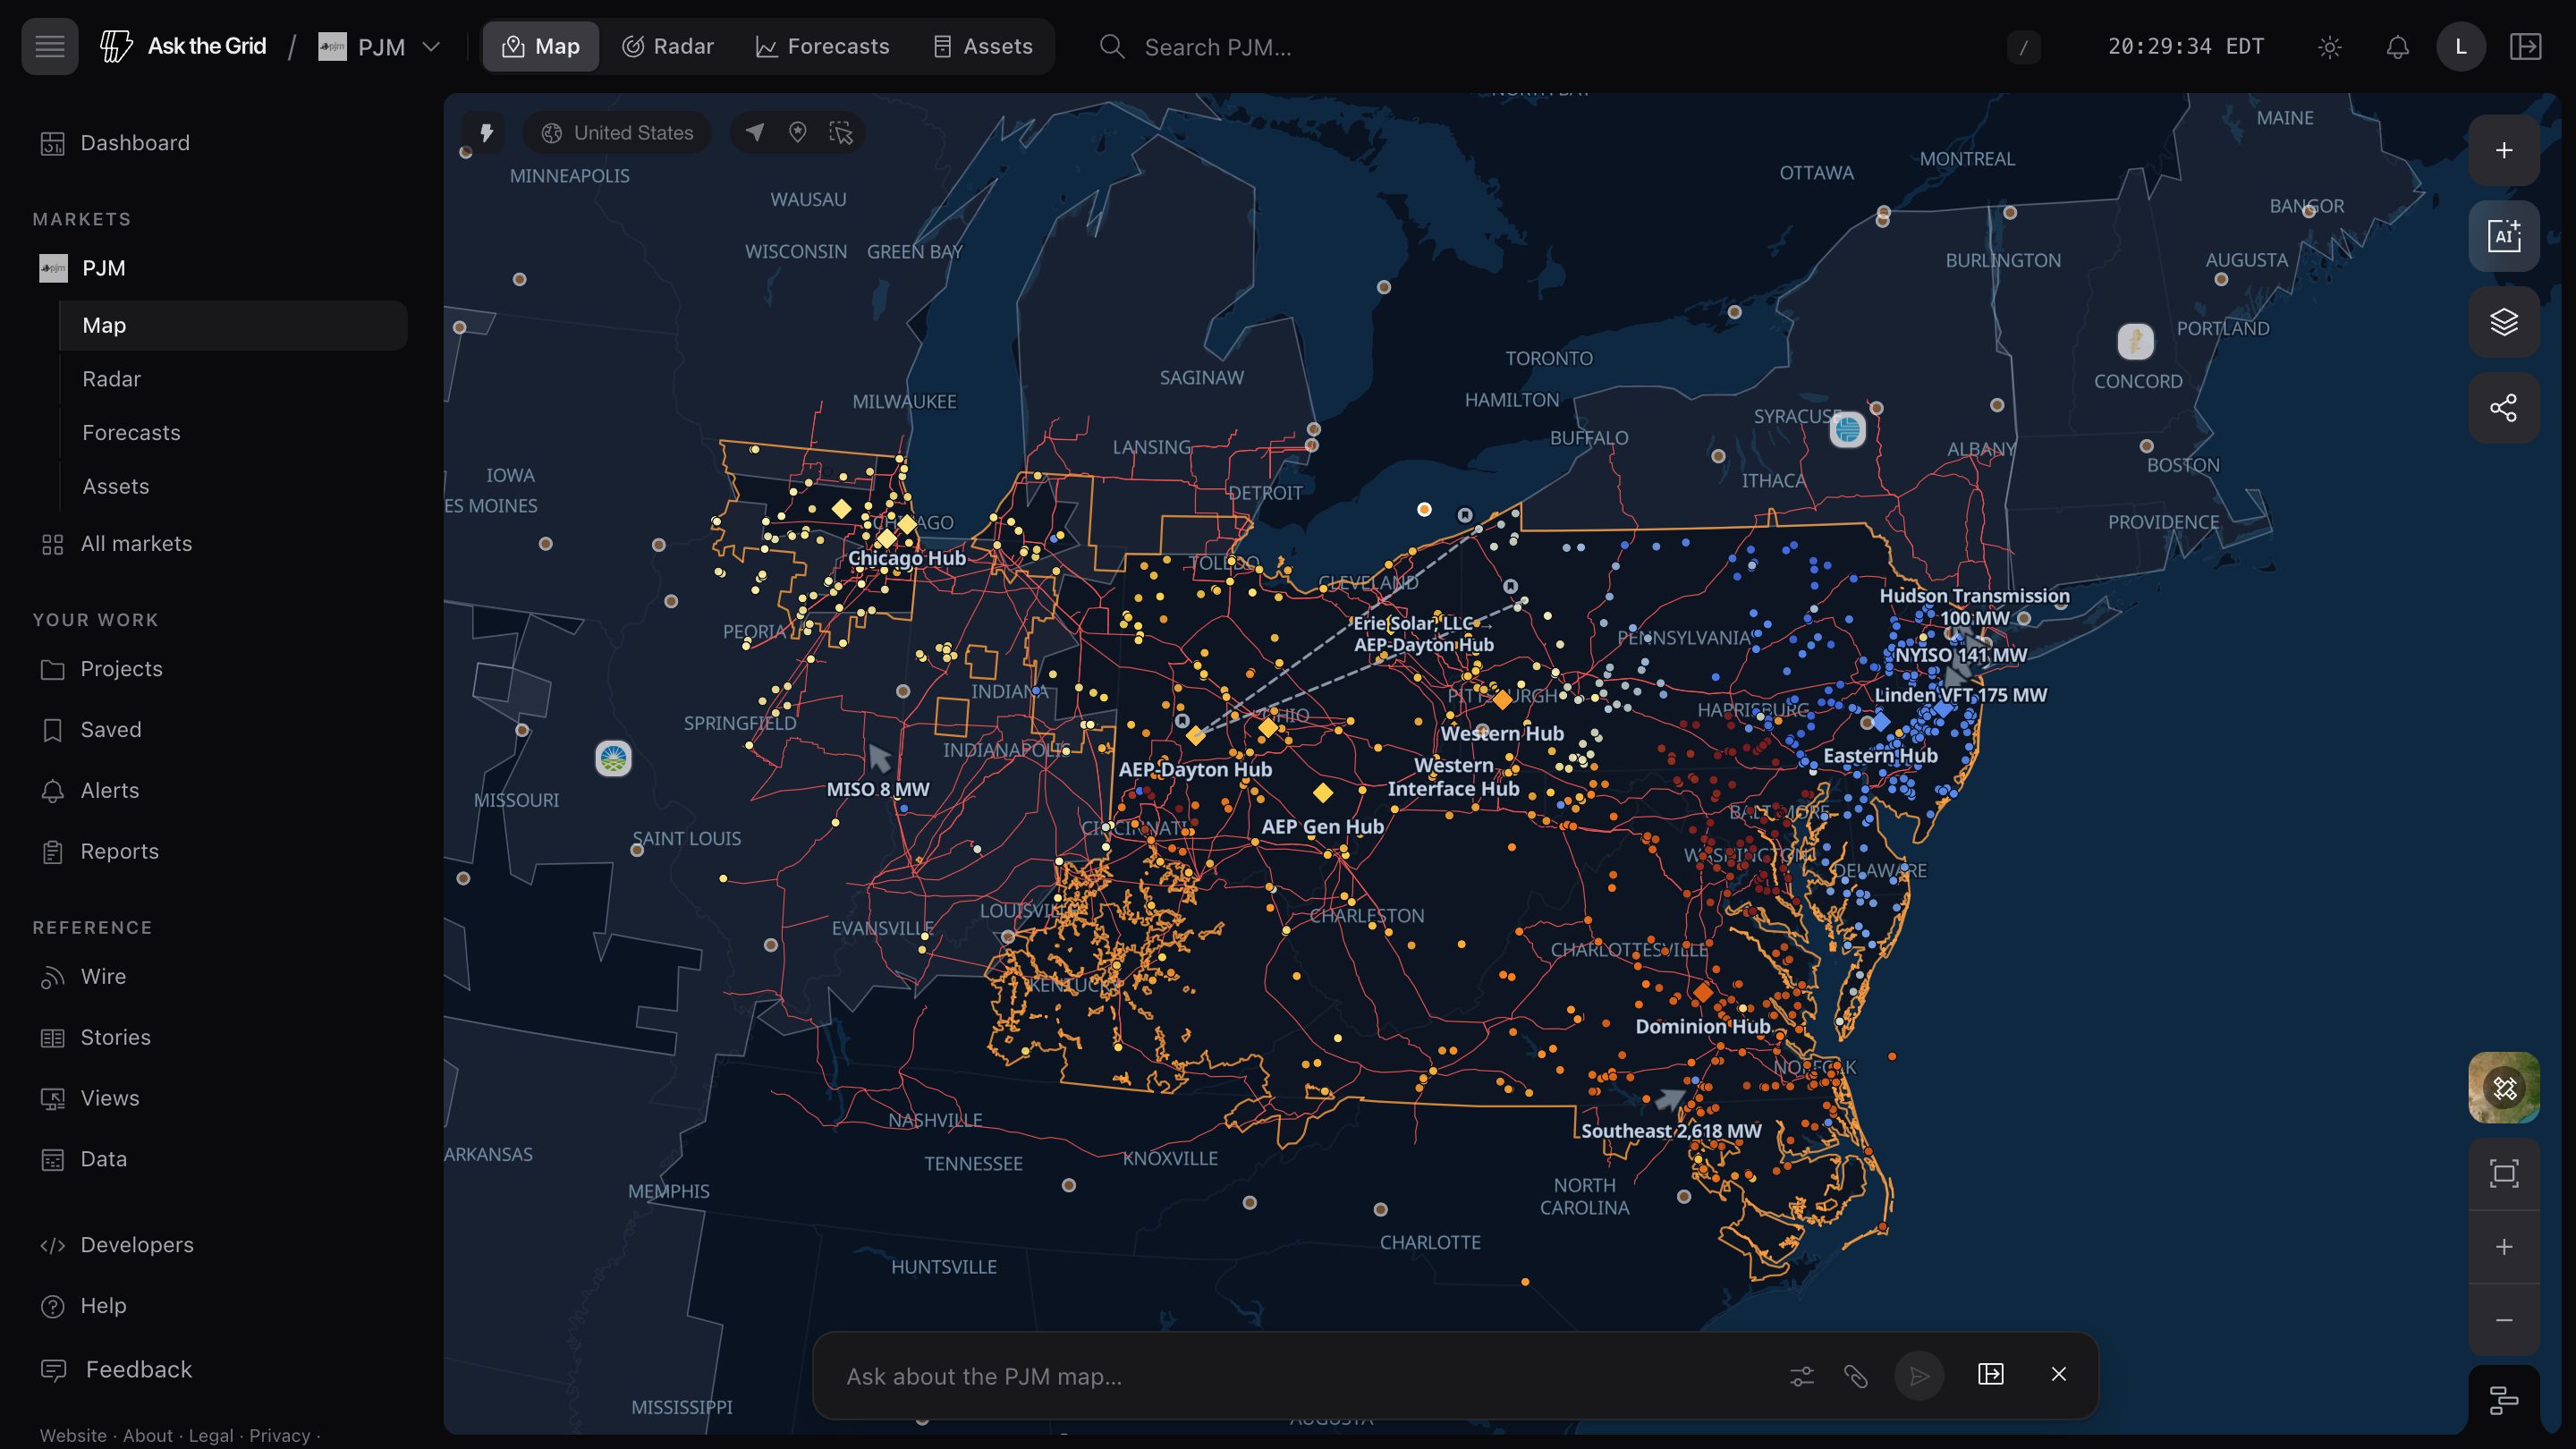
PJM on the live map
LiveWhat you can ask PJM
Open the agentClick any question to open it in the live agent with the market already selected. The answer keeps its sources attached.
What's live here
Every dataset, sourced9 coverage areas live today. Each row is backed by named source feeds in the public data catalog — cadence and provenance included.
| Coverage | Detail | Cadence | Status |
|---|---|---|---|
| Real-time LMPs | Five-minute unverified LMPs as the market moves, plus the hourly verified series after settlement review | 5-min / hourly | Live |
| Day-ahead LMPs | Hourly day-ahead prices — the cleared expectation for every delivery hour | Hourly (DAM) | Live |
| Demand | Instantaneous system load at five-minute cadence | 5-min | Live |
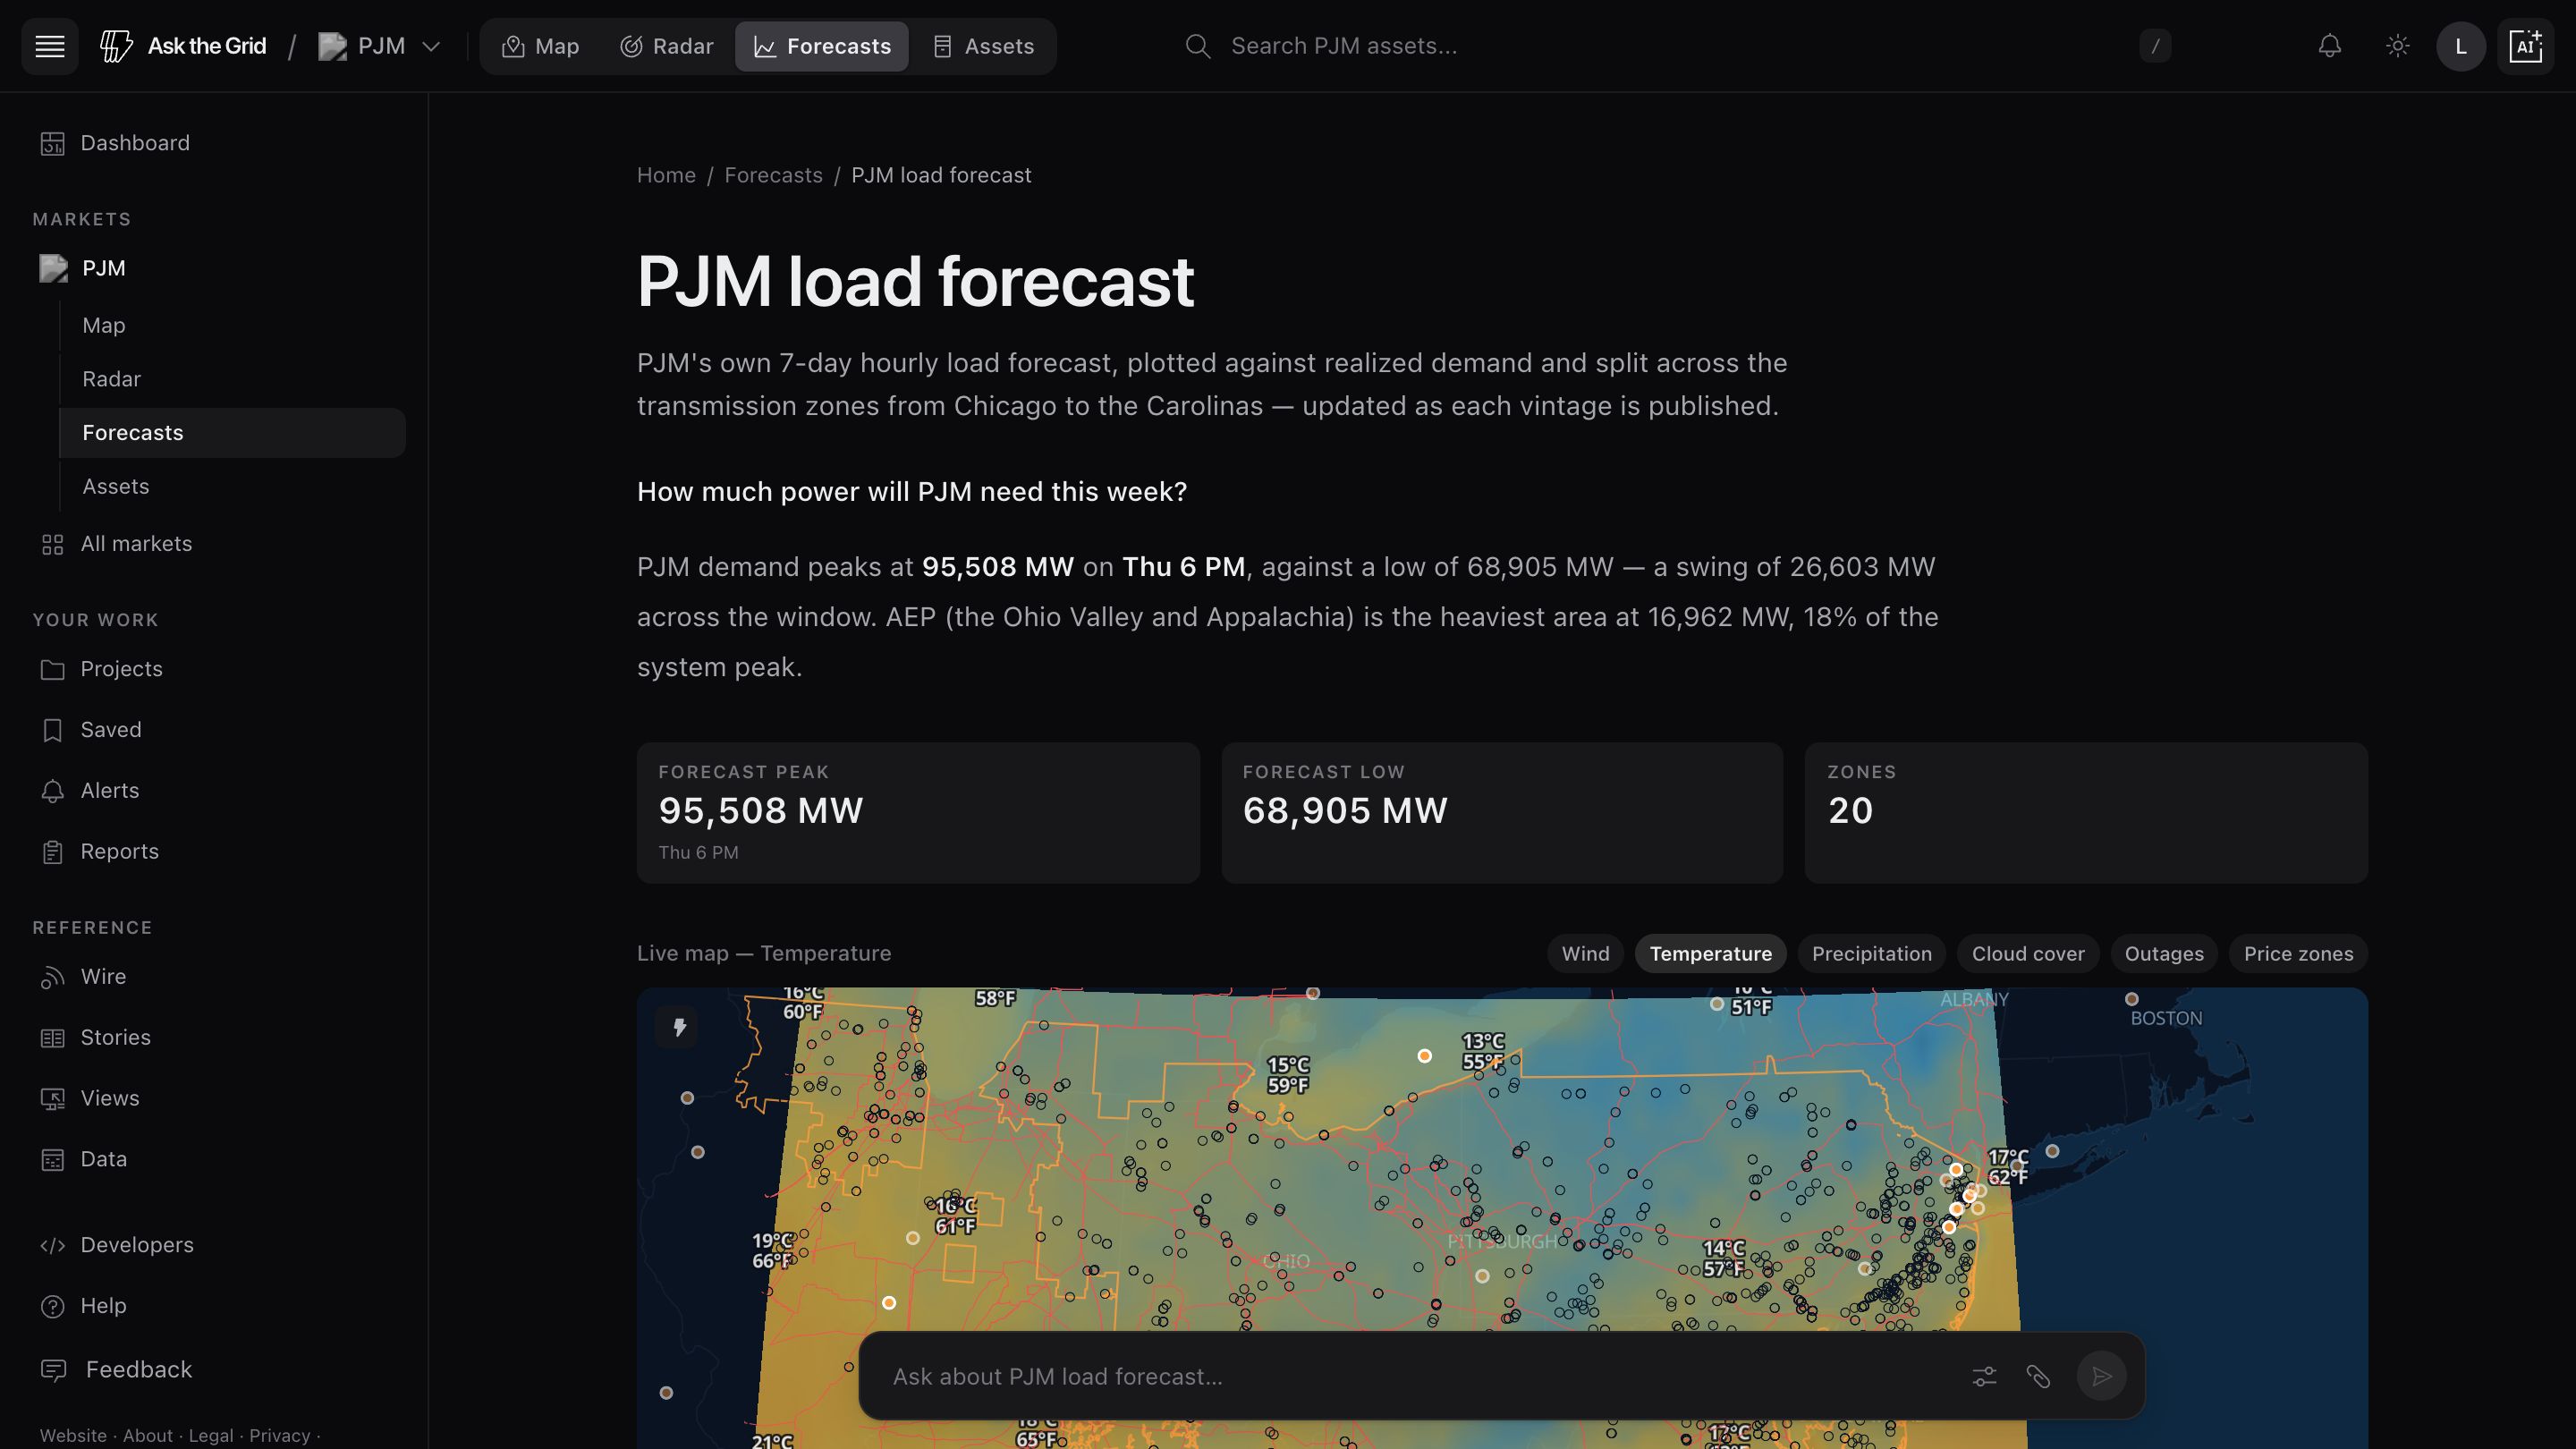
| Load forecasts | Very short-term forecast (~2-hour horizon) and the hourly seven-day forecast | Sub-hourly / hourly | Live |
| Fuel mix | Generation by fuel type across the footprint | 5-min | Live |
| Outages | Generation outages by type, updated daily | Daily | Live |
| Transmission constraints | Day-ahead transmission constraint reports naming expected binding facilities | Daily (day-ahead) | Live |
| Assets & weather | Plant profiles from EIA-860 and HIFLD, plus ERA5 weather history and forecast grids | Reference / hourly | Live |
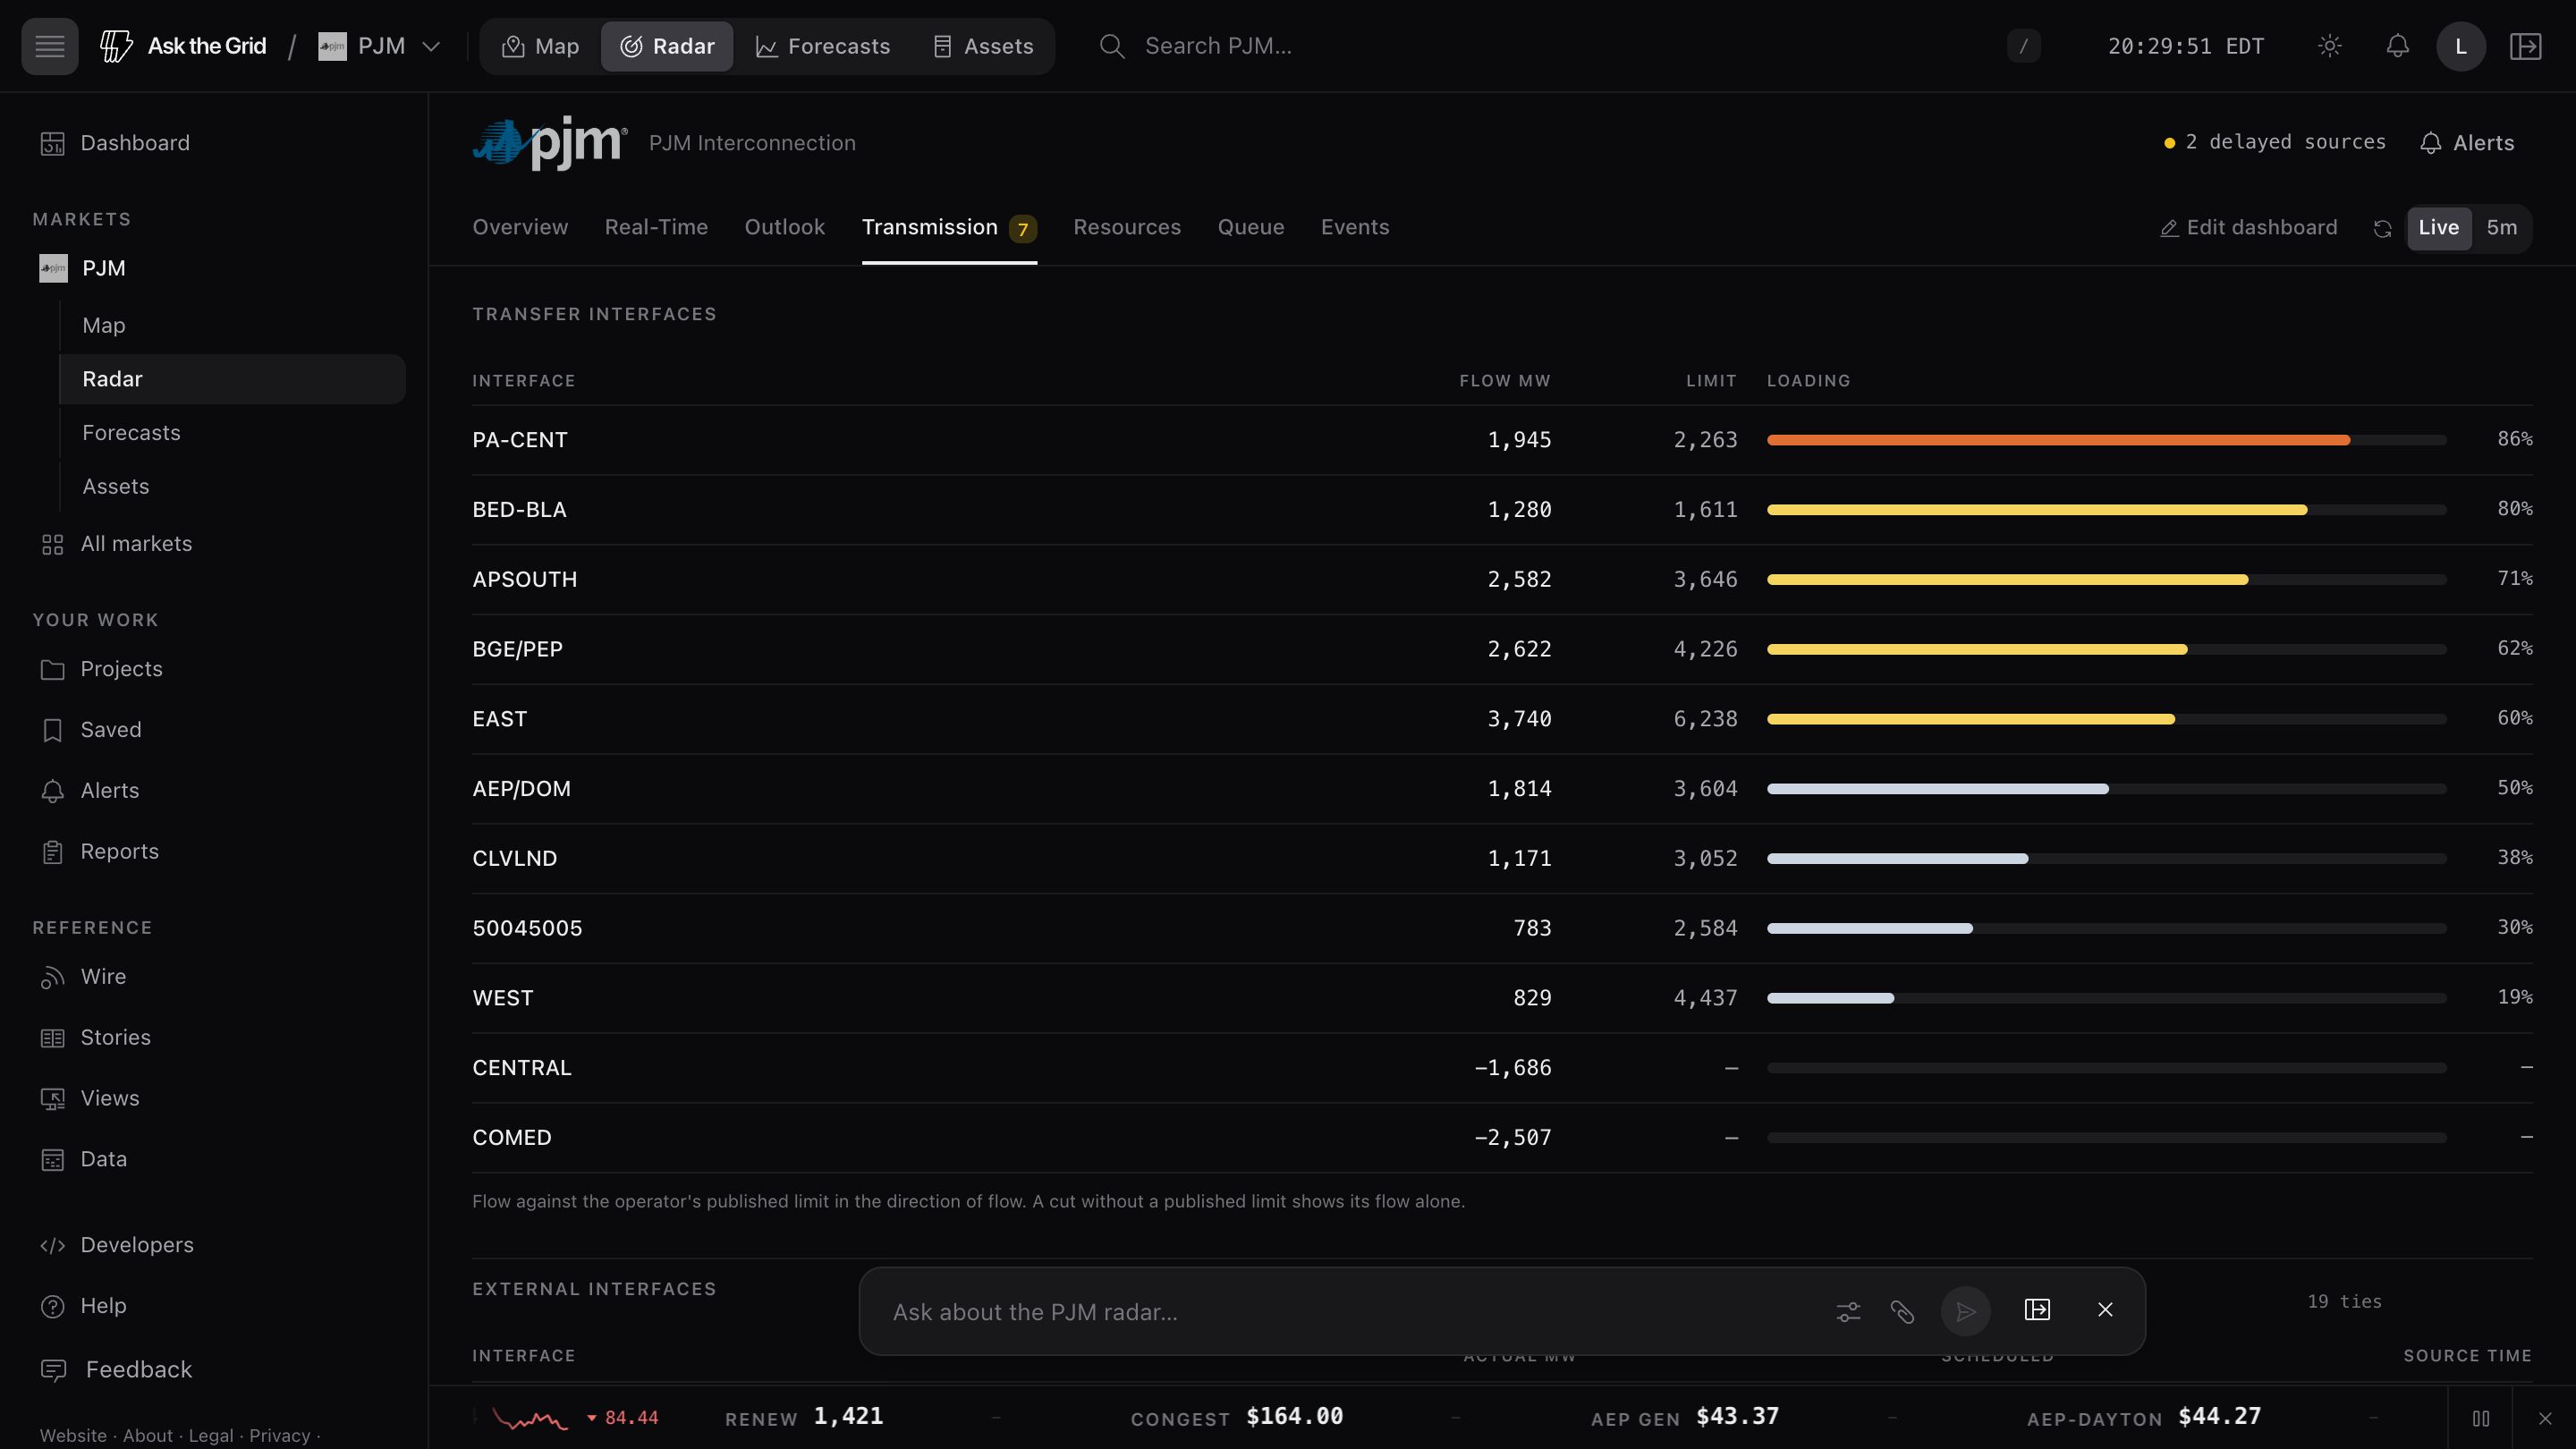
| Radar cockpit | Live market conditions plus transmission weather sensitivity, external interfaces, load, prices, generation, and source clocks | Streaming / 5-min | Live |
Live intelligence for PJM
Browse every live viewEverything Ask the Grid publishes on PJM, in one place — what the grid is doing now, where it is headed, and what has been written about it.
Live views
Forecasts and outlooks
Coverage and analysis
Data and access
PJM power plant registry
PJM’s EIA-anchored plant registry is searchable by operator, technology, and county, with capacity ranked.
Registry assets
1,960PJM plant records
EIA nameplate capacity
224.7GW
The product, as it runs
Real product screenshots, shown in full.
Read PJM nodal prices and operating conditions
PJM publishes prices at individual pricing nodes, hubs and zones. The five-minute real-time feed and the hourly real-time series have different publication schedules. Hub history on Ask the Grid uses the hourly series, published about a day after delivery; the price map uses the five-minute feed.
Compare demand, fuel mix and published transmission constraints at matching times when investigating price differences. PJM also publishes interconnection requests and operating notices, which describe different stages of grid development and operations.
Open the price map to explore a location, the queue map to investigate project requests, or Radar to monitor the market. Questions opened from this page carry PJM as their market context.
Ask PJM what changed.
Open the live market and begin with a question, a place, or an interval.