ISO New England: How the Electricity Market Was Built
The history of ISO New England, from the 1971 power pool to today’s energy and capacity markets and the challenge of keeping the grid supplied in winter.
November 18, 20269 min read

ISO New England runs the wholesale electricity markets and high-voltage grid across Connecticut, Massachusetts, New Hampshire, Rhode Island, Vermont, and most of Maine. The independent operator schedules power, balances the grid as conditions change, and plans for future demand. Local utilities deliver electricity to homes and businesses.
The region built its first coordinated dispatch system after a blackout showed how closely utilities depended on one another. It later opened that network to competing suppliers. The market still faces a very physical test each winter. Can plants get enough fuel when homes and businesses need the same pipelines for heat?
01
From local power systems to a six-state grid
A federal survey published in 1921 recorded power stations and transmission lines concentrated around the region’s cities and industrial towns. A utility could generate electricity near a city or use a river site and carry the output to customers. As companies connected their networks, they could share generation and reserves across a much larger area.
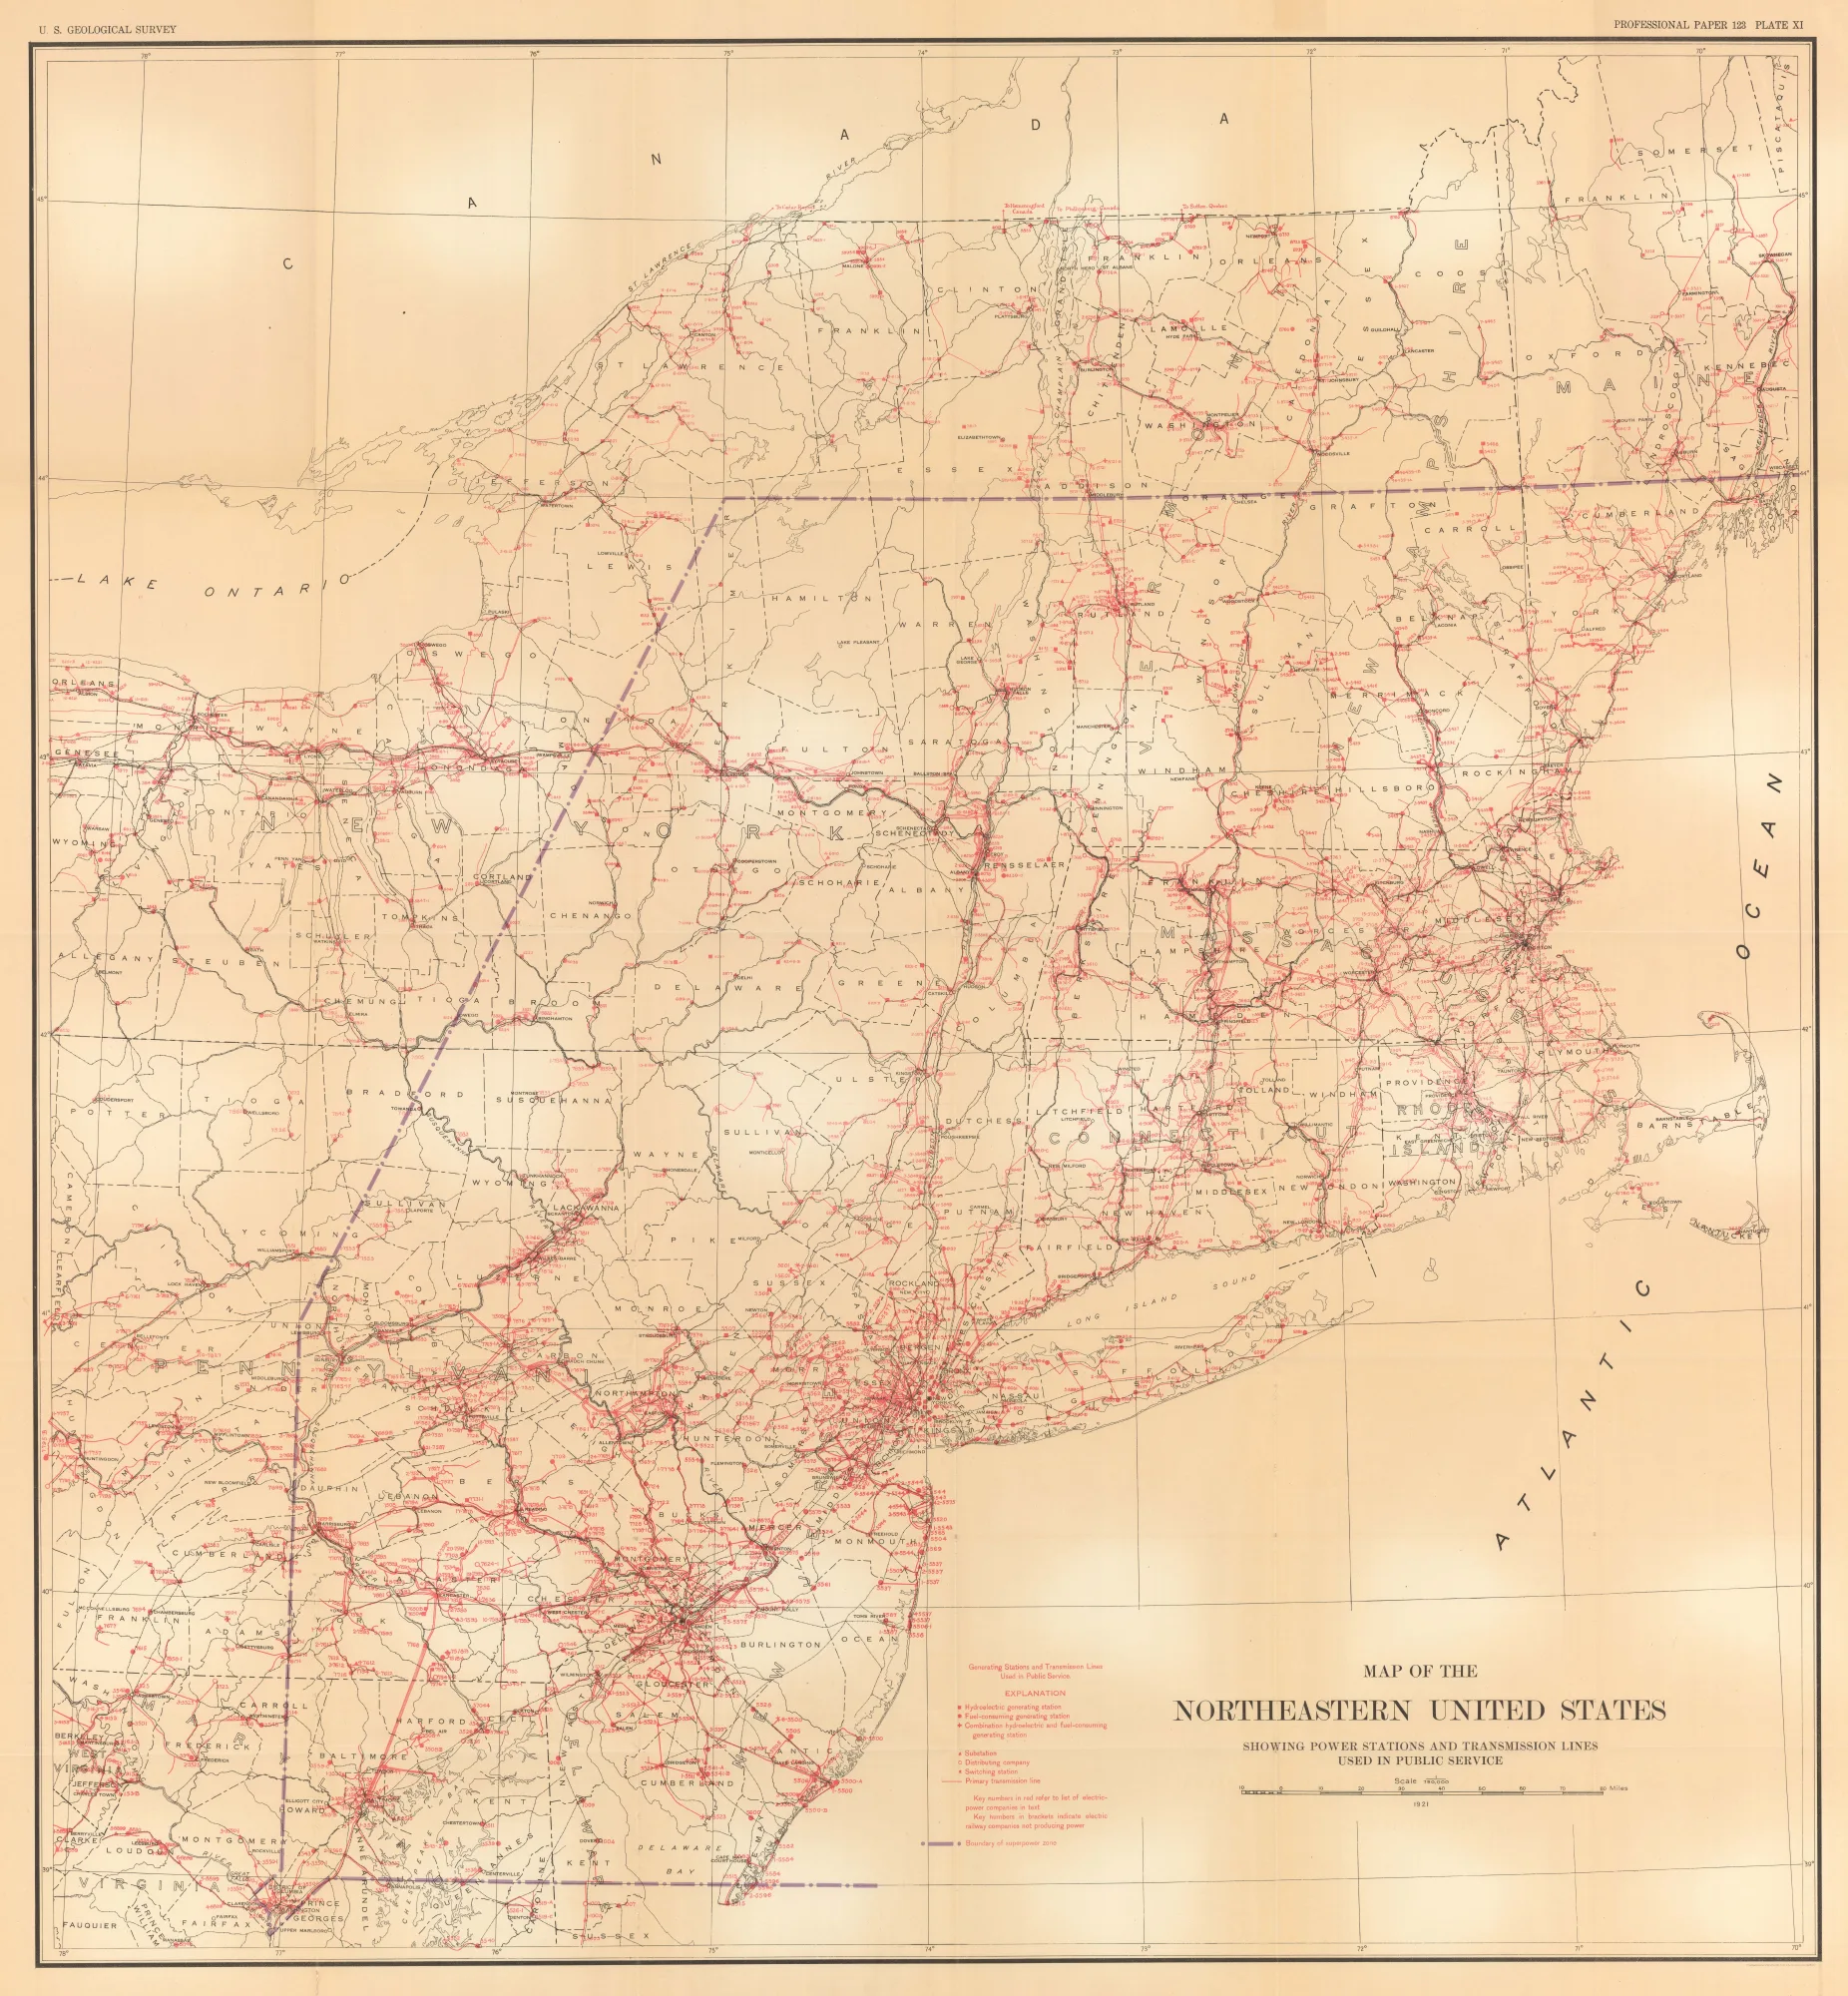
Utilities could run a less expensive plant in one territory to serve customers in another. They could also draw on neighbors when their own equipment failed. That arrangement made each utility’s reliability partly a function of decisions taken elsewhere. The grid was becoming regional before the institutions that coordinated it had caught up.
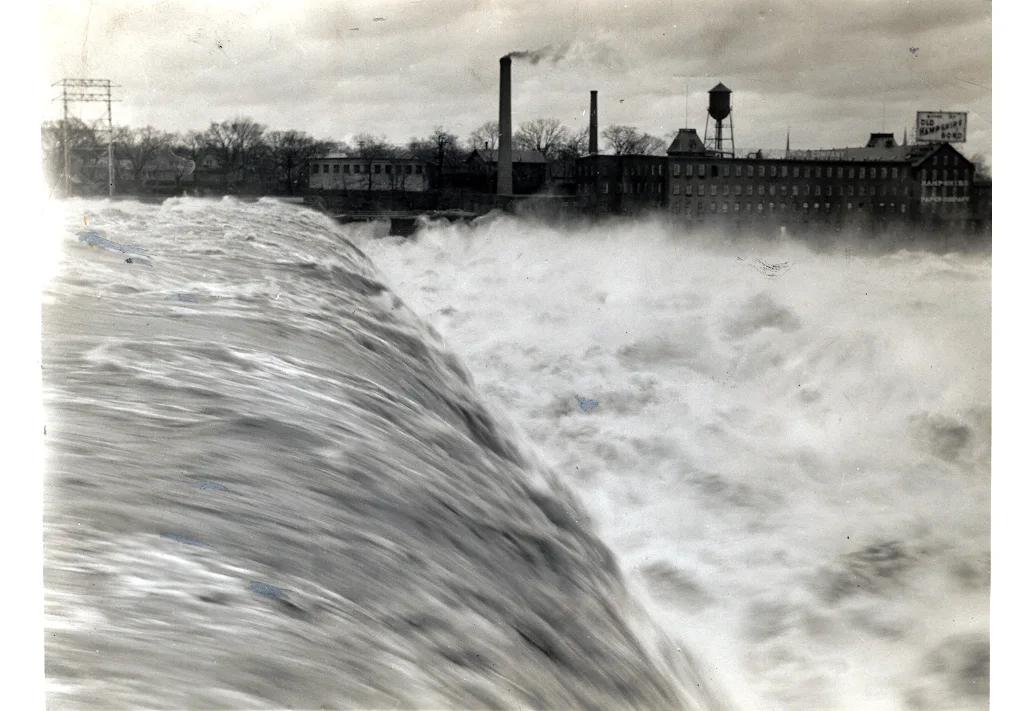
The November 9, 1965 Northeast blackout made that dependence plain. A line tripped near Niagara Falls, Ontario, and the disruption spread across New York and into New England. The utilities needed shared procedures for dispatch, transmission outages, and emergency response. ISO New England’s historical timeline.
02
Utilities formed the New England Power Pool in 1971
The New England Power Pool (NEPOOL) began in 1971. Member utilities assigned a central dispatcher to coordinate their generation, equipment outages, and power exchanges. The pool handled settlements and joint planning. Each utility still owned and maintained its equipment, while the central dispatcher could compare the cost and availability of plants across the region.
For a utility with a high-cost plant, the pool created a practical alternative. If another utility’s unit could produce the next megawatt-hour more cheaply and the lines had room, the regional dispatch could use that unit. The same shared view helped the pool schedule outages around times when other equipment could cover.
The modern operator inherited that regional network. Parts of northern Maine fall outside its control area because their transmission system connects through New Brunswick. The ISO’s transmission tariff identifies those areas and names the Northern Maine Independent System Administrator as their operator. The physical connections explain the exception to the six-state shorthand.
03
An independent operator took over in 1997
By the 1990s, companies that wanted to sell power across the region needed access to transmission systems owned by incumbent utilities. In April 1996, FERC Order 888 required public utilities under its jurisdiction to offer nondiscriminatory transmission service. NEPOOL proposed an independent operator. ISO New England began operating on July 1, 1997, and competitive wholesale markets opened in 1999.
On March 1, 2003, the ISO adopted Standard Market Design. It separated day-ahead commitments from real-time balancing and introduced locational marginal prices. A price could now reflect the cost of serving a particular place when a transmission line was congested. Financial transmission rights gave participants a way to hedge certain day-ahead congestion charges.
In 2005, ISO New England gained broader authority over regional transmission operations and became a regional transmission organization (RTO). It kept its original name. NEPOOL continued as a forum for market participants to develop and review rule changes. The regional grid operator remains independent of the firms that buy and sell on its markets.
The 2005 agreements replaced NEPOOL’s open-access transmission tariff with the ISO tariff. The new structure gave the ISO primary responsibility for filing market rules with FERC. It also gave stakeholders a way to bring a competing proposal before the commission. When an eligible alternative to an ISO market rule wins at least 60% support in NEPOOL’s Participants Committee, the ISO must present that option in its filing and explain why it favors its own version. The process became known as a jump-ball filing. In 2014, it brought two proposals to FERC for how to pay or charge generators based on their performance during shortages. FERC’s order on the competing proposals.
04
How the New England electricity market works
The day-ahead energy market lets buyers and sellers commit to a price and quantity before delivery. Operators then update the dispatch as demand changes, plants trip, and more current forecasts arrive. The real-time market sets prices for those operating conditions and settles differences from the day-ahead commitments.
ISO New England publishes energy prices at individual locations and for eight load zones. Massachusetts has three zones, while each of the other five states has one. A regional hub price is a useful benchmark. To understand a particular location, look at its own price and the transmission limits that can separate it from the hub.
The ISO also procures reserves for the unexpected. On March 1, 2025, the Day-Ahead Ancillary Services Initiative replaced the old Forward Reserve Market. The day-ahead process now clears energy and these services together. That lets the operator compare the cost of scheduling a resource to produce energy with the cost of keeping it available to respond later.
05
Capacity payments and a test of performance
The grid needs resources for rare high-demand hours and equipment outages. A resource might sell very little energy in a normal week and still help cover a difficult day. A capacity payment is for a commitment to be available during a future period. Energy payments cover the electricity that clears in the energy markets.
New England held its first Forward Capacity Auction in February 2008 for a delivery period beginning in 2010. The system generally bought capacity about three years ahead, giving projects a chance to build after securing an obligation. The auction could also keep existing generators and other resources available for a future year.
In June 2018, Pay-for-Performance tied more of a resource’s compensation to what it delivered during reserve shortages. A resource that fell short of its expected contribution could owe a performance charge. A resource that delivered above its share could earn an additional payment. The rule made securing fuel and keeping equipment ready more valuable during the hours when the system needed help most.
Christmas Eve 2022 put the rule to work. Cold weather, unexpected outages, and lower imports left the region short of reserves. The ISO’s market monitor counted 17 five-minute intervals that triggered Pay-for-Performance. It also found that the unplanned generator outages were due to mechanical failures. Capacity had been procured ahead of time, and the performance payments were settled against the equipment and imports that were actually available that day. ISO New England’s 2022 Annual Markets Report.
06
How gas changed New England’s winter risks
New England’s power plants ran largely on nuclear fuel, oil, and coal in 1990. New gas plants entered in the late 1990s and 2000s, and older plants retired. Vermont Yankee stopped producing power in 2014. By 2025, natural gas generated 54% of the electricity produced by the region’s power plants. That share excludes electricity generated outside New England and imported.
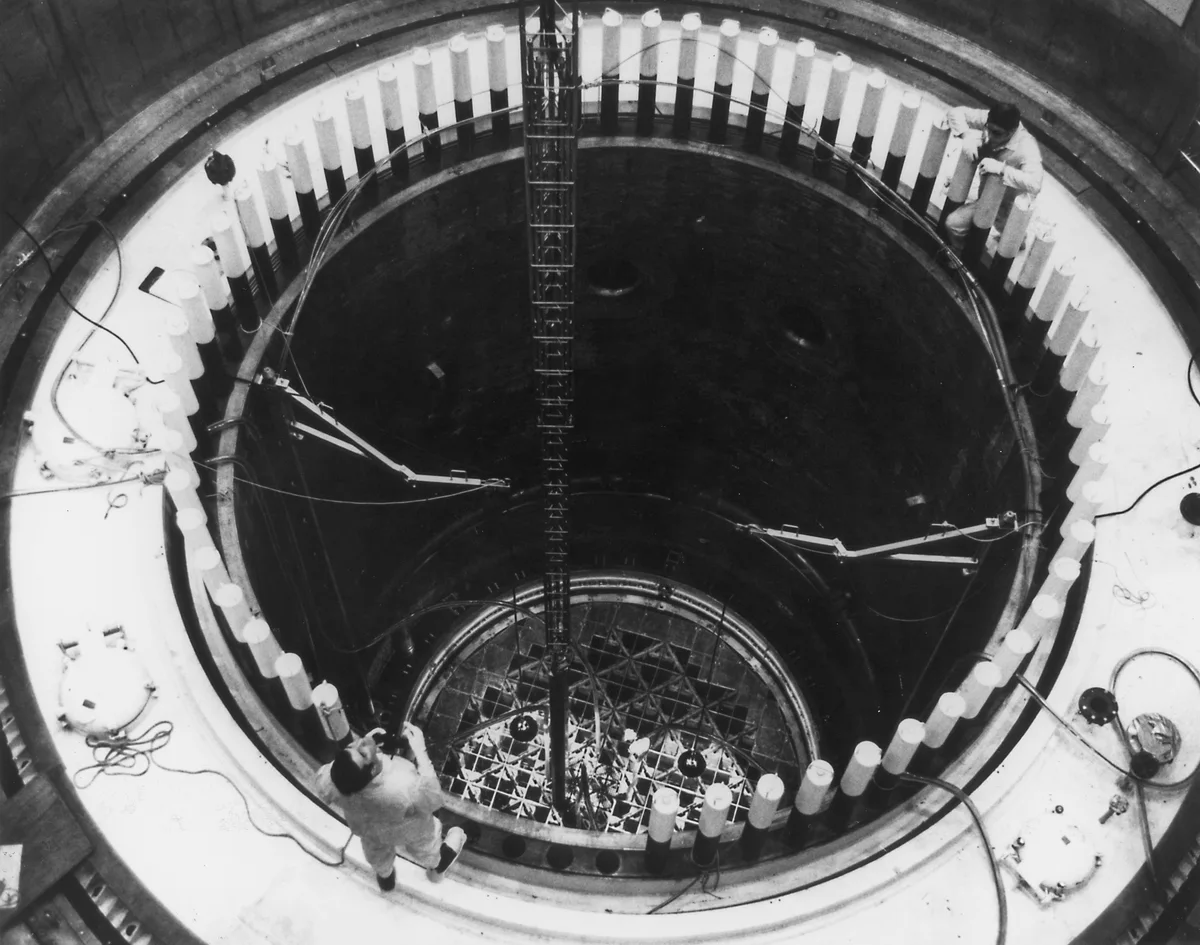
Many of the gas plants depend on deliveries through interstate pipelines as they run. When a cold snap increases heating demand, a plant can face higher fuel prices or limited access to gas. Some plants can use stored oil when gas is scarce or expensive. That option depends on how much fuel is already on site and whether suppliers can replenish it. ISO New England on the resource mix.
The region has tried several ways to guard against an extended supply shortage. For winter 2013–14, the ISO offered payments intended to build up fuel oil inventories and demand response. Another long period of cold depleted oil stocks around the start of 2018. The ISO responded with a 21-day energy assessment that uses weather, expected demand, and information from generators about fuel supplies. A plant with several days of oil on site can help when gas is scarce. An extended cold spell tests when the next delivery can arrive.
Winter Storm Fern made the exposure visible in 2026. The New England Hub’s real-time price averaged $278.24/MWh from January 26 through February 1, up 47% from the week before. ISO New England attributed two hours above $630/MWh on January 26 to high fuel prices and severe weather. Those numbers are for wholesale energy at the hub. ISO New England’s weekly market report.
07
The 2026 reforms bring capacity auctions closer to delivery
FERC accepted the prompt-auction redesign on March 30, 2026. Starting with the capacity period beginning June 2028, the auction will move much closer to delivery. That gives the ISO more current information about expected demand and which resources are likely to be available. A separate seasonal and accreditation proposal would buy and value capacity differently for summer and winter. As of November 18, 2026, that proposal remained under development.
The pool’s doors have also opened to a wider set of suppliers. Registration for small-resource aggregations in New England’s energy and ancillary services markets began November 1, 2026. An aggregator can combine resources like batteries or flexible customer loads so they can qualify together. Those resources still have to clear the market and meet its obligations when dispatched.
The ISO’s November 16 winter outlook projected peak demand of 20,483 MW in normal conditions and 21,457 MW in extreme cold. It expected sufficient resources, including new offshore wind and a full winter of the New England Clean Energy Connect import line. Operators will still track fuel deliveries, outages, and the ability to bring in power during a cold spell.
The live New England market guide puts those pieces together. Compare demand, fuel mix, and prices for the same hours. The price tells you what the market paid for the next increment of energy. The fuel mix and import flows show how the system met the demand.