
ISO New England grid conditions and prices
ISO New England · New England
Explore ISO-NE prices, demand, generation and published constraints across New England. Open the grid map to compare pricing locations, inspect transmission and queue requests, and investigate the available data with the agent.
ISO-NE on the live map
LiveWhat you can ask ISO-NE
Open the agentClick any question to open it in the live agent with the market already selected. The answer keeps its sources attached.
What's live here
Every dataset, sourced4 coverage areas live today. Each row is backed by named source feeds in the public data catalog — cadence and provenance included.
| Coverage | Detail | Cadence | Status |
|---|---|---|---|
| Real-time prices | System and nodal prices as ISO-NE publishes them | 5-min / hourly | Live |
| Demand & forecasts | Actual load and forecast series for the region | 5-min / hourly vintages | Live |
| Fuel mix & imports | Generation by fuel with import context from neighboring systems | As published / hourly | Live |
| Radar cockpit | Live grid condition, six operator clocks, demand, fuel mix, prices, congestion, external interfaces, and forecasts | Streaming / 5-min | Live |
Live intelligence for ISO-NE
Browse every live viewEverything Ask the Grid publishes on ISO-NE, in one place — what the grid is doing now, where it is headed, and what has been written about it.
Live views
Forecasts and outlooks
Coverage and analysis
Data and access
ISO-NE power plant registry
ISO-NE’s EIA-anchored plant registry is searchable by operator, technology, and county, with capacity ranked and source-backed profiles for selected facilities.
Registry assets
1,433ISO-NE plant records
EIA nameplate capacity
37.7GW
Detailed profiles
34Source-backed pages
The product, as it runs
Real product screenshots, shown in full.
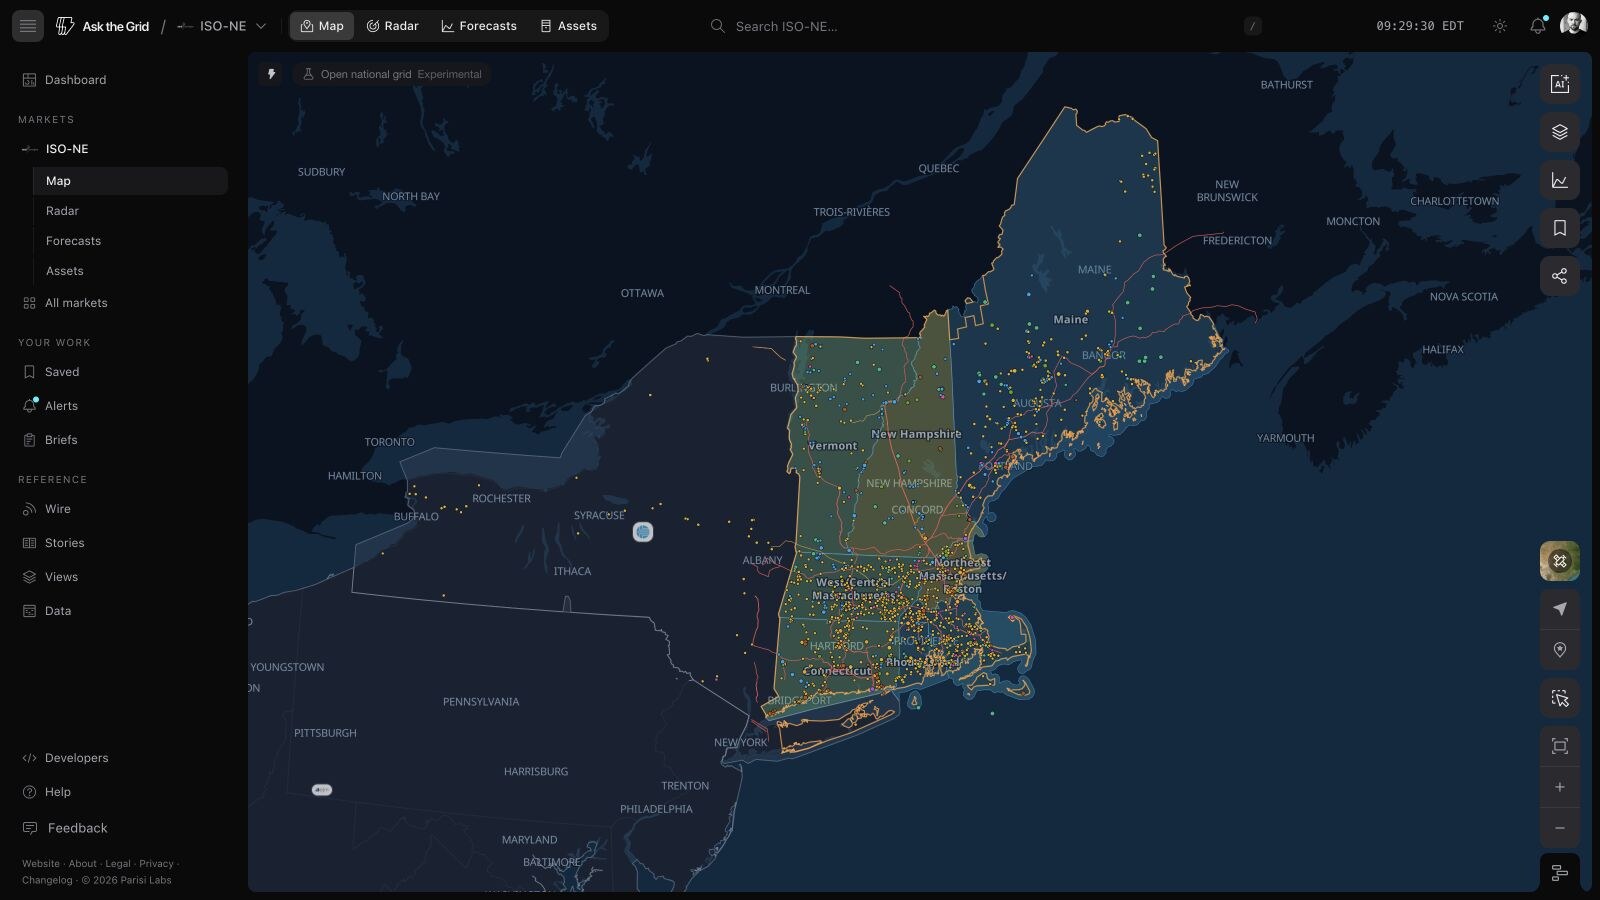
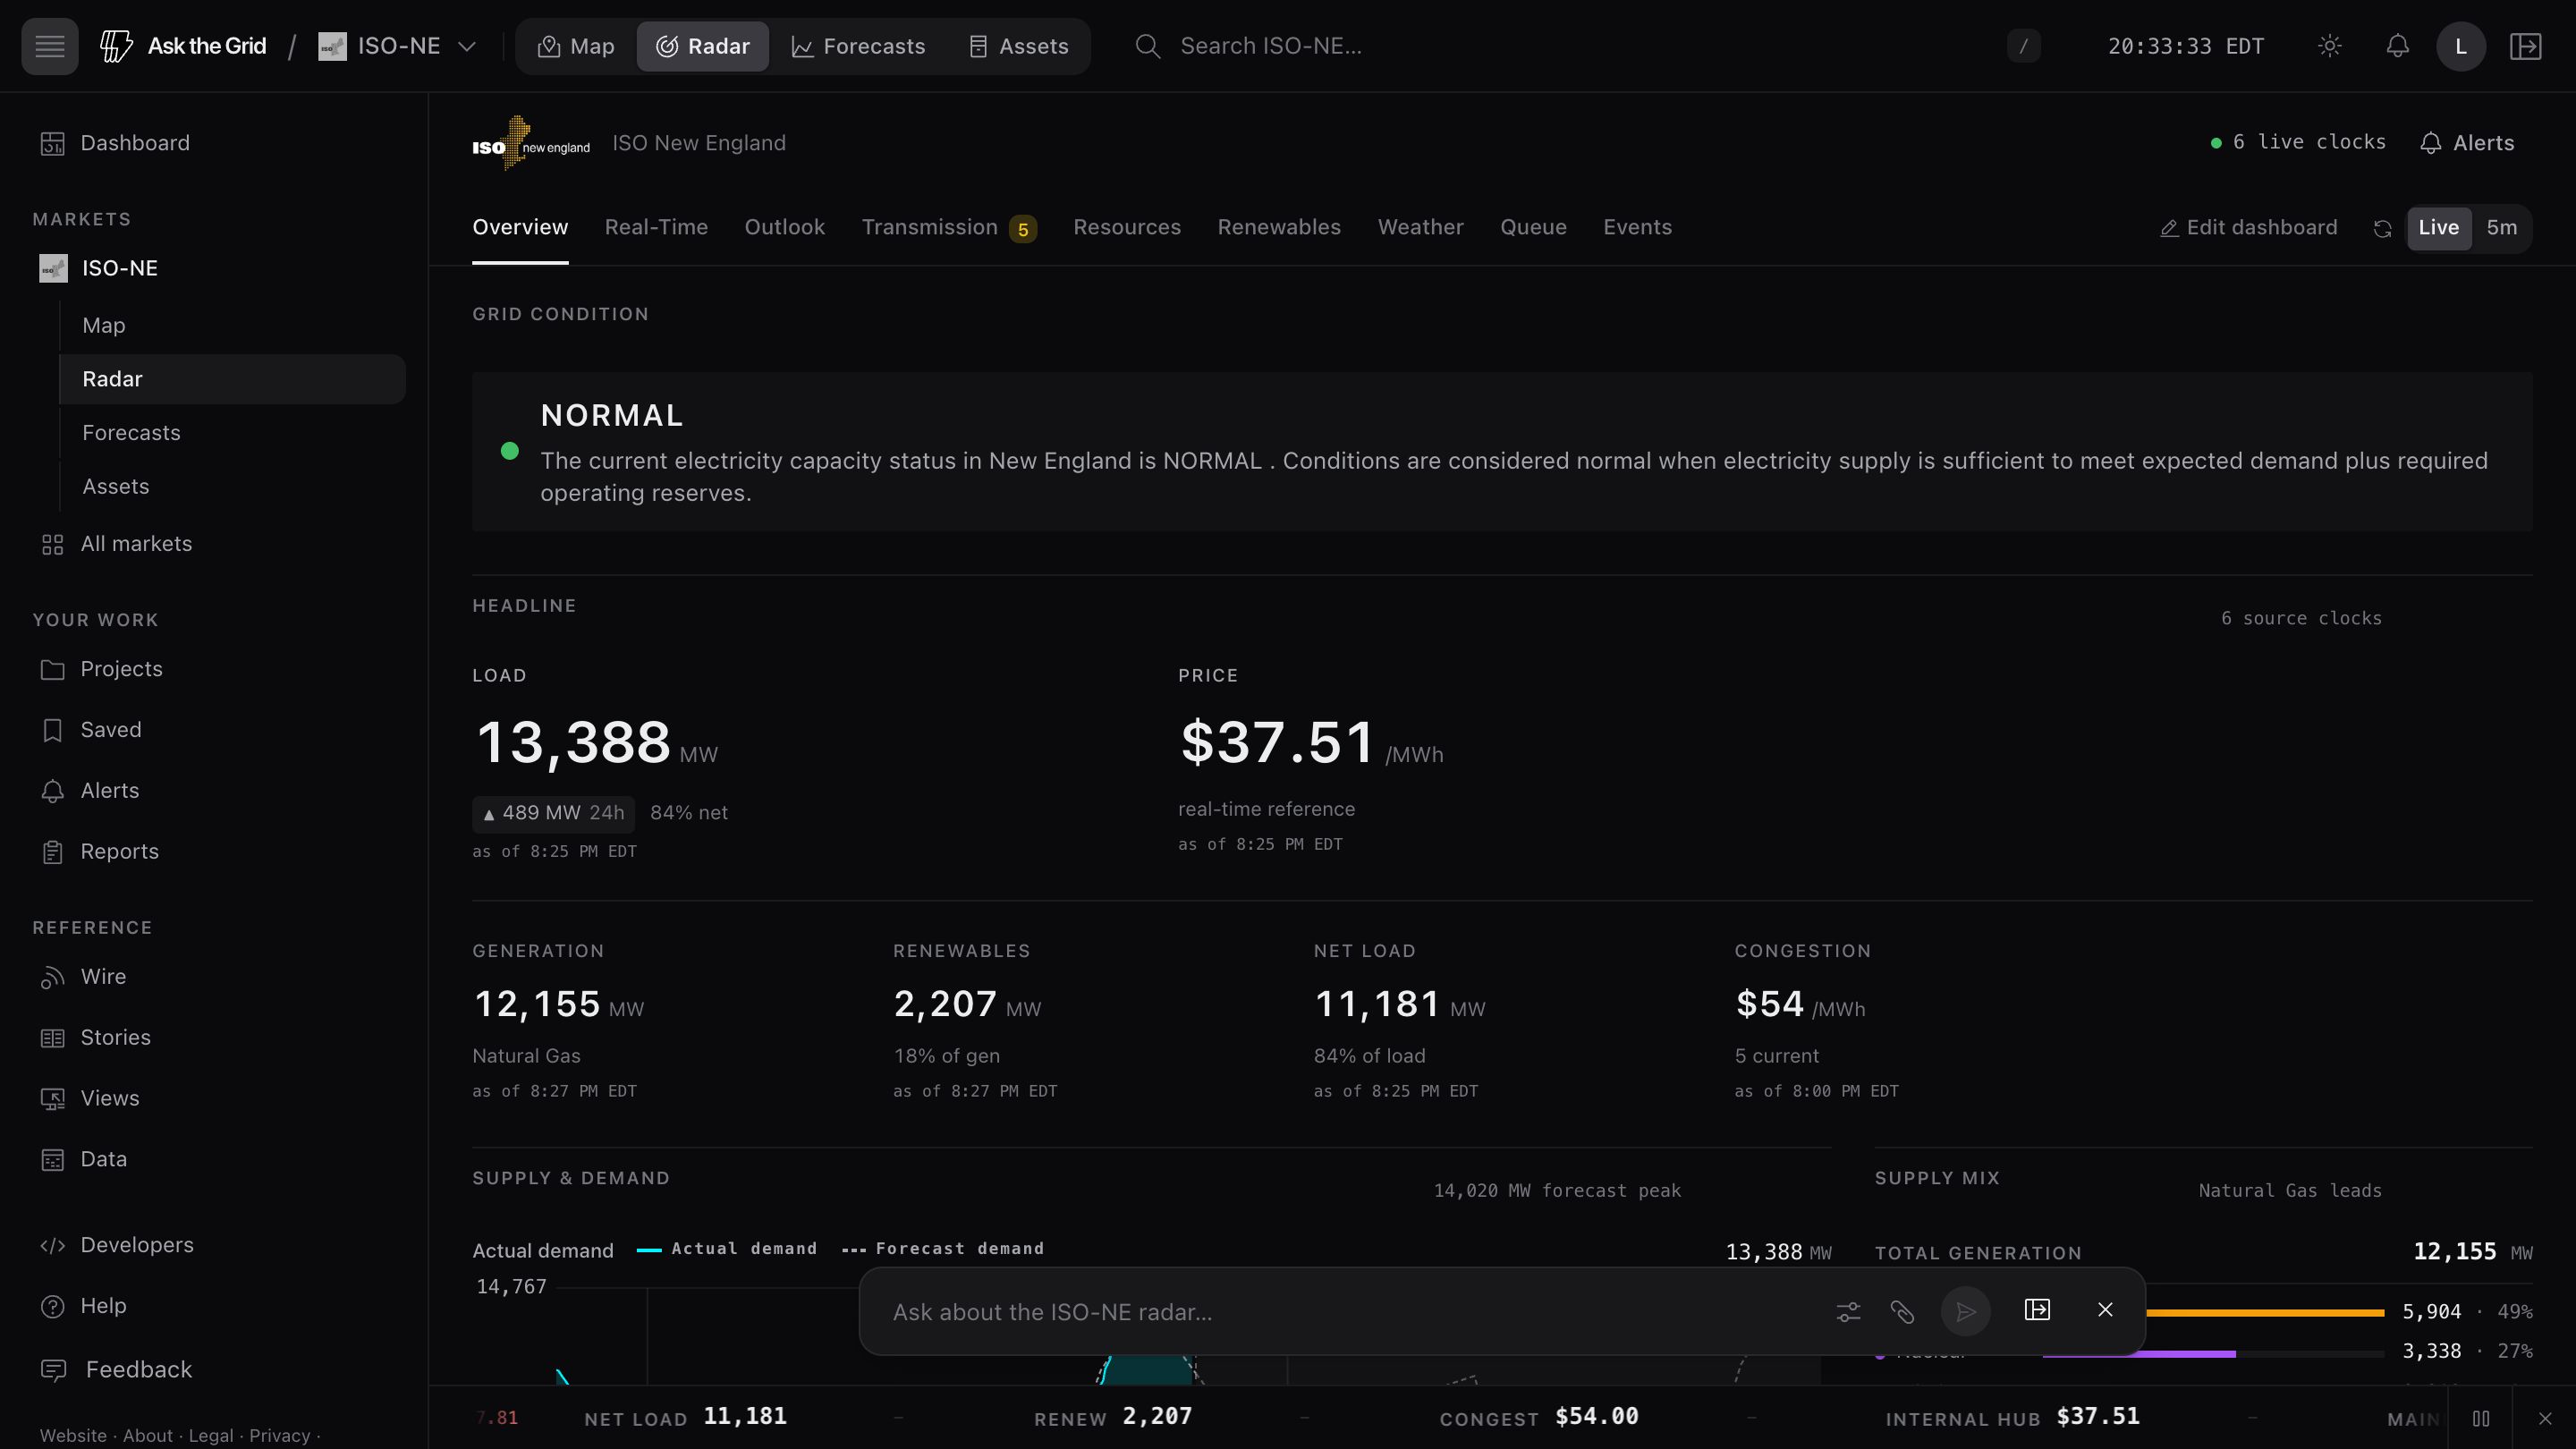
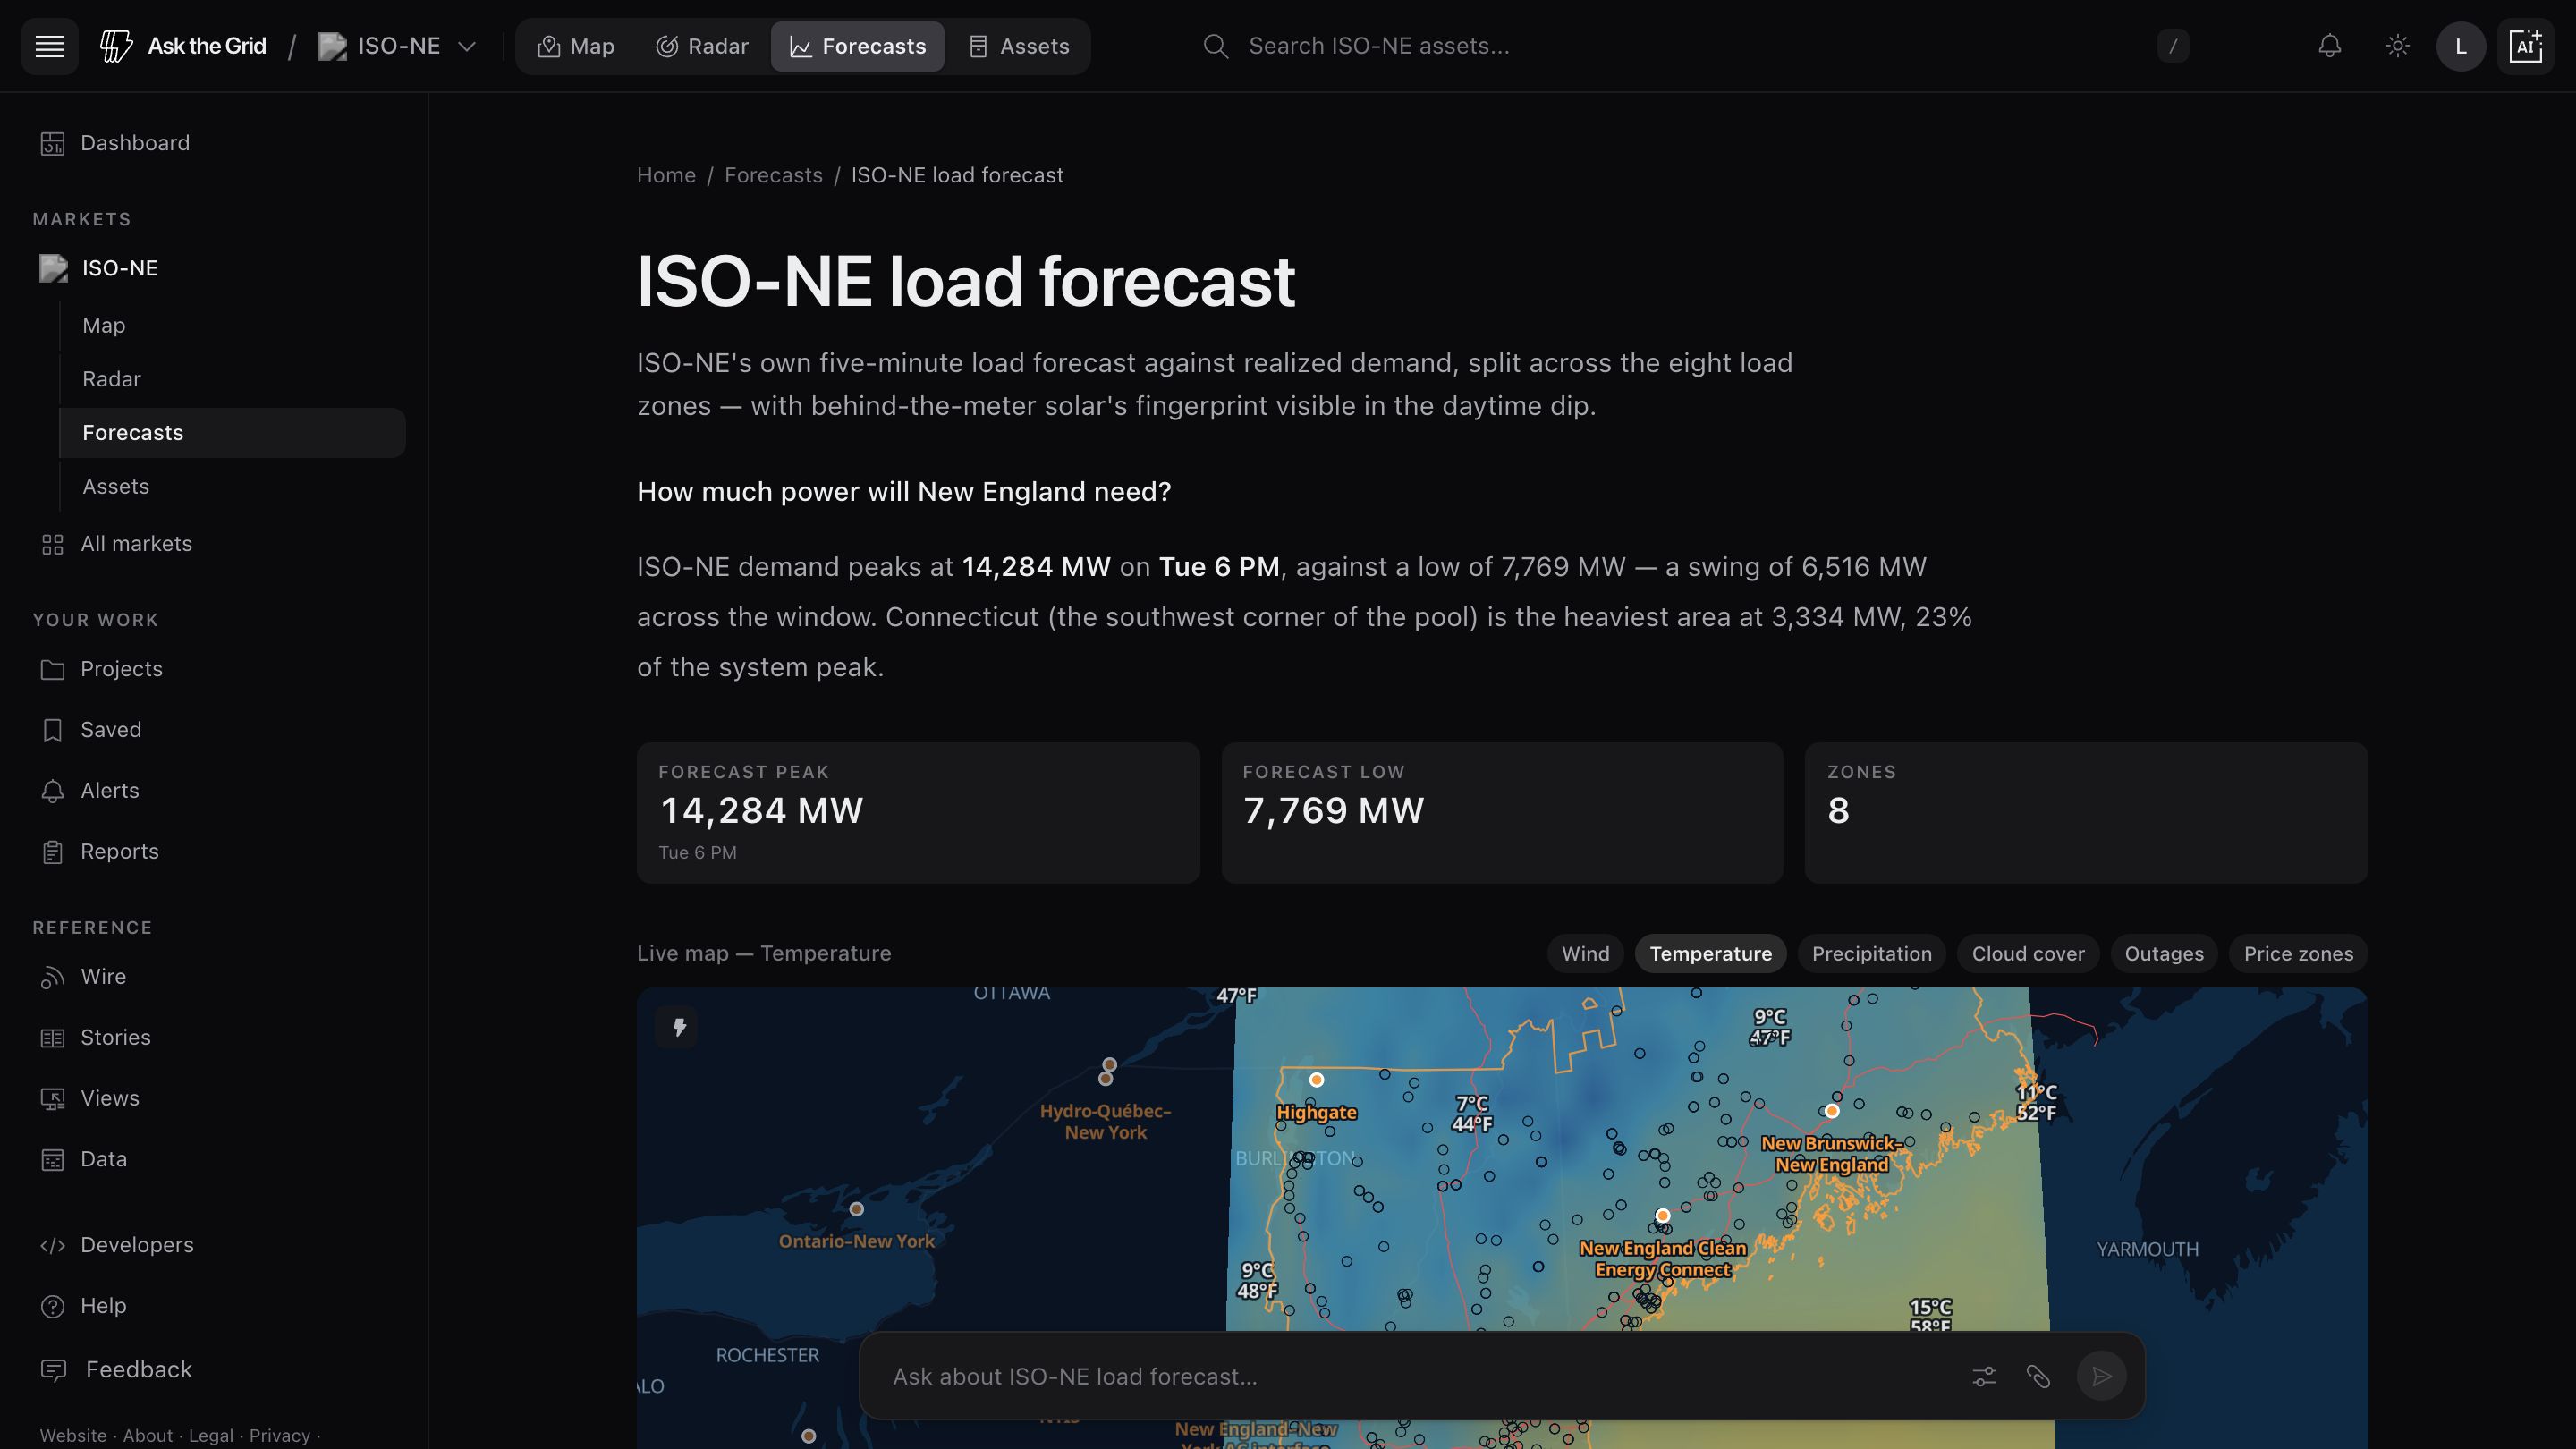
Read ISO-NE prices, demand and fuel conditions
ISO New England publishes prices for generator locations, load zones and its Internal Hub. Compare the same real-time interval across locations, and keep day-ahead results separate from the later operating outcome.
Demand, generation by fuel, interchange, weather and published constraints provide context for New England operations. Capacity declarations and OP-4 actions are operator procedures; customer outage reports are a separate source and measure.
Open the map to inspect pricing points and infrastructure, or investigate the published interconnection requests. Queue study milestones are preserved as published and do not establish a project's operating status.
Read the market's language
Full glossaryAsk ISO-NE what changed.
Open the live market and begin with a question, a place, or an interval.