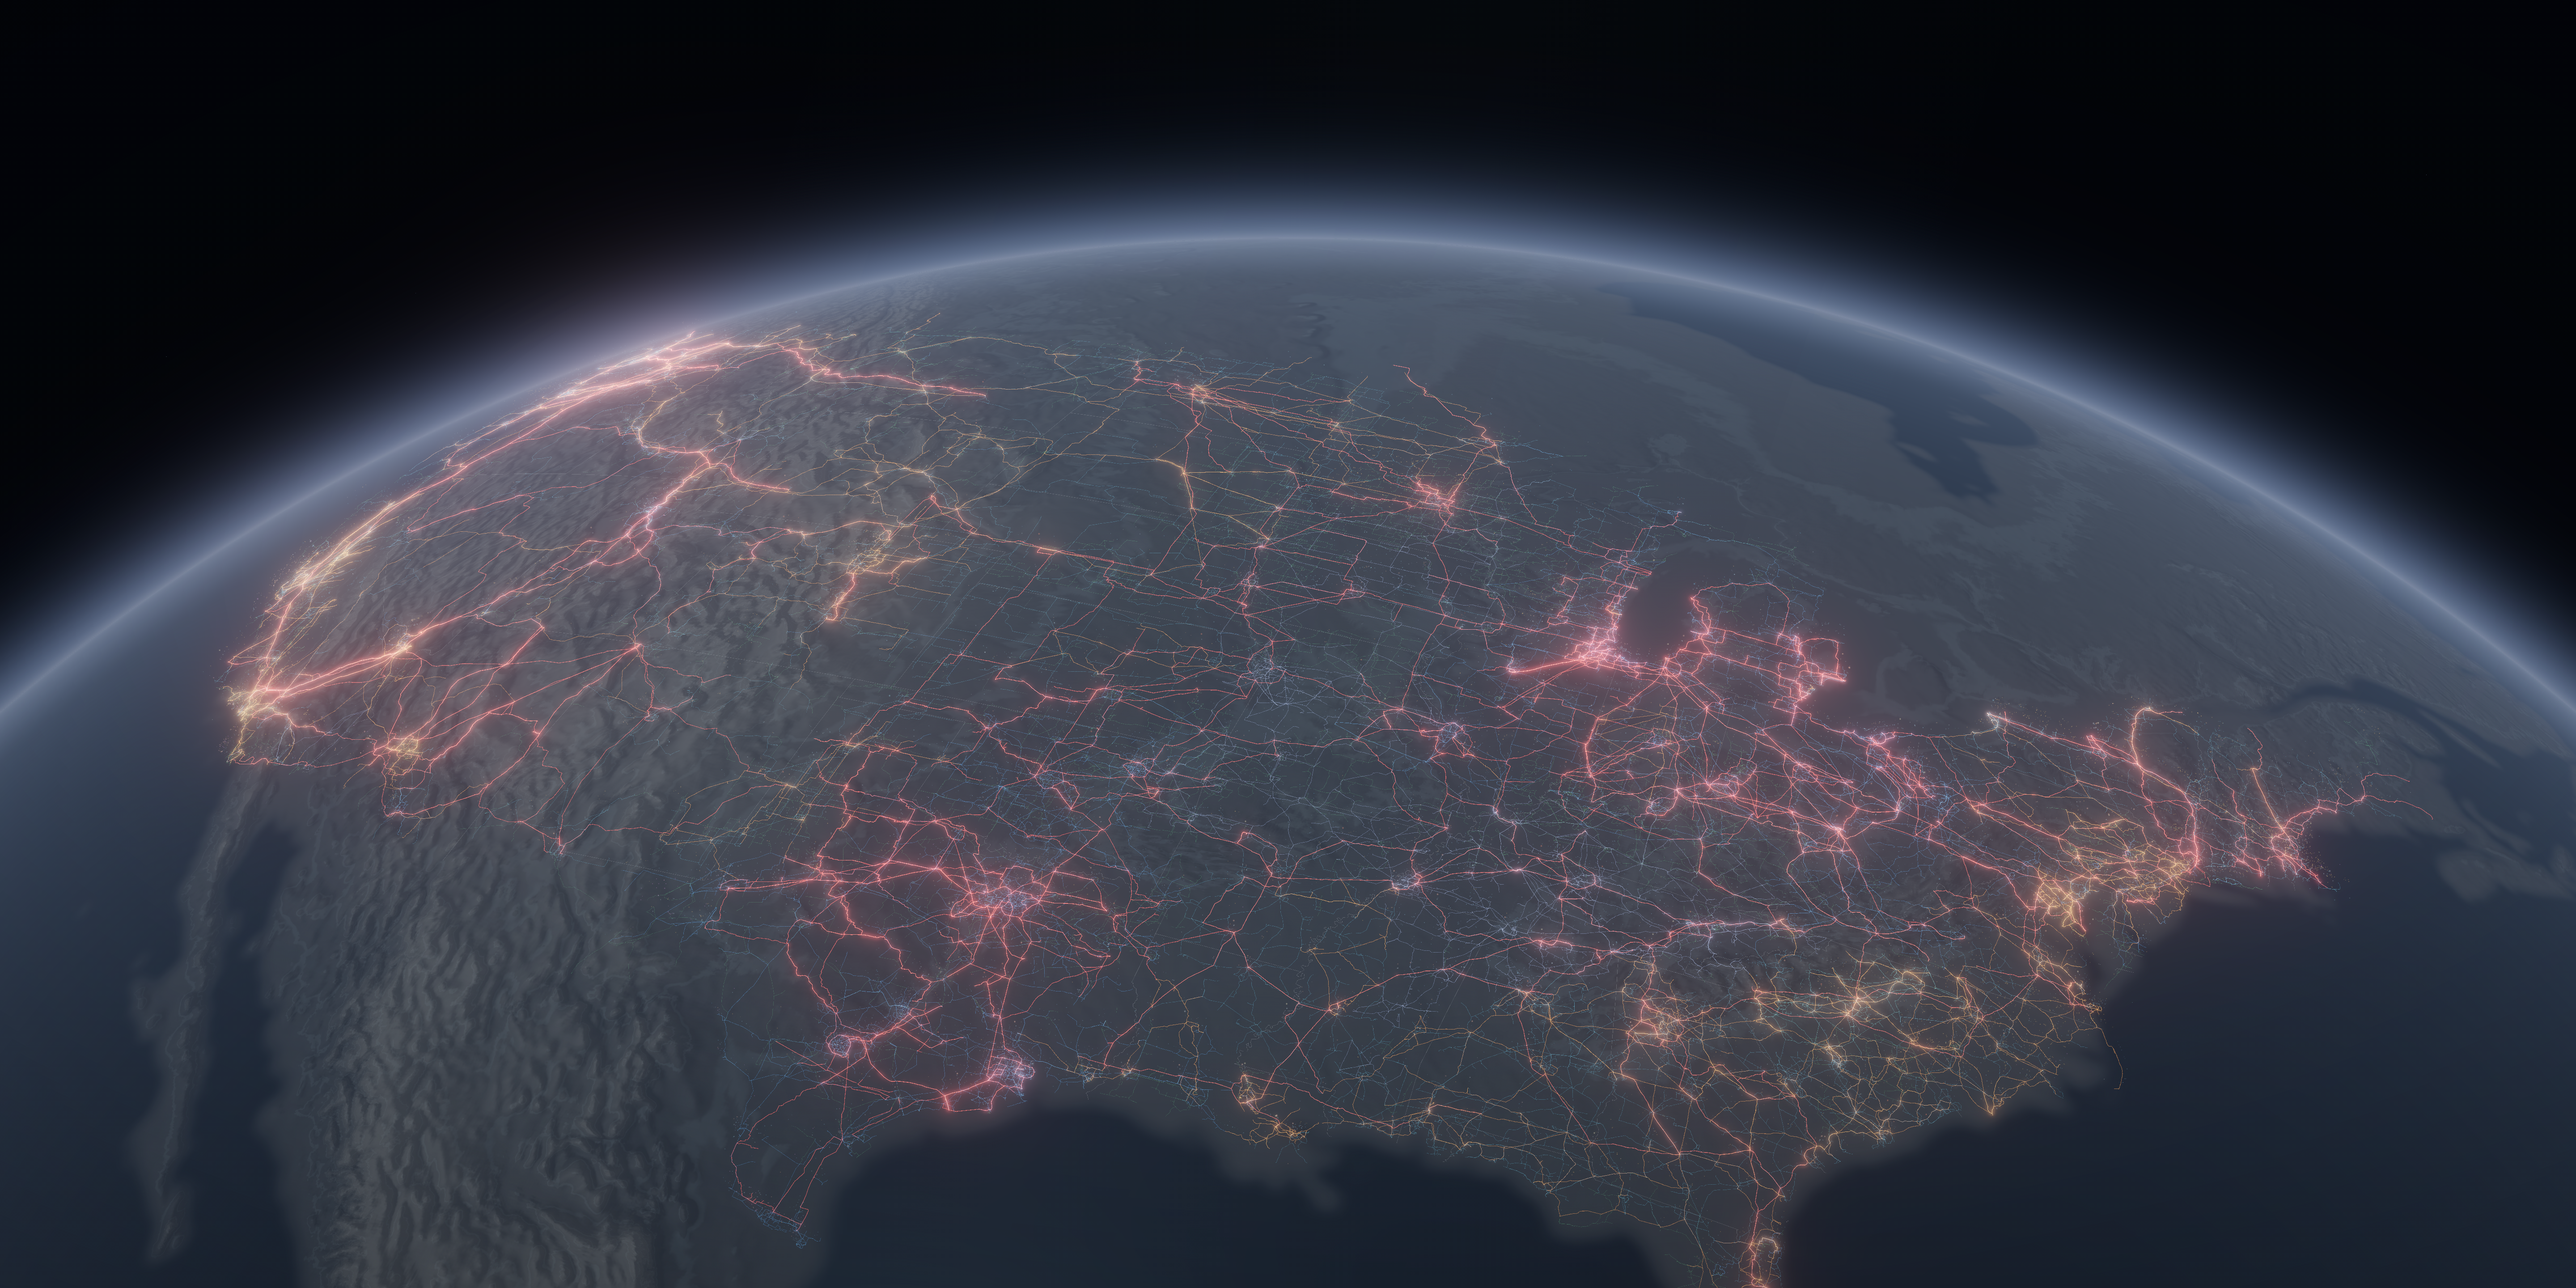
The U.S. electricity network, rendered from orbit.
A downloadable, high-resolution view of mapped transmission lines, high-voltage substations, and operating power plants across the contiguous United States.
- 74,190
- transmission records
- 51
- reported voltage values
- 19,762
- high-voltage substations
- 13,640
- operating plant locations
This visualization combines public infrastructure and terrain data in a single orbital frame. It draws 74,190 HIFLD transmission-line records with positive reported voltage. Line color follows 51 reported values from 3 kV to 1,000 kV, while width and brightness increase with voltage.
The point lights add 19,762 high-voltage substation records and 13,640 plant locations assembled from EIA-860 operating-generator records. The globe, atmosphere, lighting, and bloom are stylized; the infrastructure comes from public source snapshots, with line geometry simplified at nation scale for legibility.
Explore the data behind the image.
Open each source in the Ask the Grid catalog to inspect its coverage, fields, provenance, and live sample.
Method and sources+
The transmission layer uses the August 5, 2026 HIFLD snapshot, filtered to the contiguous-U.S. render bounds, usable geometry, and positive reported voltage. Records with only a voltage class or no usable voltage value are not rendered. Source vertices were simplified at roughly 2 km tolerance, producing 409,360 rendered line segments.
Substation lights use HIFLD records with reported maximum voltage of at least 138 kV. Plant points group the April 2026 EIA-860 operating-generator snapshot by plant ID; size reflects summed nameplate capacity and color reflects the energy source of the largest operating generator at each plant.
Terrain comes from Mapterhorn Terrarium elevation tiles. State and national topology comes from us-atlas, and the land-water mask uses Natural Earth 1:50m data. The scene is rendered locally in Three.js with a perspective globe, atmospheric scattering, lighting, and bloom.
This is a static geographic visualization of those source snapshots. It does not show real-time power flows, constraints, outages, or grid operating state.