ERCOT load zones map and real-time prices
Locate ERCOT's eight load zones and compare their latest real-time prices with the trading hubs. Open the zone map to explore Houston, North, South, West and the four other load zones.
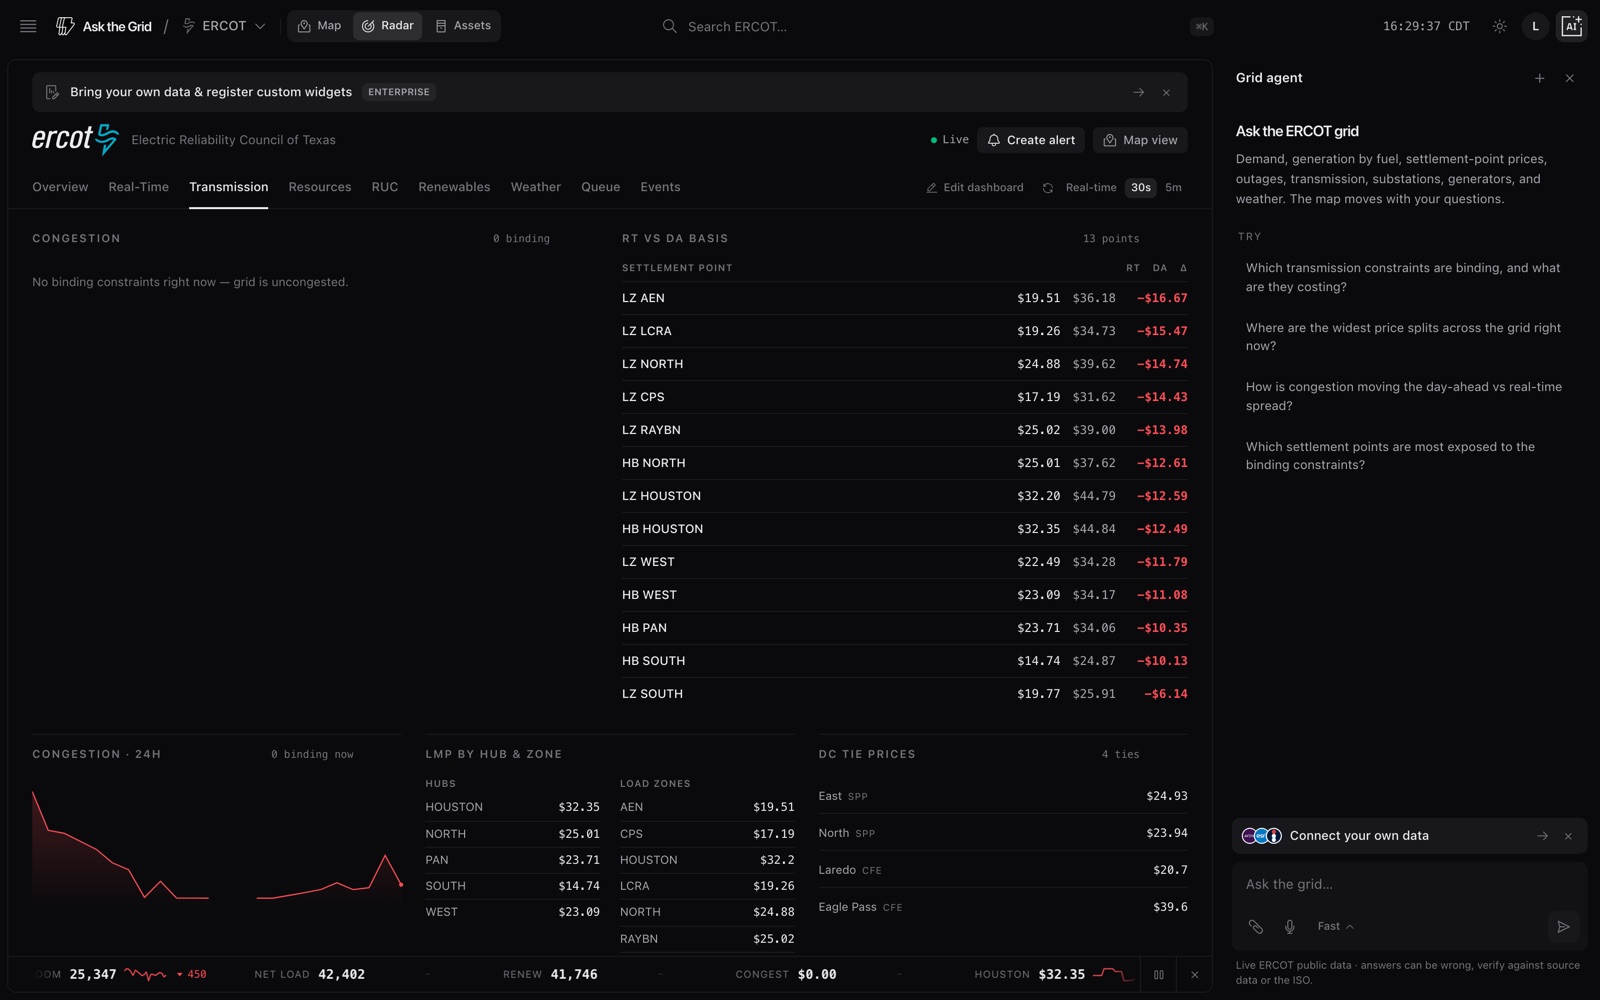
See it on the live ERCOT map, updating as the market publishes.
Explore the ERCOT zone mapAbout this view
What a load zone is
A load zone is the area ERCOT uses to price the electricity consumed in it. Four are geographic: Houston, North, South and West. Four belong to municipal and cooperative utilities: Austin Energy (AEN), CPS Energy, LCRA and Rayburn (RAYBN). Each zone's price is the load-weighted average of the prices at the buses inside it.
Load zones are not weather zones
ERCOT also splits Texas into eight weather zones for load forecasting. Some share names with load zones but not boundaries. Prices settle by load zone; demand is forecast by weather zone.
Questions
How many load zones does ERCOT have?
Eight: Houston, North, South and West, plus the Austin Energy, CPS Energy, LCRA and Rayburn zones of the utilities that settle on their own.
What are ERCOT's trading hubs?
Houston, North, South, West and Panhandle, plus the hub average and hub bus average ERCOT publishes beside them. Hubs are trading points; load zones are where consumption settles.
Is this the day-ahead or real-time price?
Real time: the latest settlement point price ERCOT has published for each load zone and hub, in $/MWh.
Why do load zone prices differ?
Transmission limits. When power cannot flow freely between regions, the zones on the constrained side price higher, and the spread between zones shows where the grid is tight.