
ERCOT Texas grid conditions and prices
Electric Reliability Council of Texas · Texas
Explore the Texas power grid with ERCOT real-time prices, demand, generation and forecasts. Open the map to compare nodes and hubs, inspect infrastructure and ask the agent about the grid conditions you find.
ERCOT on the live map
LiveWhat you can ask ERCOT
Open the agentClick any question to open it in the live agent with the market already selected. The answer keeps its sources attached.
What's live here
Every dataset, sourced16 coverage areas live today. Each row is backed by named source feeds in the public data catalog — cadence and provenance included.
| Coverage | Detail | Cadence | Status |
|---|---|---|---|
| Real-time LMPs | Settlement points, hubs, and load zones — plus every electrical bus (the finest public price view of the grid) | 5-min (SCED) | Live |
| Day-ahead market | DAM settlement point prices, day-ahead system lambda, total energy and ancillary volumes cleared | Hourly (DAM) | Live |
| Congestion & constraints | SCED shadow prices with named binding constraints, real-time system lambda for congestion components, CRR monthly auction results | 5-min / monthly | Live |
| Demand | Real-time supply-demand dashboard, 15-minute system-wide demand, hourly load by the eight weather zones | 5-min – hourly | Live |
| Load forecasts | Seven-day mid-term load forecast by weather zone with hourly vintages, plus intraday forecast-vs-actual | Hourly vintages | Live |
| Fuel mix | Live generation by fuel — gas, wind, solar, nuclear, coal, hydro, storage, other | 5-min | Live |
| Wind & solar by region | Regional actuals with successive forecast vintages (STPPF, PVGRPP, COP HSL) for ramp and forecast-error analysis | Hourly | Live |
| Outages & commitments | Generation outage dashboard, hourly resource outage capacity by weather zone, planned outage limits, RUC-committed capacity | 5-min – hourly | Live |
| Ancillary services | DAM clearing prices and cleared volumes for RegUp, RegDown, RRS, ECRS, and Non-Spin | Hourly (DAM) | Live |
| 60-day disclosures | Per-unit SCED dispatch, telemetered output, limits, and AS responsibility for every generation and load resource | 5-min, 60-day lag | Live |
| Interconnection queue | Large-generation queue snapshots — developer, technology, MW, POI, status, and dates from ERCOT's GIS report | Monthly snapshot | Live |
| Grid events & notices | ERCOT event notices rendered on the live map as they post | As published | Live |
| Radar cockpit | The live monitoring board — fuel mix, hub and zone LMPs, binding constraints, system conditions on one wall | 30-second refresh | Live |
| Assets | Plant profiles built on EIA-860 registrations and HIFLD infrastructure — generators, substations, transmission lines | Reference | Live |
| Weather | ERA5 reanalysis history and forecast grids across the footprint, joined to load and generation | Hourly | Live |
| County outages | Live distribution-level outage counts by Texas county (ODIN) | Rolling | Live |
ERCOT Morning Briefing
A daily ERCOT market report delivered by email and kept on Ask the Grid, covering today’s load outlook, hub prices, risk hours, weather, outages, operator notices, and new market context.
Today’s first question
Where is ERCOT demand headed today, and which hours carry the most risk?
Delivery
Every issue by email and on Ask the Grid
Inside
Load, prices, weather, outages, notices, and watch hours
Availability
Published daily at 8:00 AM Central and kept in the archive
Live intelligence for ERCOT
Browse every live viewEverything Ask the Grid publishes on ERCOT, in one place — what the grid is doing now, where it is headed, and what has been written about it.
Live views
Forecasts and outlooks
Coverage and analysis
Data and access
ERCOT power plant registry
ERCOT’s EIA-anchored plant registry is searchable by operator, technology, and county, with capacity ranked and source-backed profiles for selected facilities.
Registry assets
975ERCOT plant records
EIA nameplate capacity
176GW
Detailed profiles
347Source-backed pages
The product, as it runs
Recorded from the live product, with this market's data.
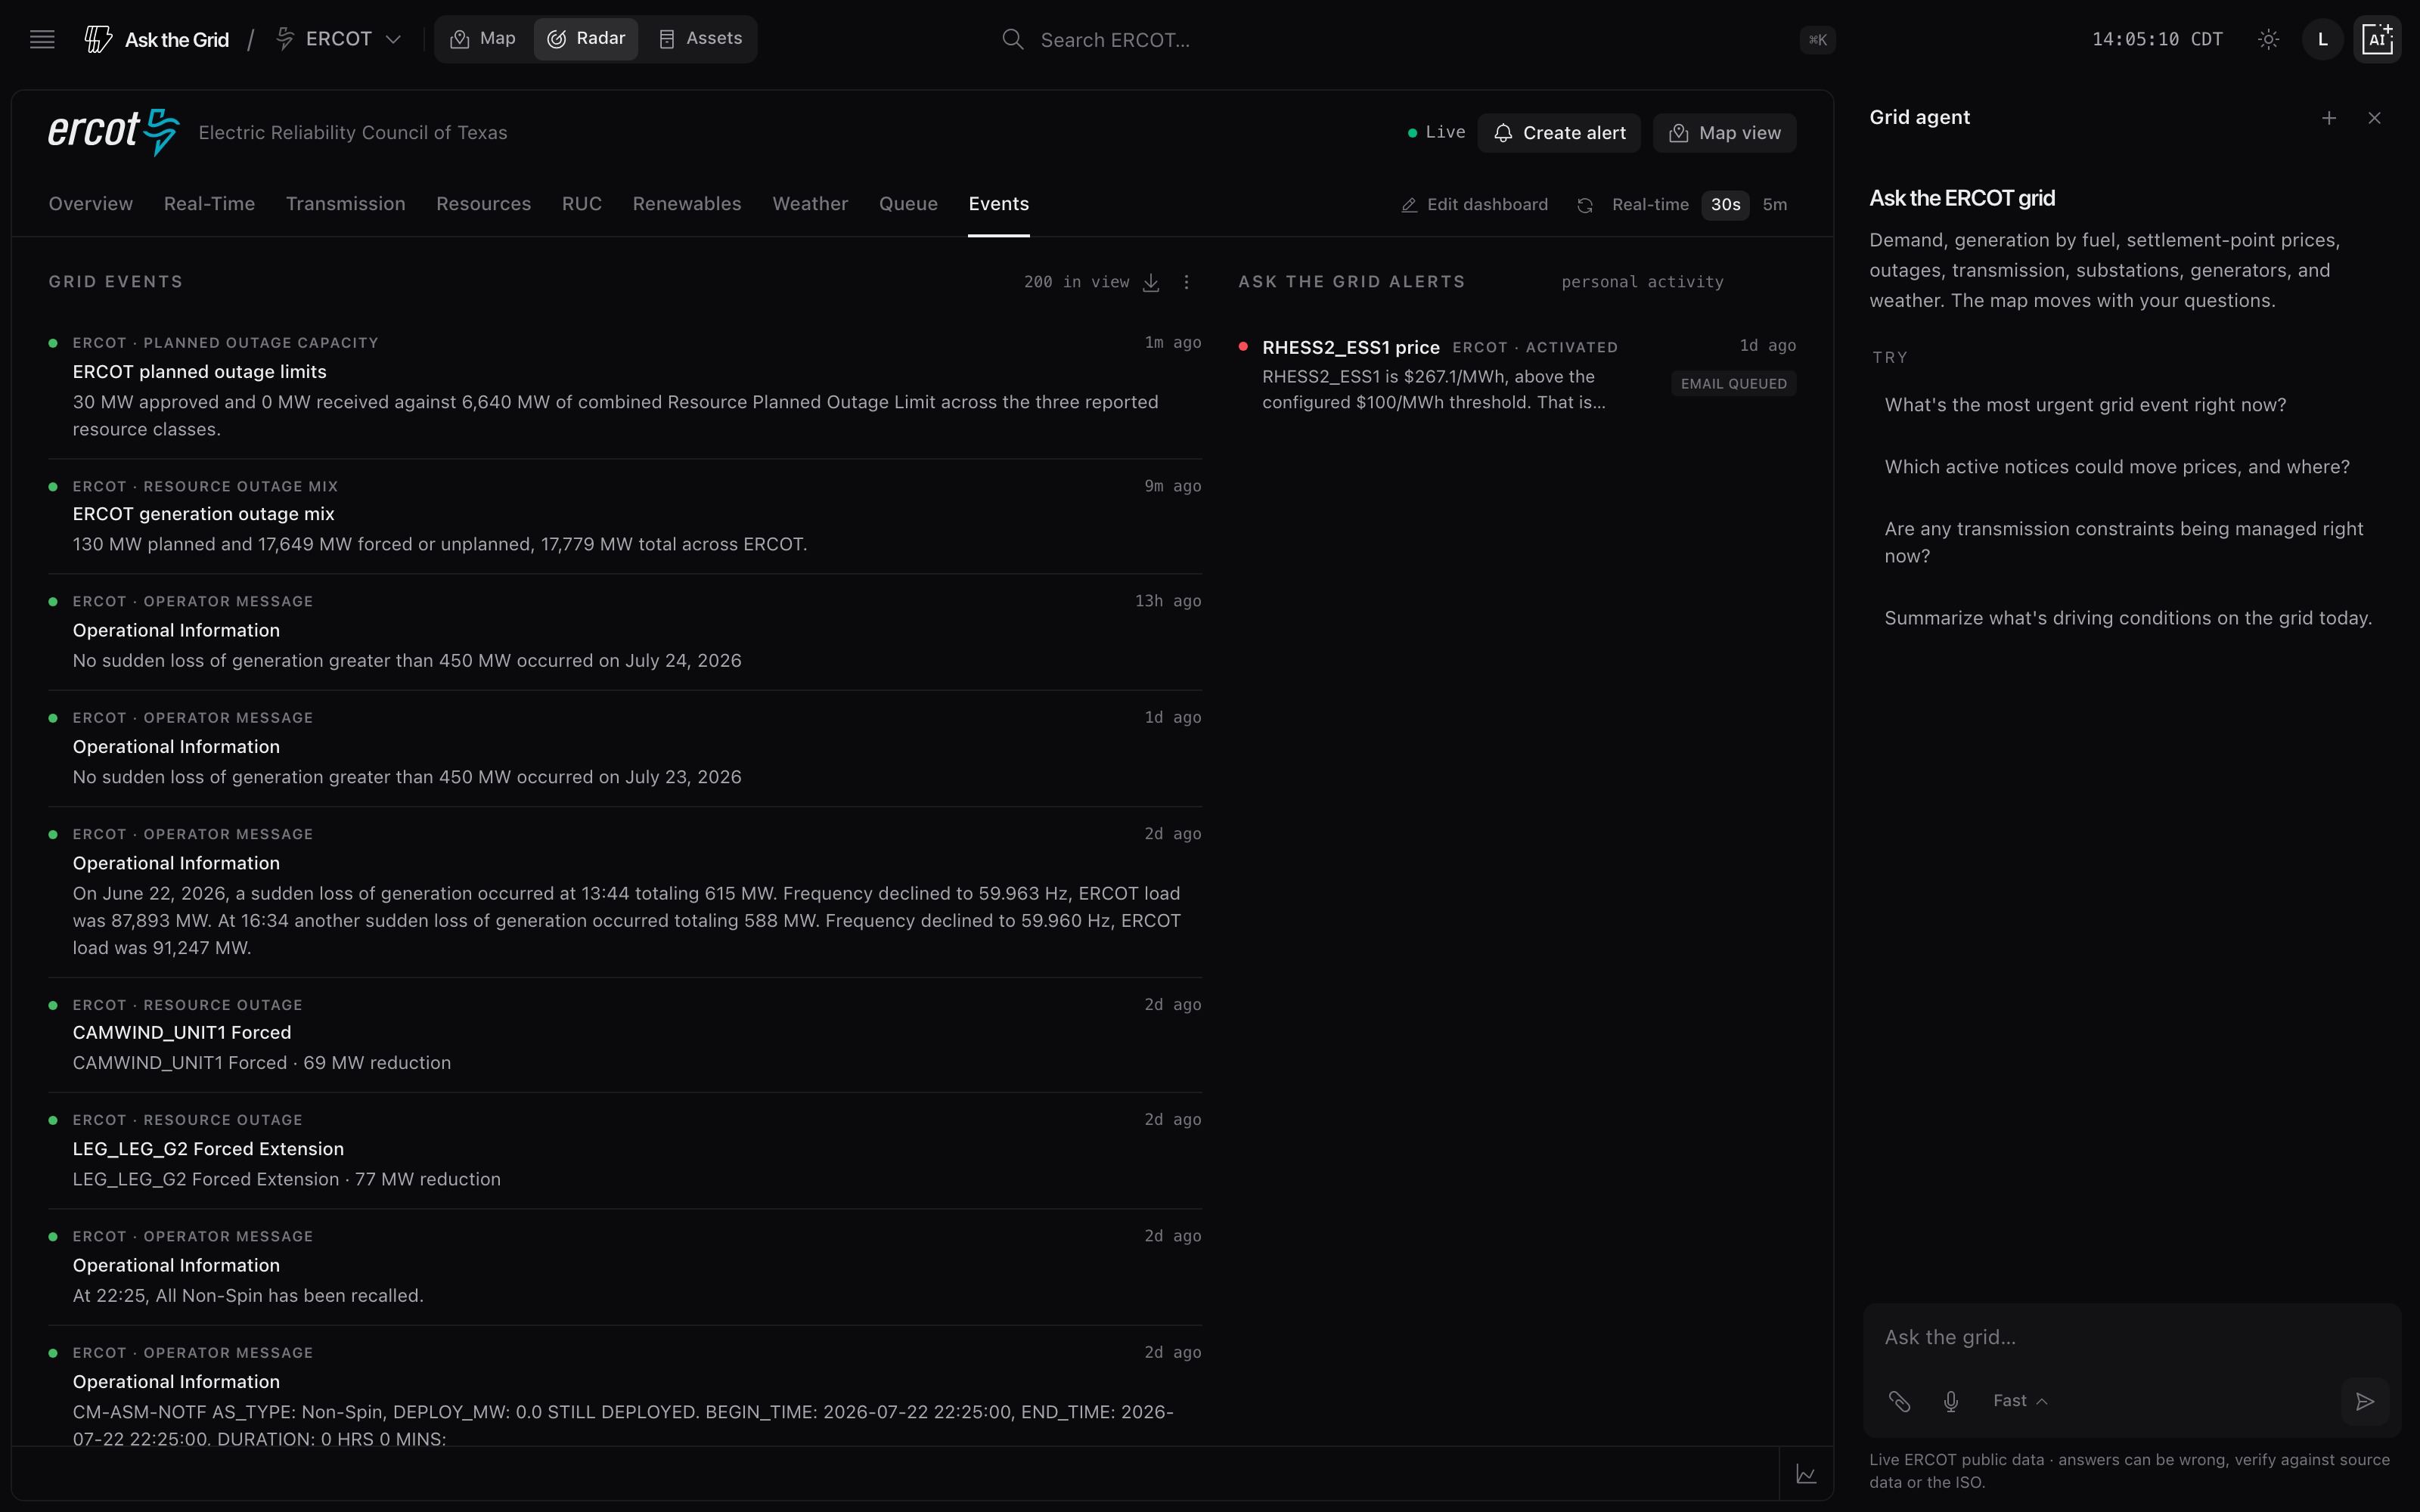
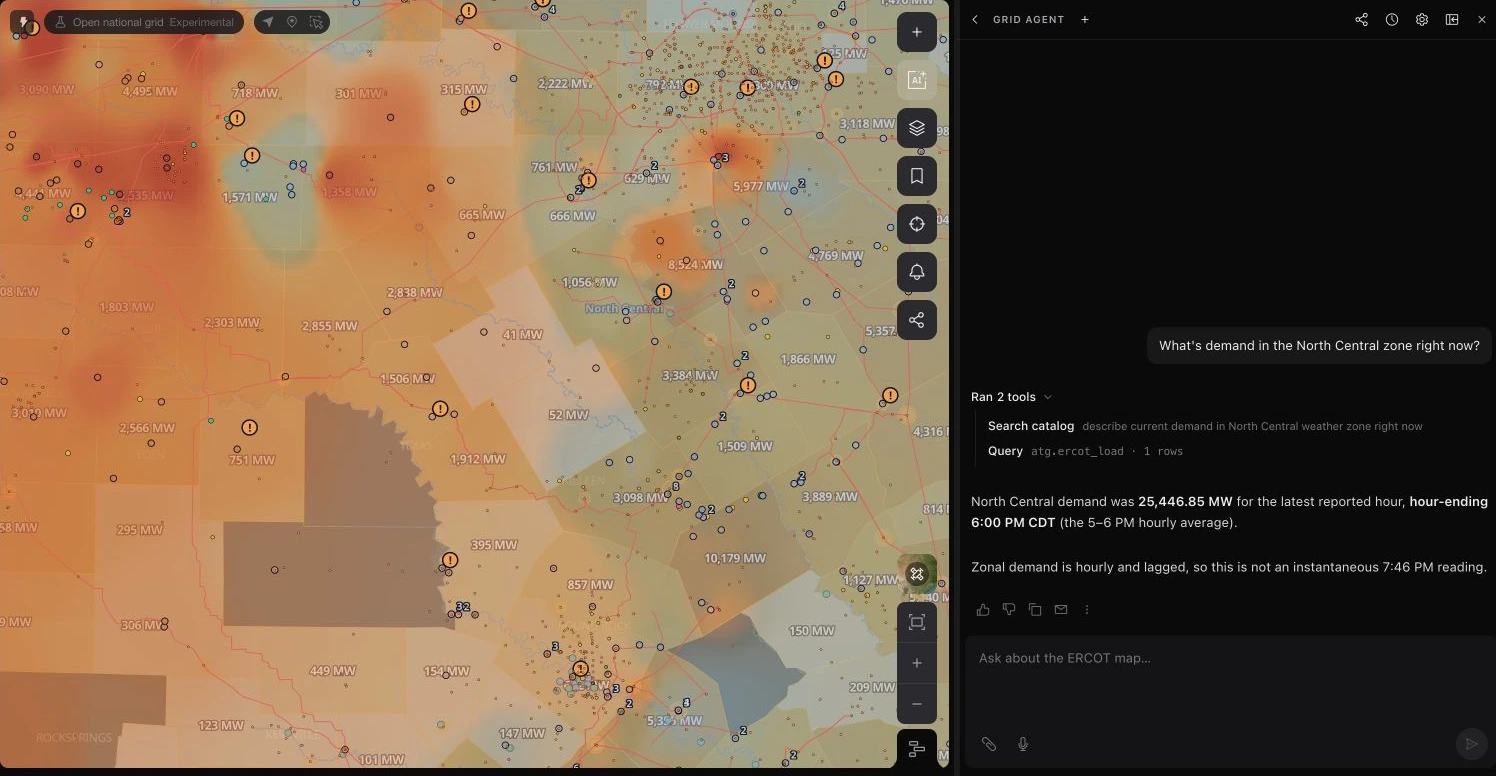
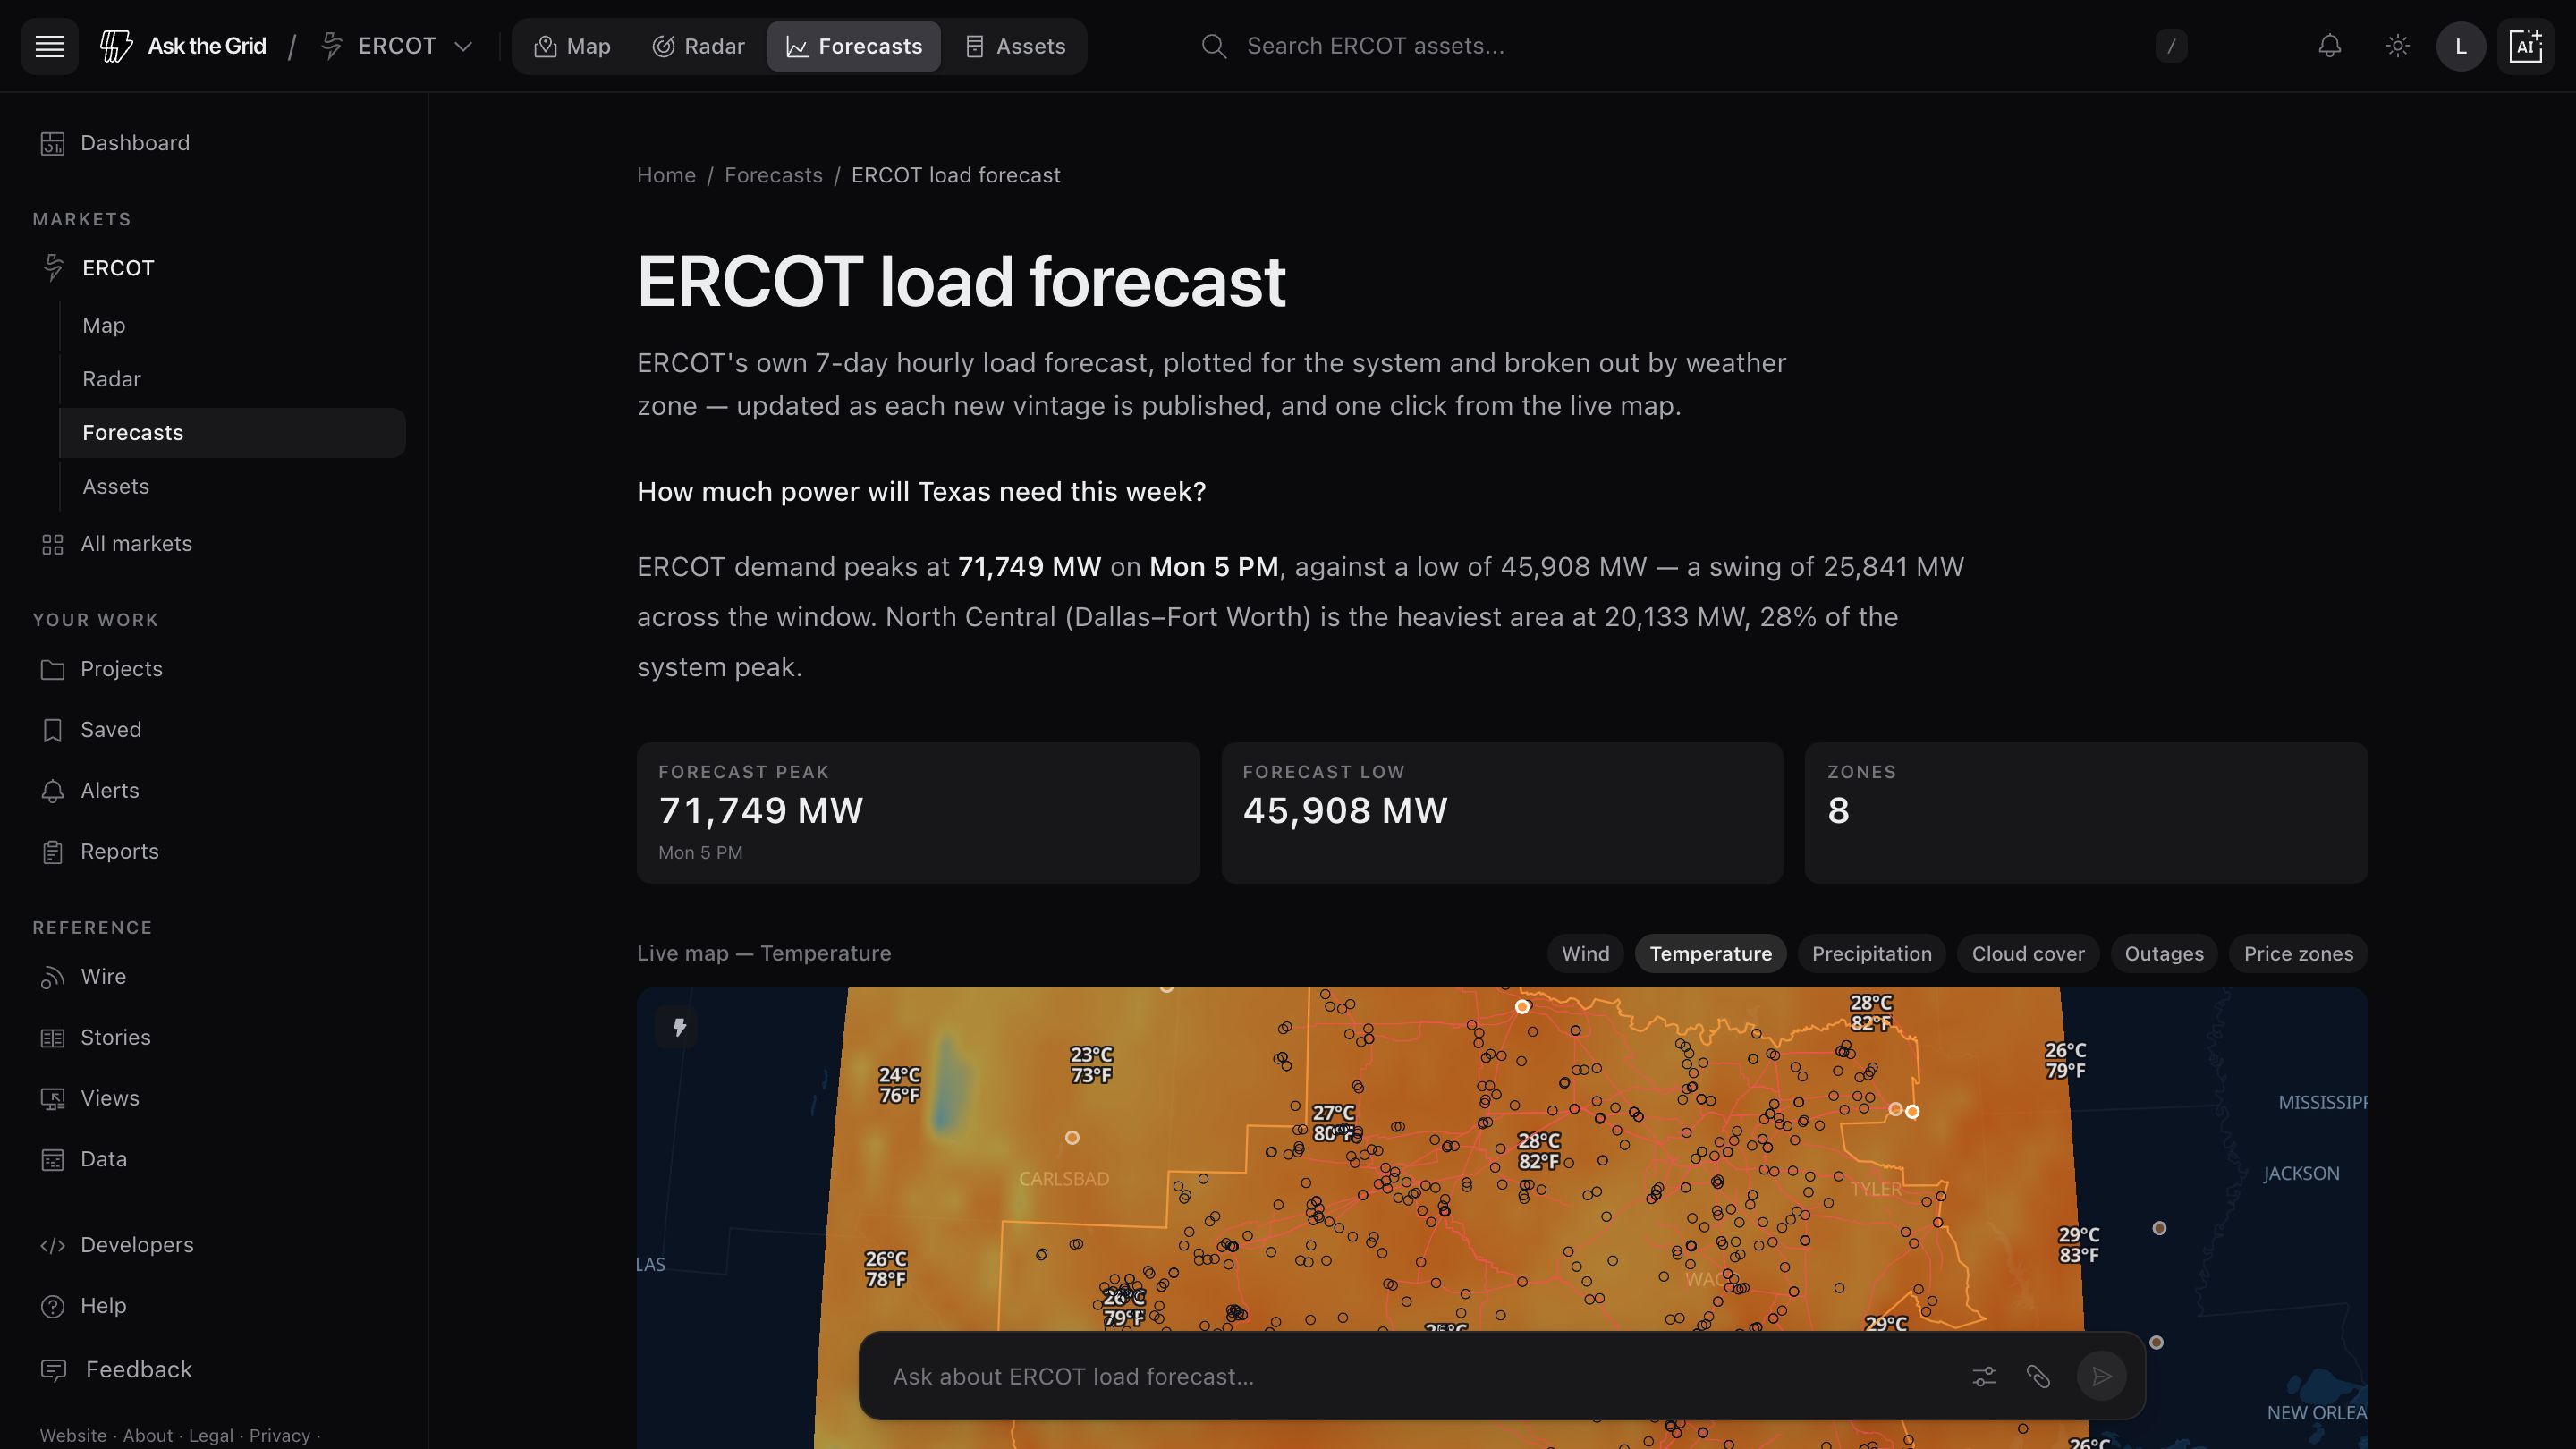
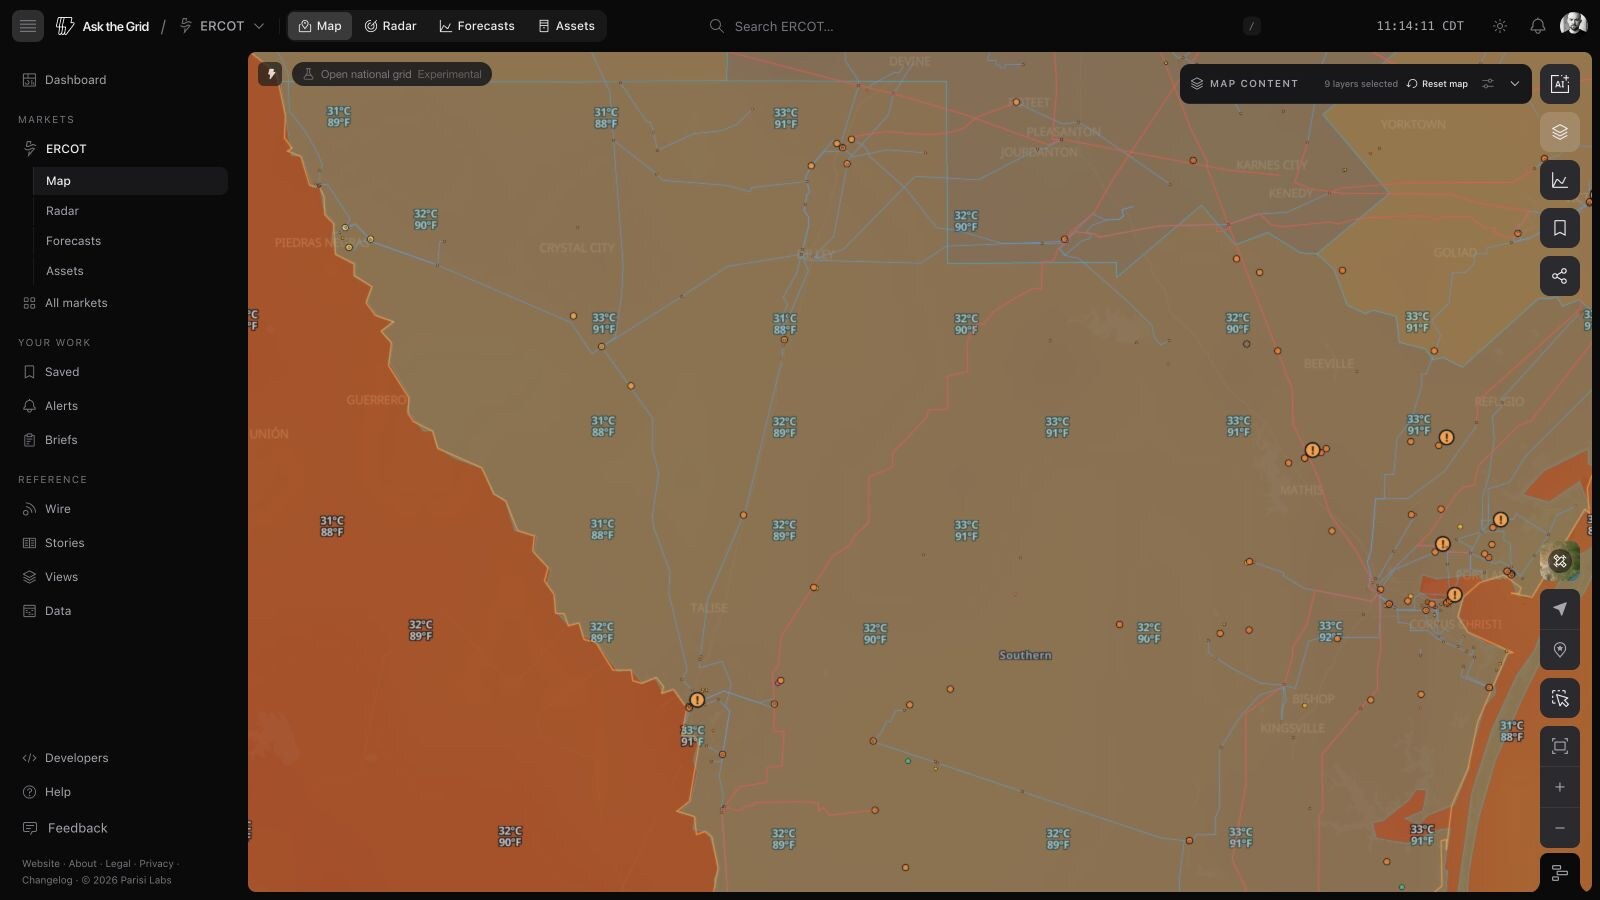
Read ERCOT prices, demand and constraints
ERCOT's real-time price map shows published locational marginal prices at resource nodes, load zones and hubs. Compare locations at the same interval, then use the day-ahead series to examine how the operating outcome differed from the earlier market result.
Read demand, wind, solar, storage and generation outages alongside prices. ERCOT's constraint publications name binding constraints and their shadow prices; a high LMP alone does not identify which constraint caused it.
Use the map for a location, Radar for a monitoring desk, or the agent for a sourced question. Historical resource disclosures retain their publication lag, so a delayed unit record is kept distinct from current operating data.
Ask ERCOT what changed.
Open the live market and begin with a question, a place, or an interval.