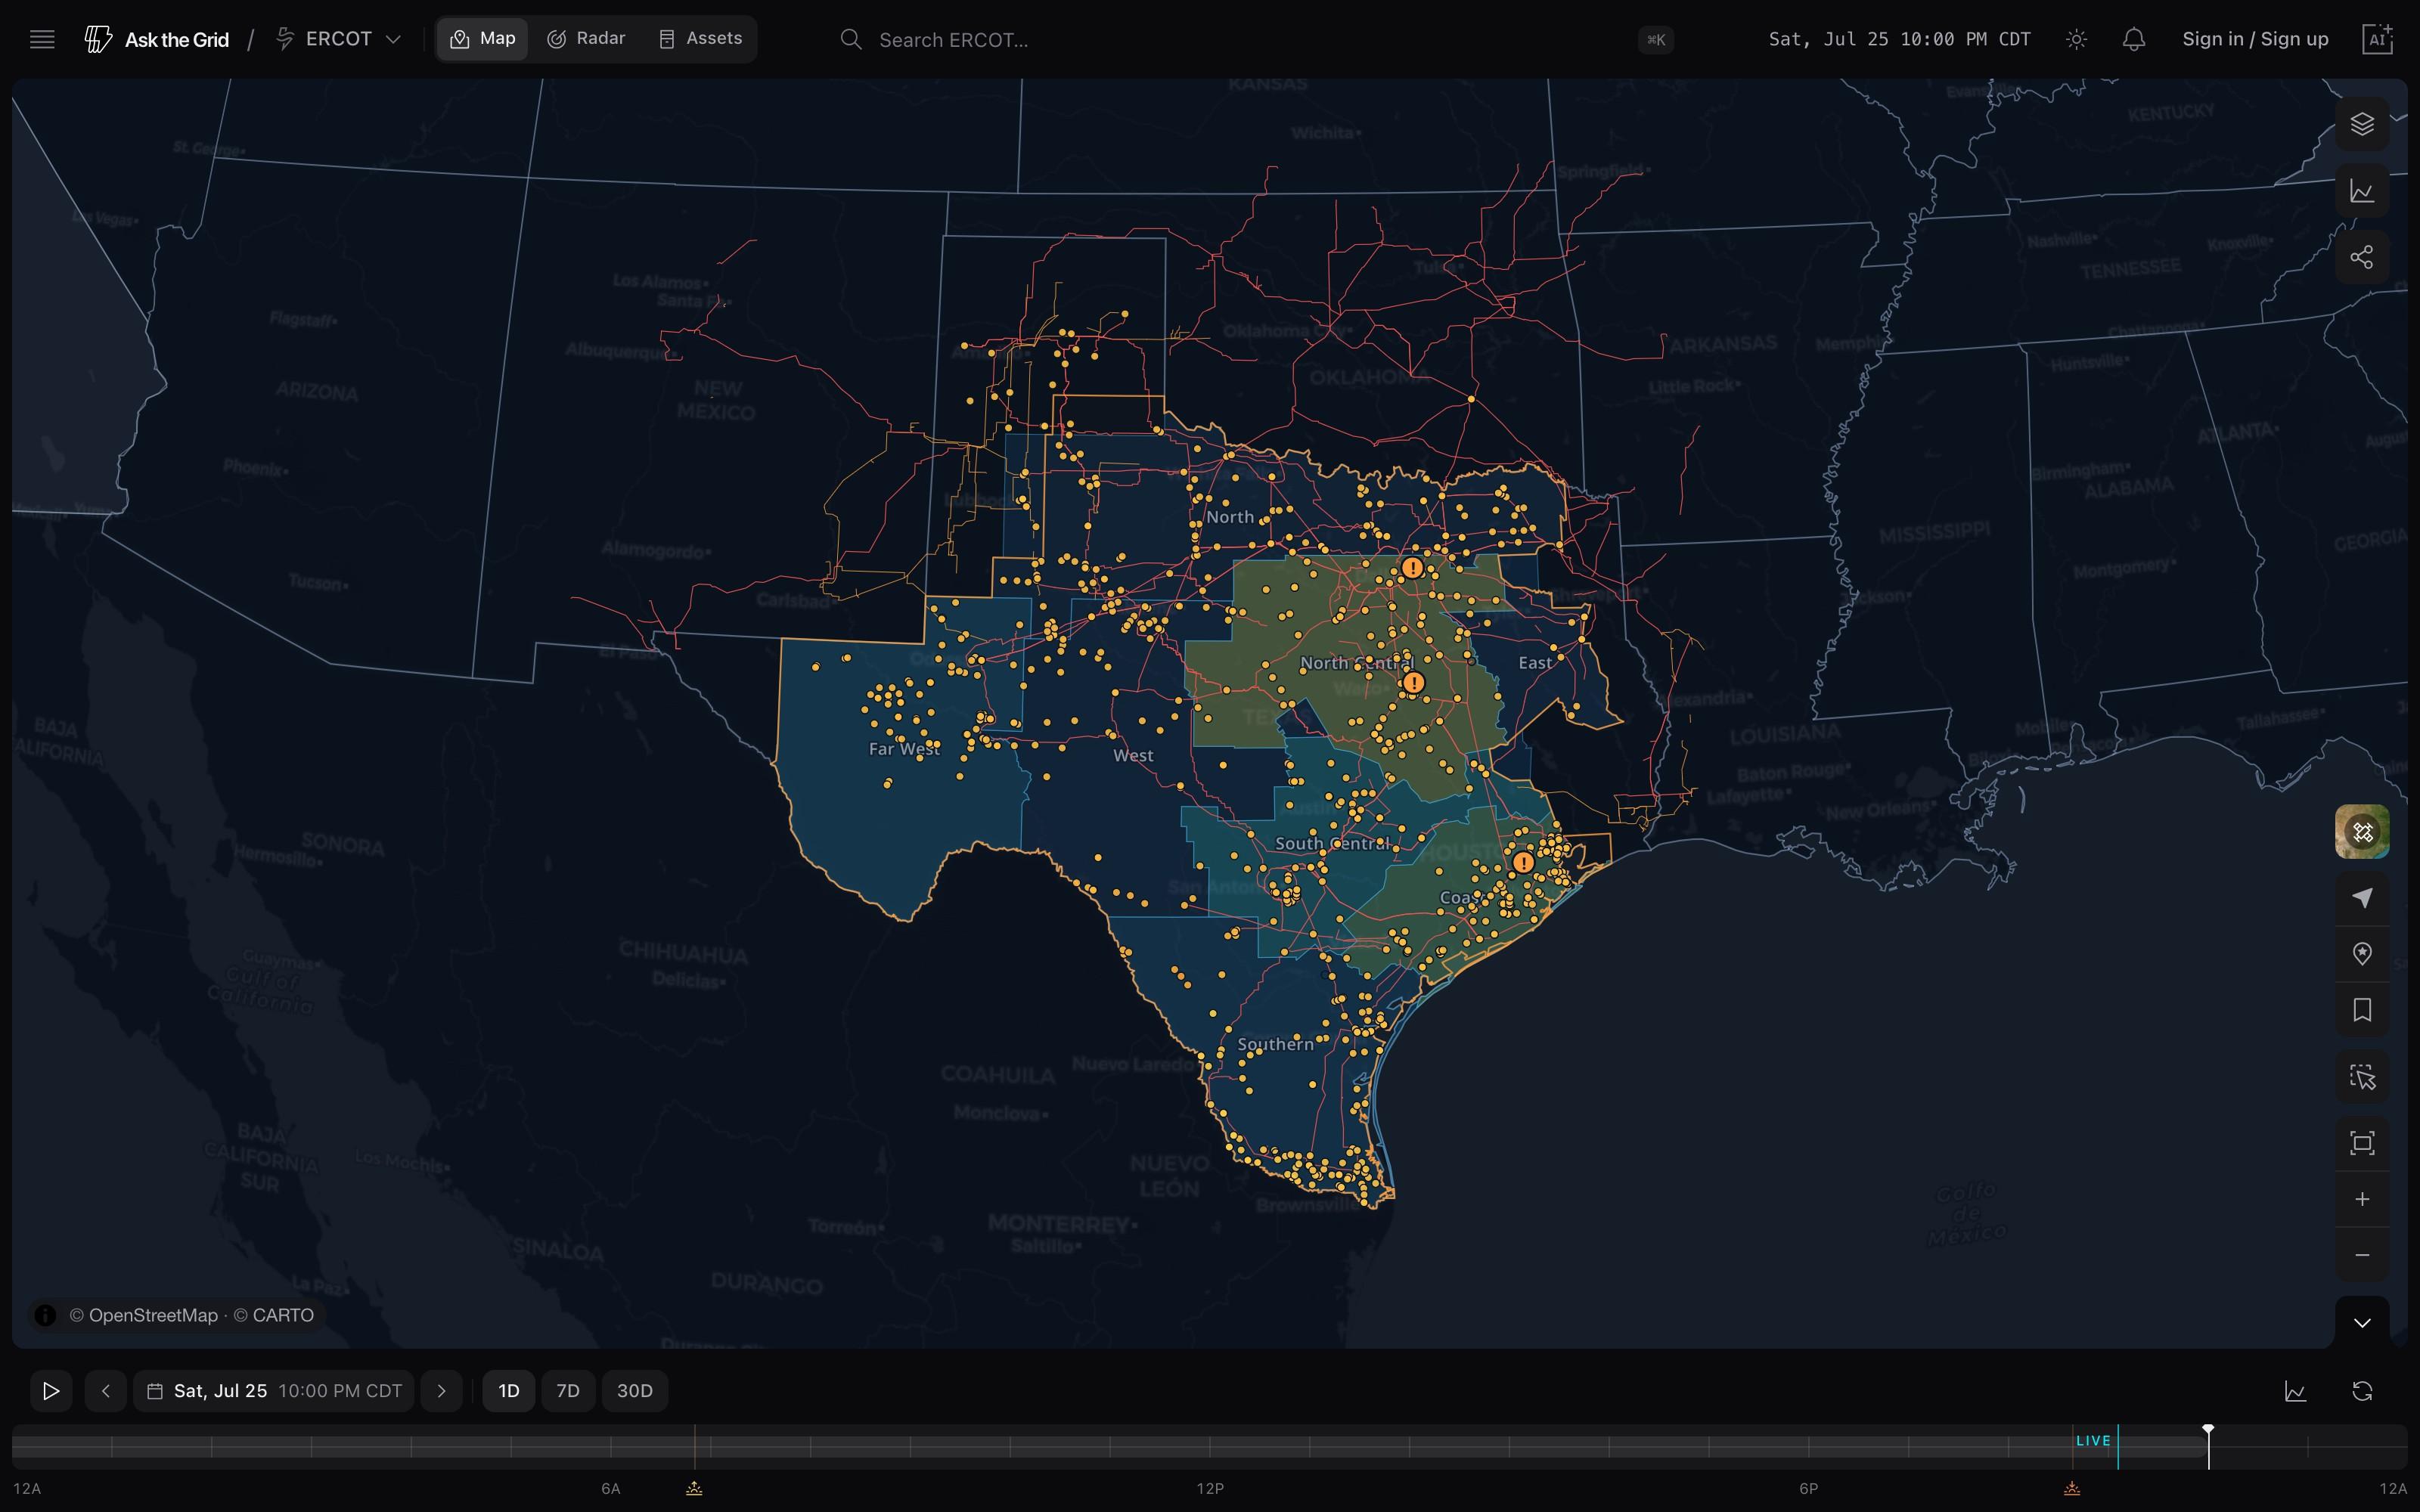
Prices, constraints, plants, substations, weather, outages, and pipelines belong on the same geographic surface—not in disconnected downloads.
Fifteen base layers. Four categories. One clock.
Nodal prices, transmission, generation, outages, and weather share a single geography — so the physical cause of a market move is somewhere you can point to.
Every layer below is a real layer in the product, listed with the source it is drawn from, the geometry it renders as, how often it changes, and where it stops being reliable.
Point — a marker at a place
Line — a connected network
Polygon — a filled boundary
Raster — a continuous field
Mixed — markers and shapes together
01
Prices · boundaries · settlement
Markets
Geographic and economic structures used to read pricing, congestion, dispatch, and settlement behavior.
02 layers
Zones
Grid operator · polygon
Demand areas and market boundaries colored by hourly load. Named load zones in NYISO and PJM; approximate TAC demand territories in CAISO.
Hourly actual and forecast frames
LimitIn CAISO the territories are approximate California Energy Commission reference geometry, not authoritative CAISO settlement boundaries.
Price nodes
Grid operator · point
Locational prices and market-relative price deviation. ERCOT also supports day-ahead versus real-time basis where the required feeds are available.
5–60 minutes by market; day-ahead hourly
LimitOutside ERCOT the map carries a selected pricing-node subset, not every published node.
02
Generation · network · interties
Infrastructure
Physical assets that produce, move, transform, and interconnect power across the selected grid.
05 layers
Transmission
HIFLD · line
High-voltage network lines, classified by voltage. Voltage filters are preserved when the parent layer is hidden and restored when it is shown again.
Source snapshot; map materialized weekly
LimitLower-voltage geometry appears only at closer zoom levels.
Generation
EIA · point
Power plants colored by primary fuel and sized by capacity. Fuel selections behave as sublayers, so hiding the parent layer preserves the chosen mix.
Map materialized weekly from the published inventory
LimitIn ERCOT the inventory is the EIA-derived HIFLD snapshot; in CAISO, NYISO, and PJM it is EIA-860 directly.
Substations
HIFLD · point
Known electric substations across the selected geography — useful for geographic context, not an operational connectivity model.
Source snapshot; map materialized weekly
LimitPublic location coverage may be incomplete or generalized.
Interconnections
ERCOT · point
Asynchronous ties and transfer points to neighboring grids. In ERCOT these are the DC ties — five approximate reference points.
Reference geometry
LimitContextual locations, not a live interchange-flow display. ERCOT only.
Interconnection queue
ERCOT · polygon
Proposed generation and storage projects from each official ERCOT publication, shaded by requested capacity, with technology and feed-status filters preserved across current, historical, and expected-online-by views.
Monthly official ERCOT publication
LimitCounty centroids are used because this feed does not publish exact project geometry. Proposed completion dates are schedules, not delivery guarantees.
03
Outages · notices · operations
Reliability
Operational disruptions and customer impacts affecting service and assets.
02 layers
Customer outages
ODIN · polygon
County-level outage impact reported by electric utilities. Color intensity follows meters out at the selected timestamp, with labels showing the reported count.
10-minute snapshots
LimitCoverage and reporting cadence vary by utility.
Grid events
Grid operator · mixed
Operator notices normalized into map-visible shapes and asset-attached markers. Open one for timing, source language, affected equipment, and operational detail.
Mixed notices, schedules, and outage snapshots
04
Atmosphere · hazards · daylight
Weather
Atmospheric conditions that shape demand, renewable output, field work, and operating risk.
06 layers
Wind
Open-Meteo / ERA5 · raster
An animated flow field over the active map and timestamp, so direction and relative speed stay legible without covering the grid beneath them.
Hourly reanalysis; approximately 4–5 days delayed
Temperature
Open-Meteo / ERA5 · raster
A continuous temperature field for the selected hour, with sparse value labels that give exact readings without turning the map into a wall of numbers.
Hourly reanalysis; approximately 4–5 days delayed
Precipitation
Open-Meteo / ERA5 · raster
Active rainfall and snow-equivalent cells only — dry areas stay transparent so infrastructure and market layers remain readable.
Hourly reanalysis; approximately 4–5 days delayed
Cloud cover
Open-Meteo / ERA5 · raster
Estimated cloud fraction across the selected grid — a soft atmospheric field for solar context and fast visual orientation.
Hourly reanalysis; approximately 4–5 days delayed
Day / night
Astronomical calculation · polygon
The solar terminator for the selected map timestamp, making sunrise, sunset, and the nighttime footprint visible alongside demand and renewable conditions.
Calculated for every timestamp
Lightning
GOES GLM · point
Recent satellite-detected flash locations near the selected timestamp, for rapid awareness of active convective weather and field risk.
Near real time
Three ways to color the market.
Congestion is a comparison, not a number you can read off one map. The price-node layer can be colored three ways, and the legend always names what the two ends of the scale mean.
price
Absolute price
The published locational price at each node, on one scale across the whole market.
Negative → Scarcity
congestion
Deviation from the reference
Each node against the current market reference — in ERCOT, congestion relative to system lambda. Elsewhere it is deviation from the frame median: a visual comparison, not the operator's published congestion component.
Below reference → Above reference
basis
Day-ahead basis
Real-time against day-ahead at the same point, where both feeds are available. ERCOT today.
RT below DA → RT above DA
Layers have sublayers.
A layer is rarely all-or-nothing. Each filter below is a fixed vocabulary in the product, and the layer panel searches layers, sources, and fuels by name or alias.
Fuel
Generation
Gas
Coal
Nuclear
Wind
Solar
Battery
Hydro
Petroleum
Biomass
Other
Fuel selections behave as sublayers and survive hiding the parent layer.
Voltage class
Transmission
345 kV+
230 kV
138 kV
69 kV
345 kV and 230 kV load on first paint; the lower classes fetch their geometry on toggle.
Queue technology
Interconnection queue
Battery
Solar
Wind
Gas
Nuclear
Hydro
Other
Filtered alongside ERCOT feed status — active or completed.
Labels
Zones · Transmission · DC ties · Queue · Temperature · Outages
On
Off
Label visibility is configurable independently of the layer it belongs to.
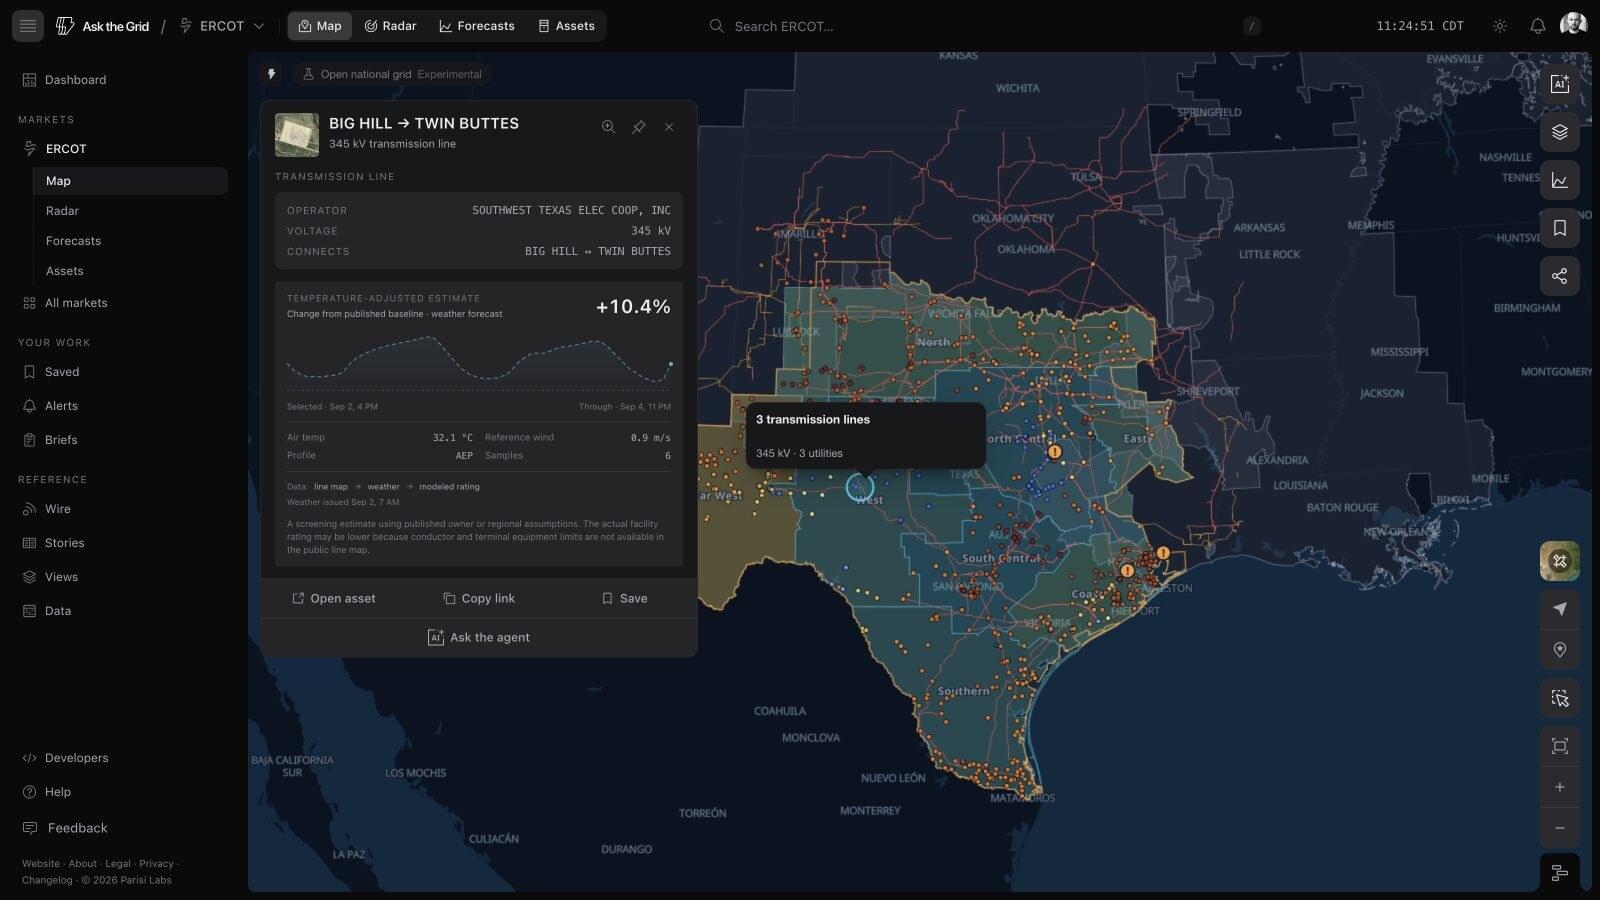
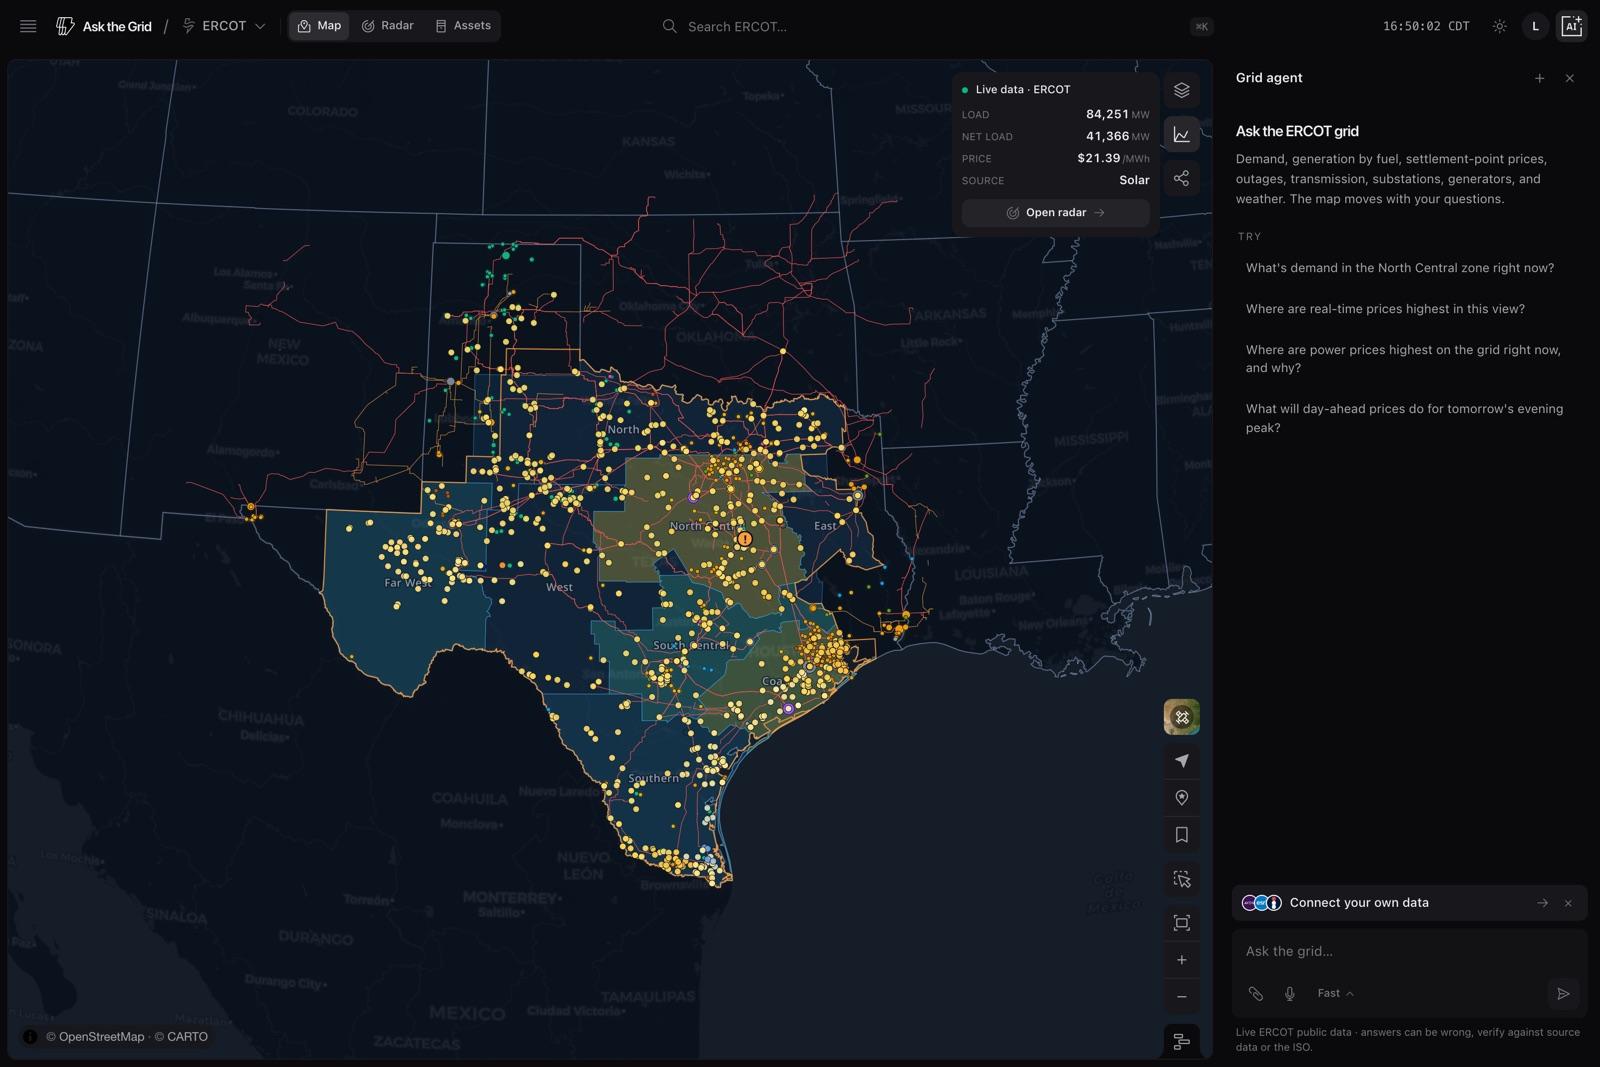
Not a mockup. This is the map.
Two captures from the live ERCOT surface — a selection with its readout, and the live summary for the current view.
Map · a plant selectedAsk the Grid
Map · live summaryAsk the Grid
One map
Market, network, asset, weather, and event context stay aligned through time.
Every layer moves on one clock.
The timeline is not an overlay on the map. It sits below the map and pushes it up, because time is a first-class control here, not a filter. Prices, weather, outages, and events all redraw at the timestamp you choose.
01
Live
The playhead is pinned to now, with a fixed live line on the track. Scrub back into the day and press play to replay it up to the live edge.
02
Historical day
A single day, with previous and next day navigation and a date picker. History runs back to 1 January 2017.
03
Range
A multi-day window for backtesting — 7-day and 30-day presets, or a custom span.
Forecast side
Everything right of now is hatched and labelled Forecast, so the dataless side of the clock is never mistaken for realized data. The window runs 14 days ahead by default, and further when a layer needs it — the interconnection queue travels to proposed completion dates years out.
Layer tracks
Turn on series and each active map layer gets its own sparkline row with the value at the cursor. Temperature and wind rows are sampled over the current viewport, so they follow where you are looking.
Daylight
Sunrise and sunset markers are drawn on the track for the relevant location — the map selection when there is one, otherwise the viewport.
Scrub and step
The whole canvas is the control: drag anywhere to seek, or focus it and step interval by interval with the arrow keys.
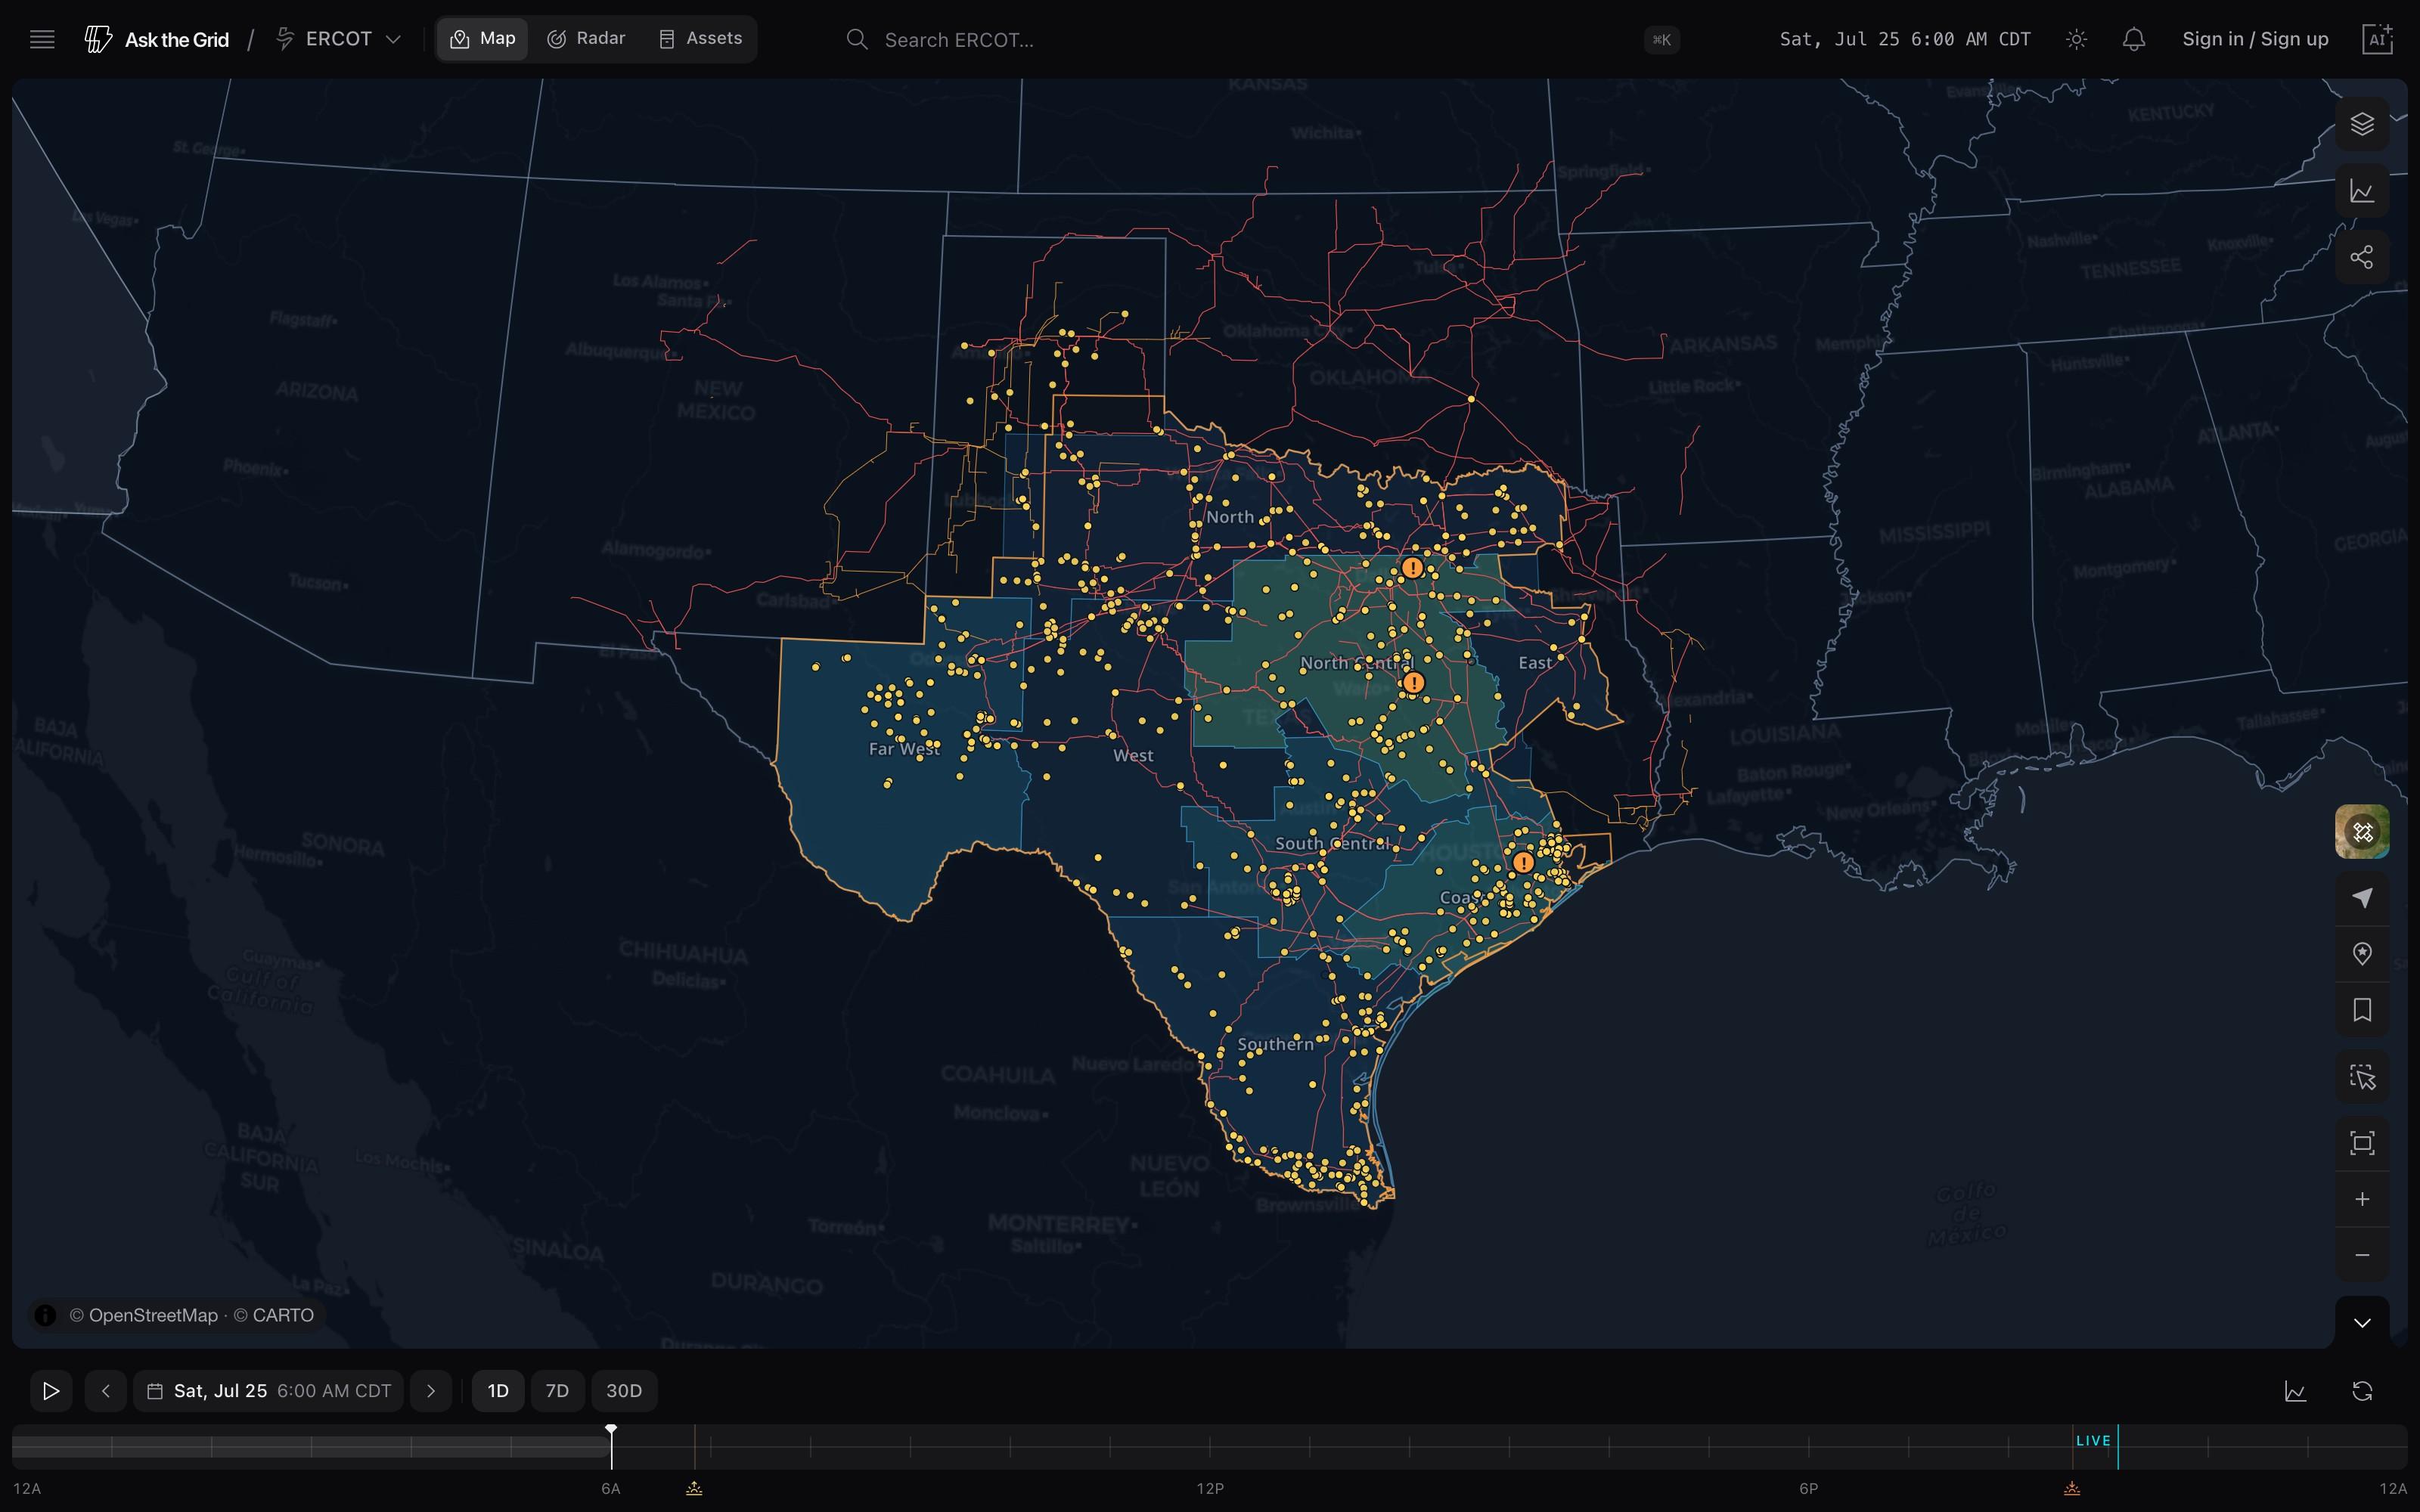
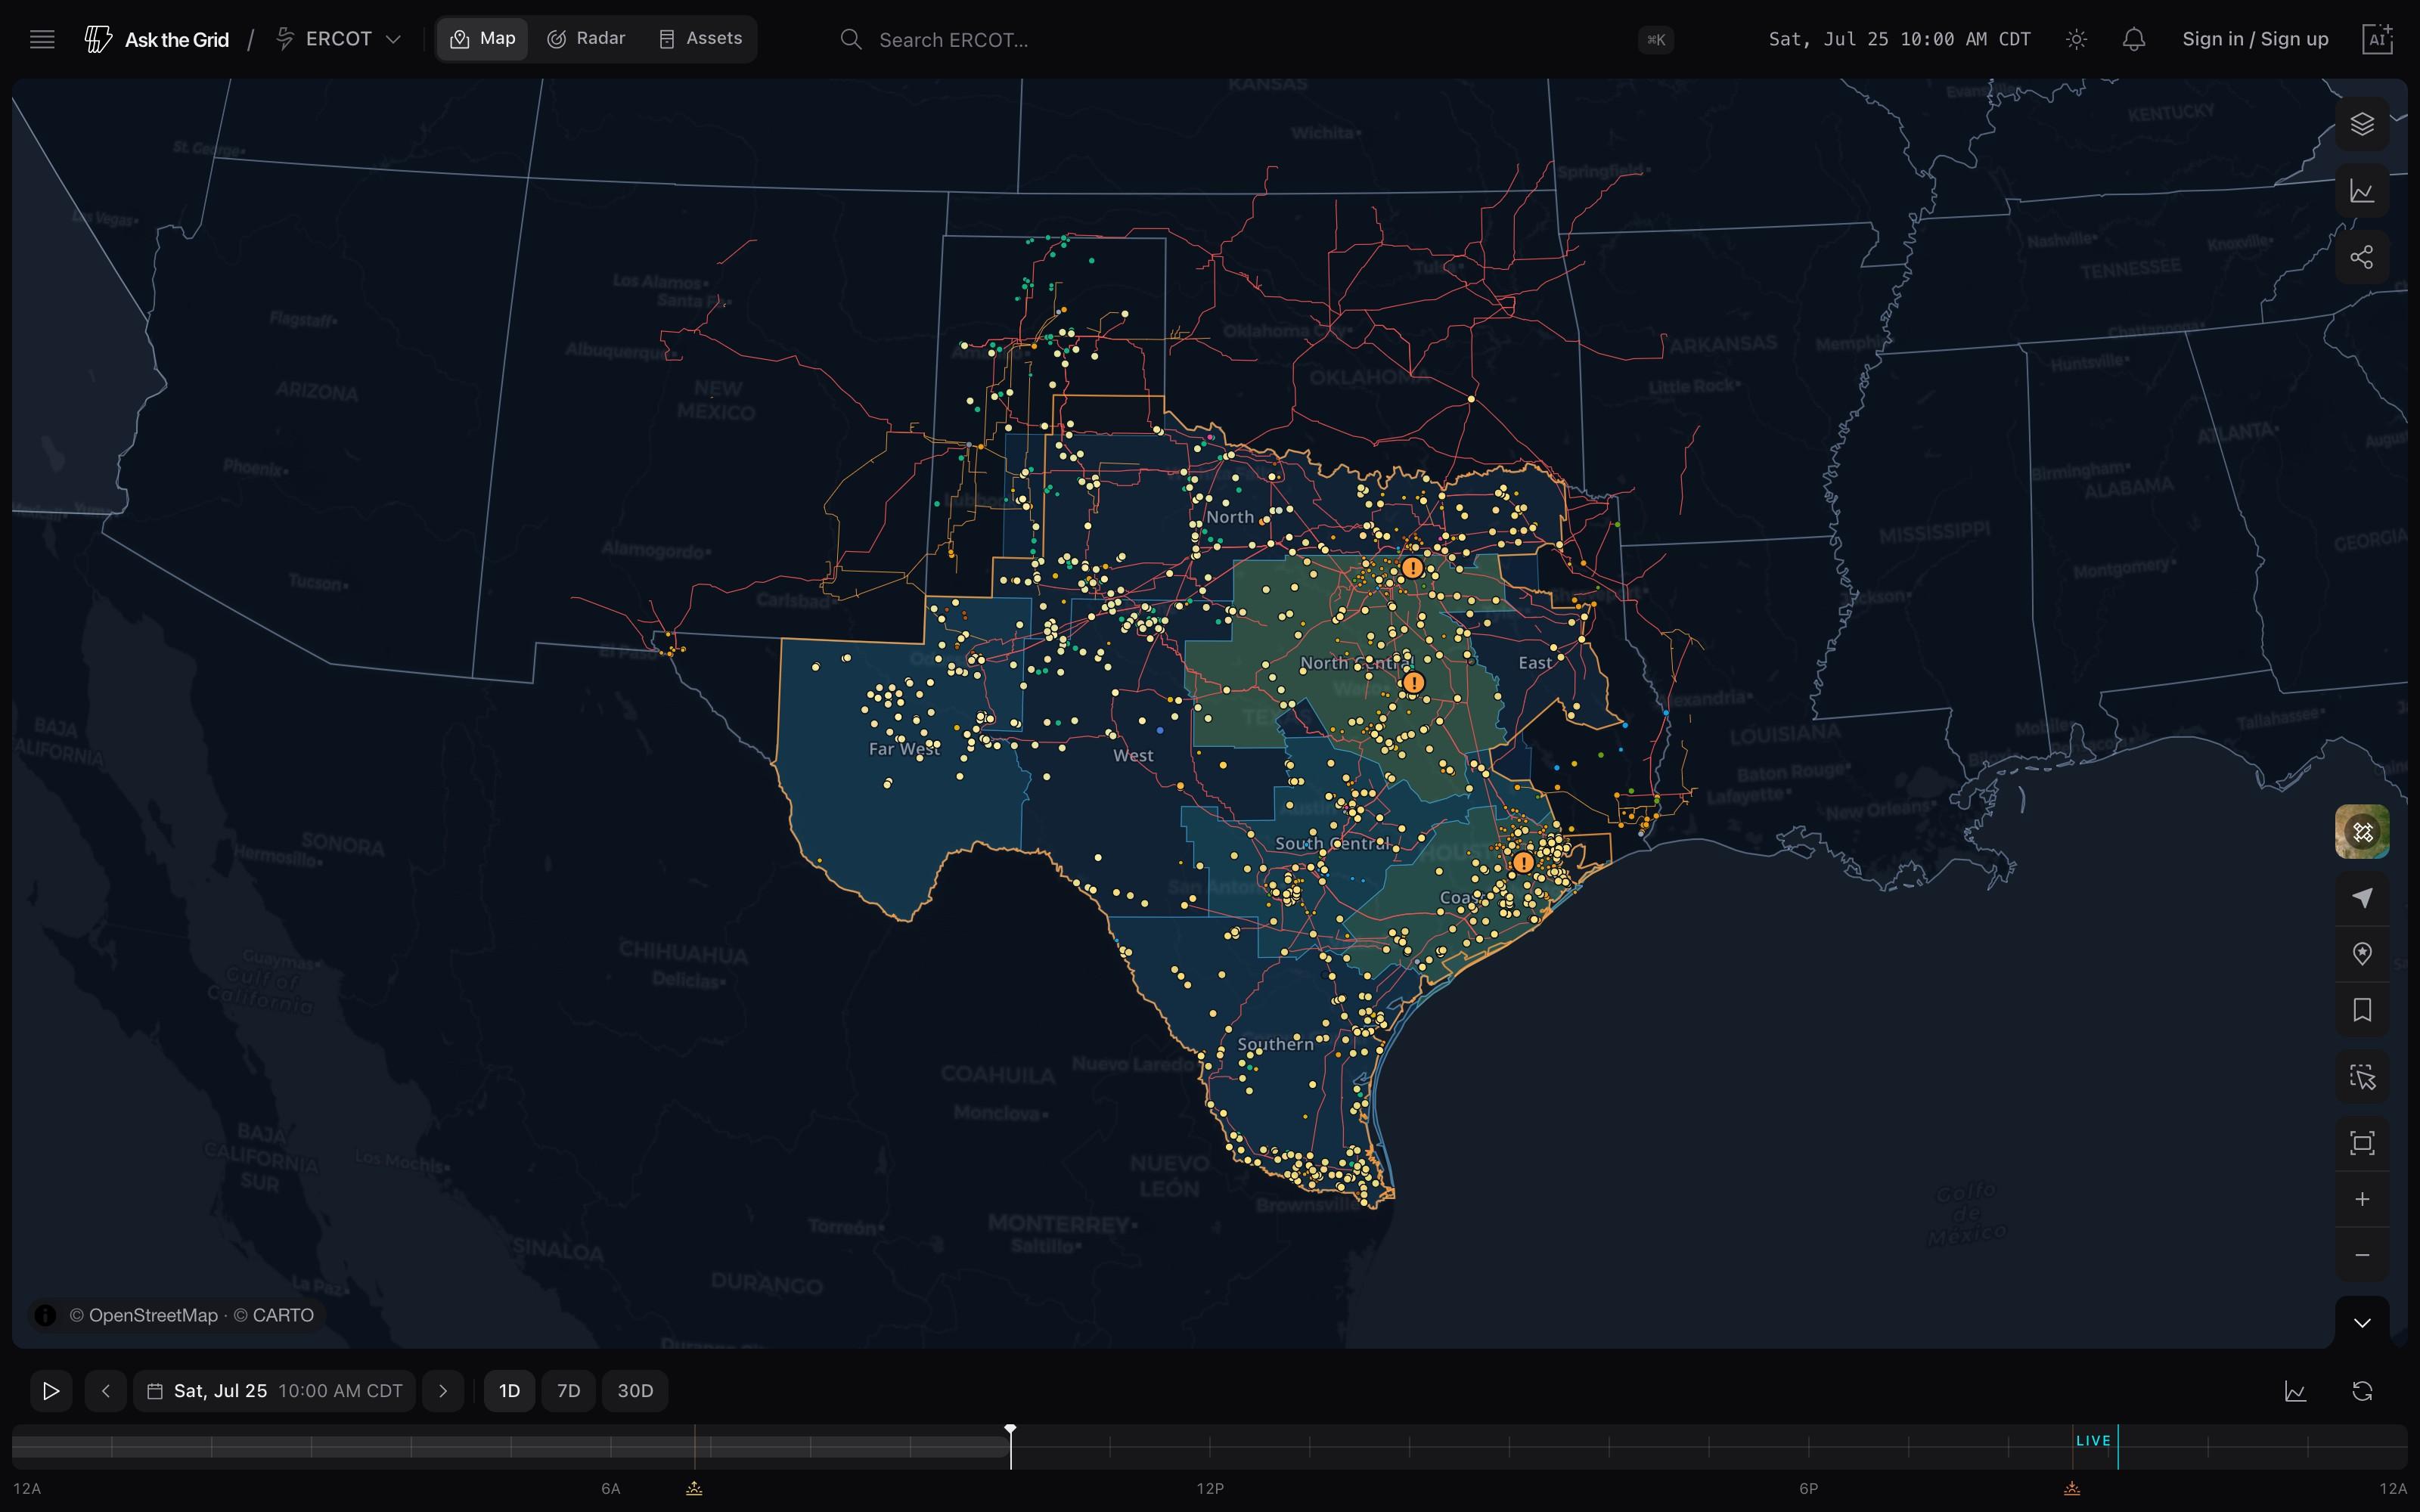
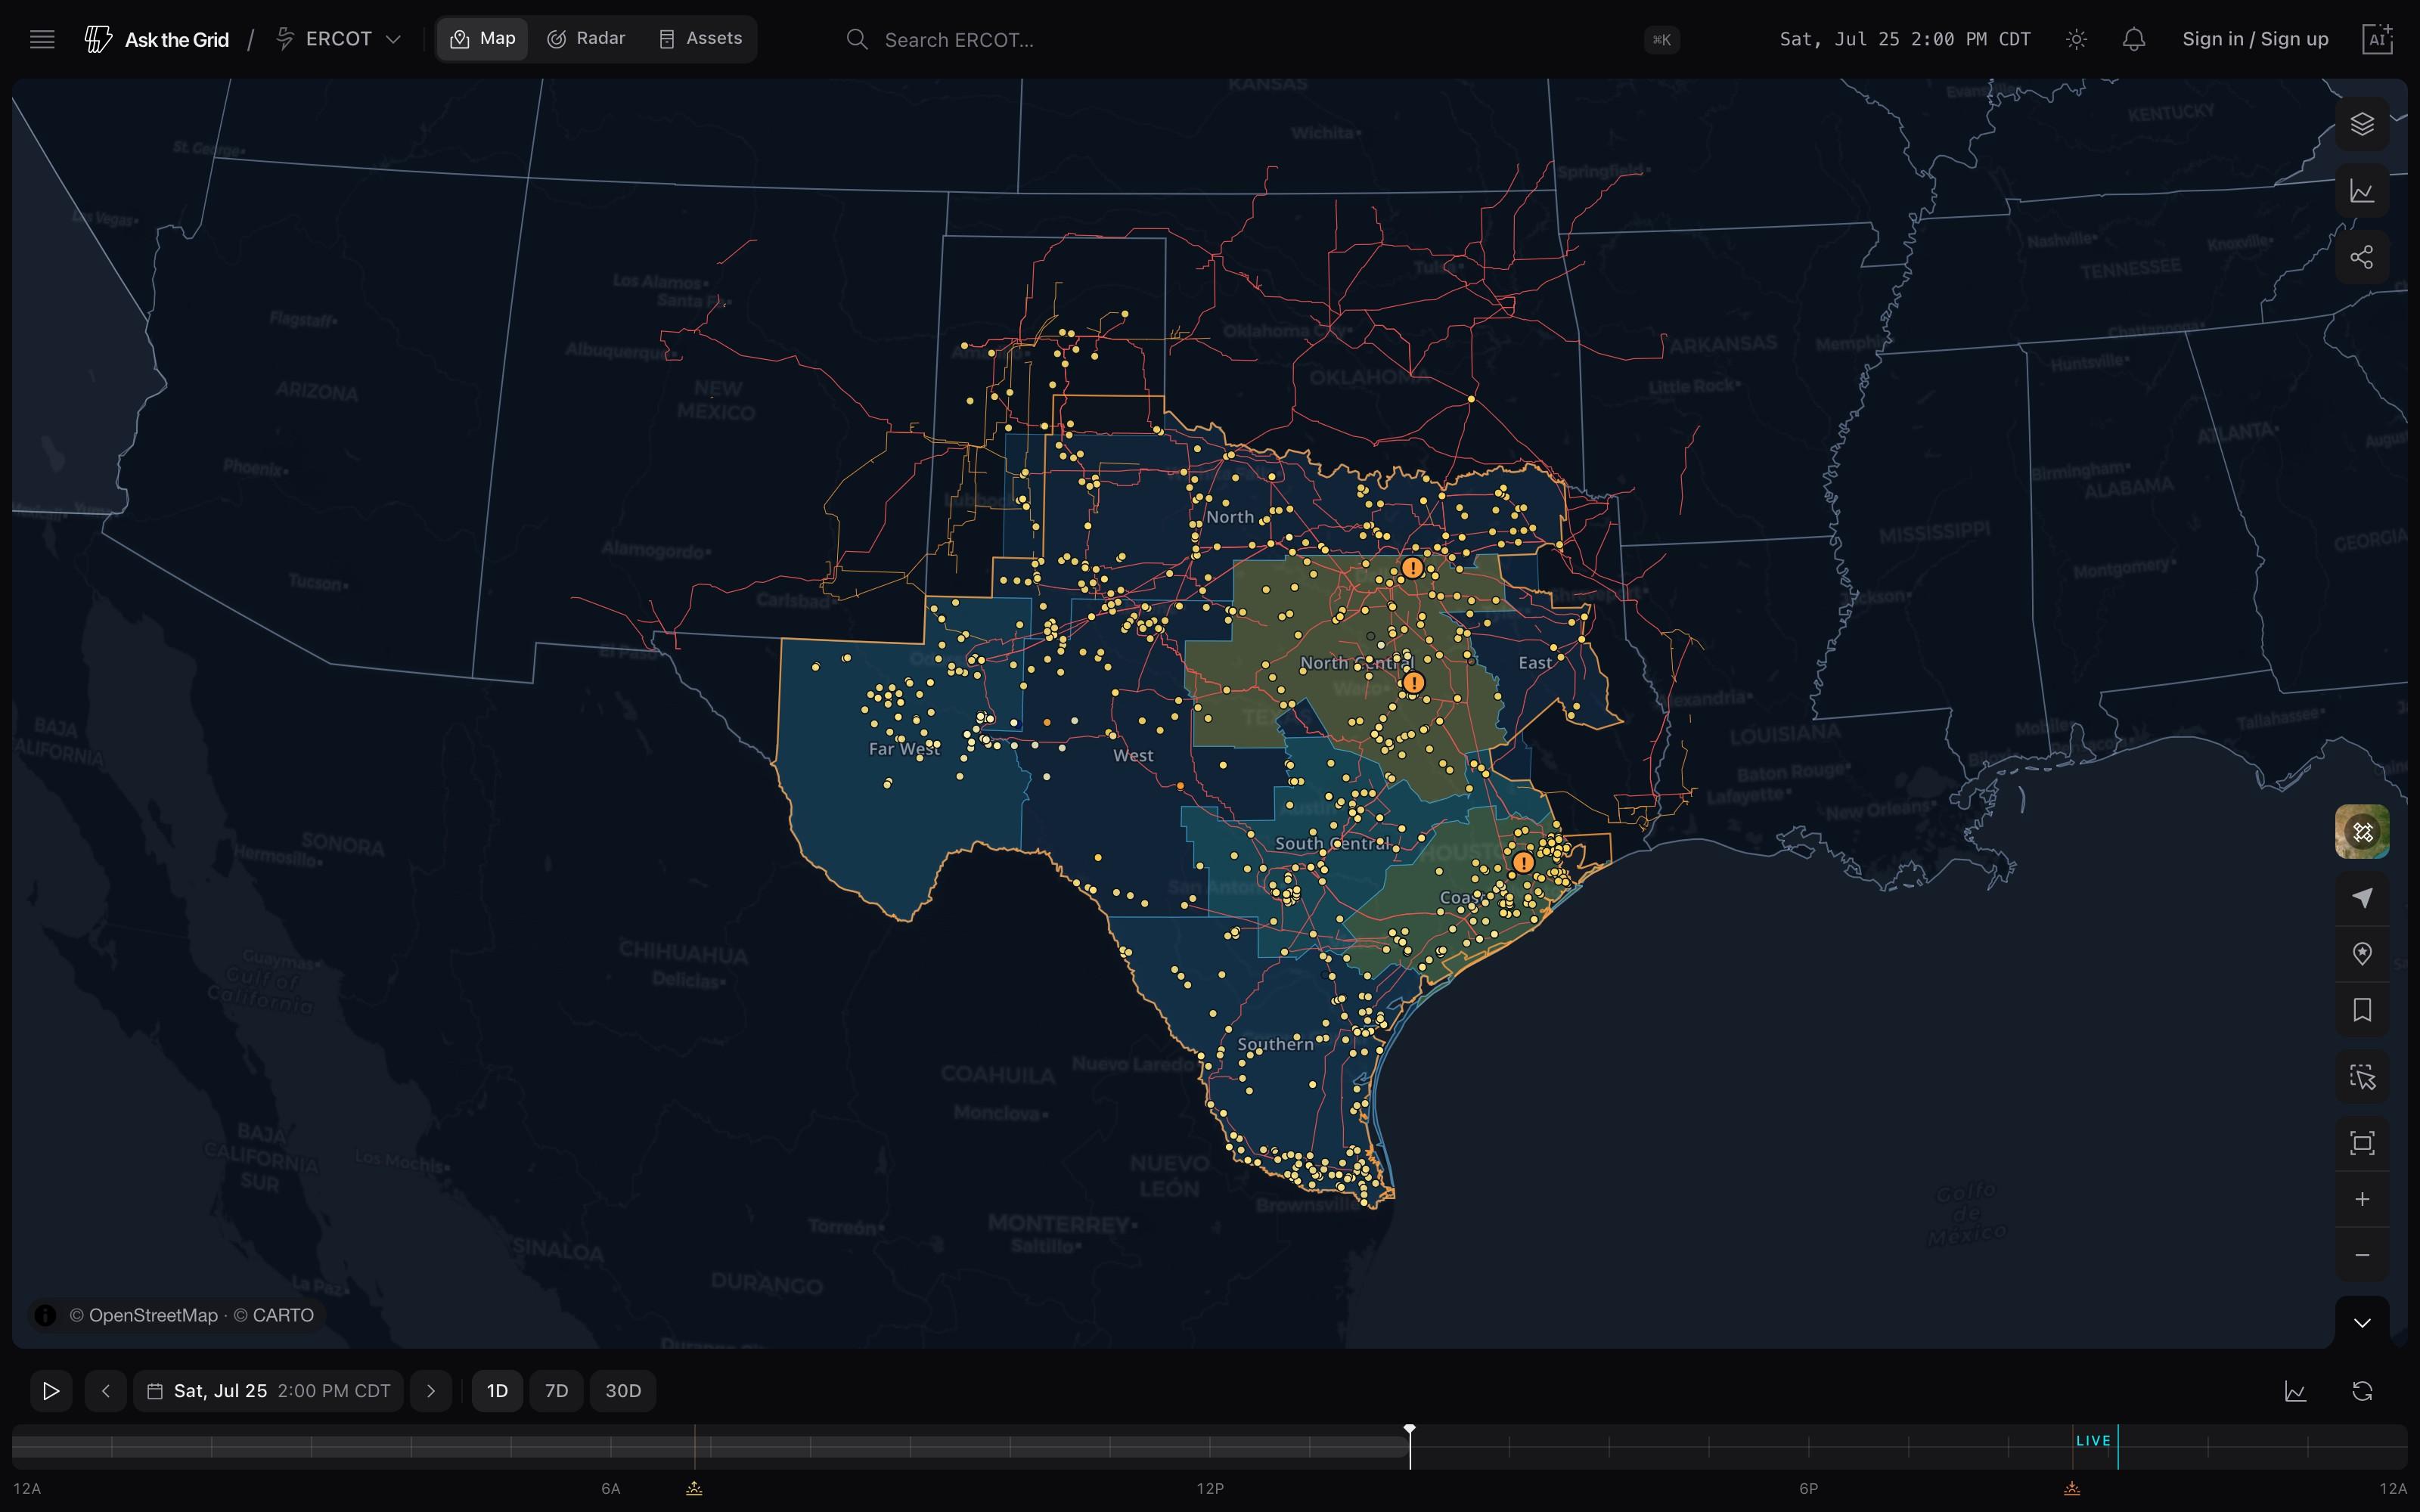
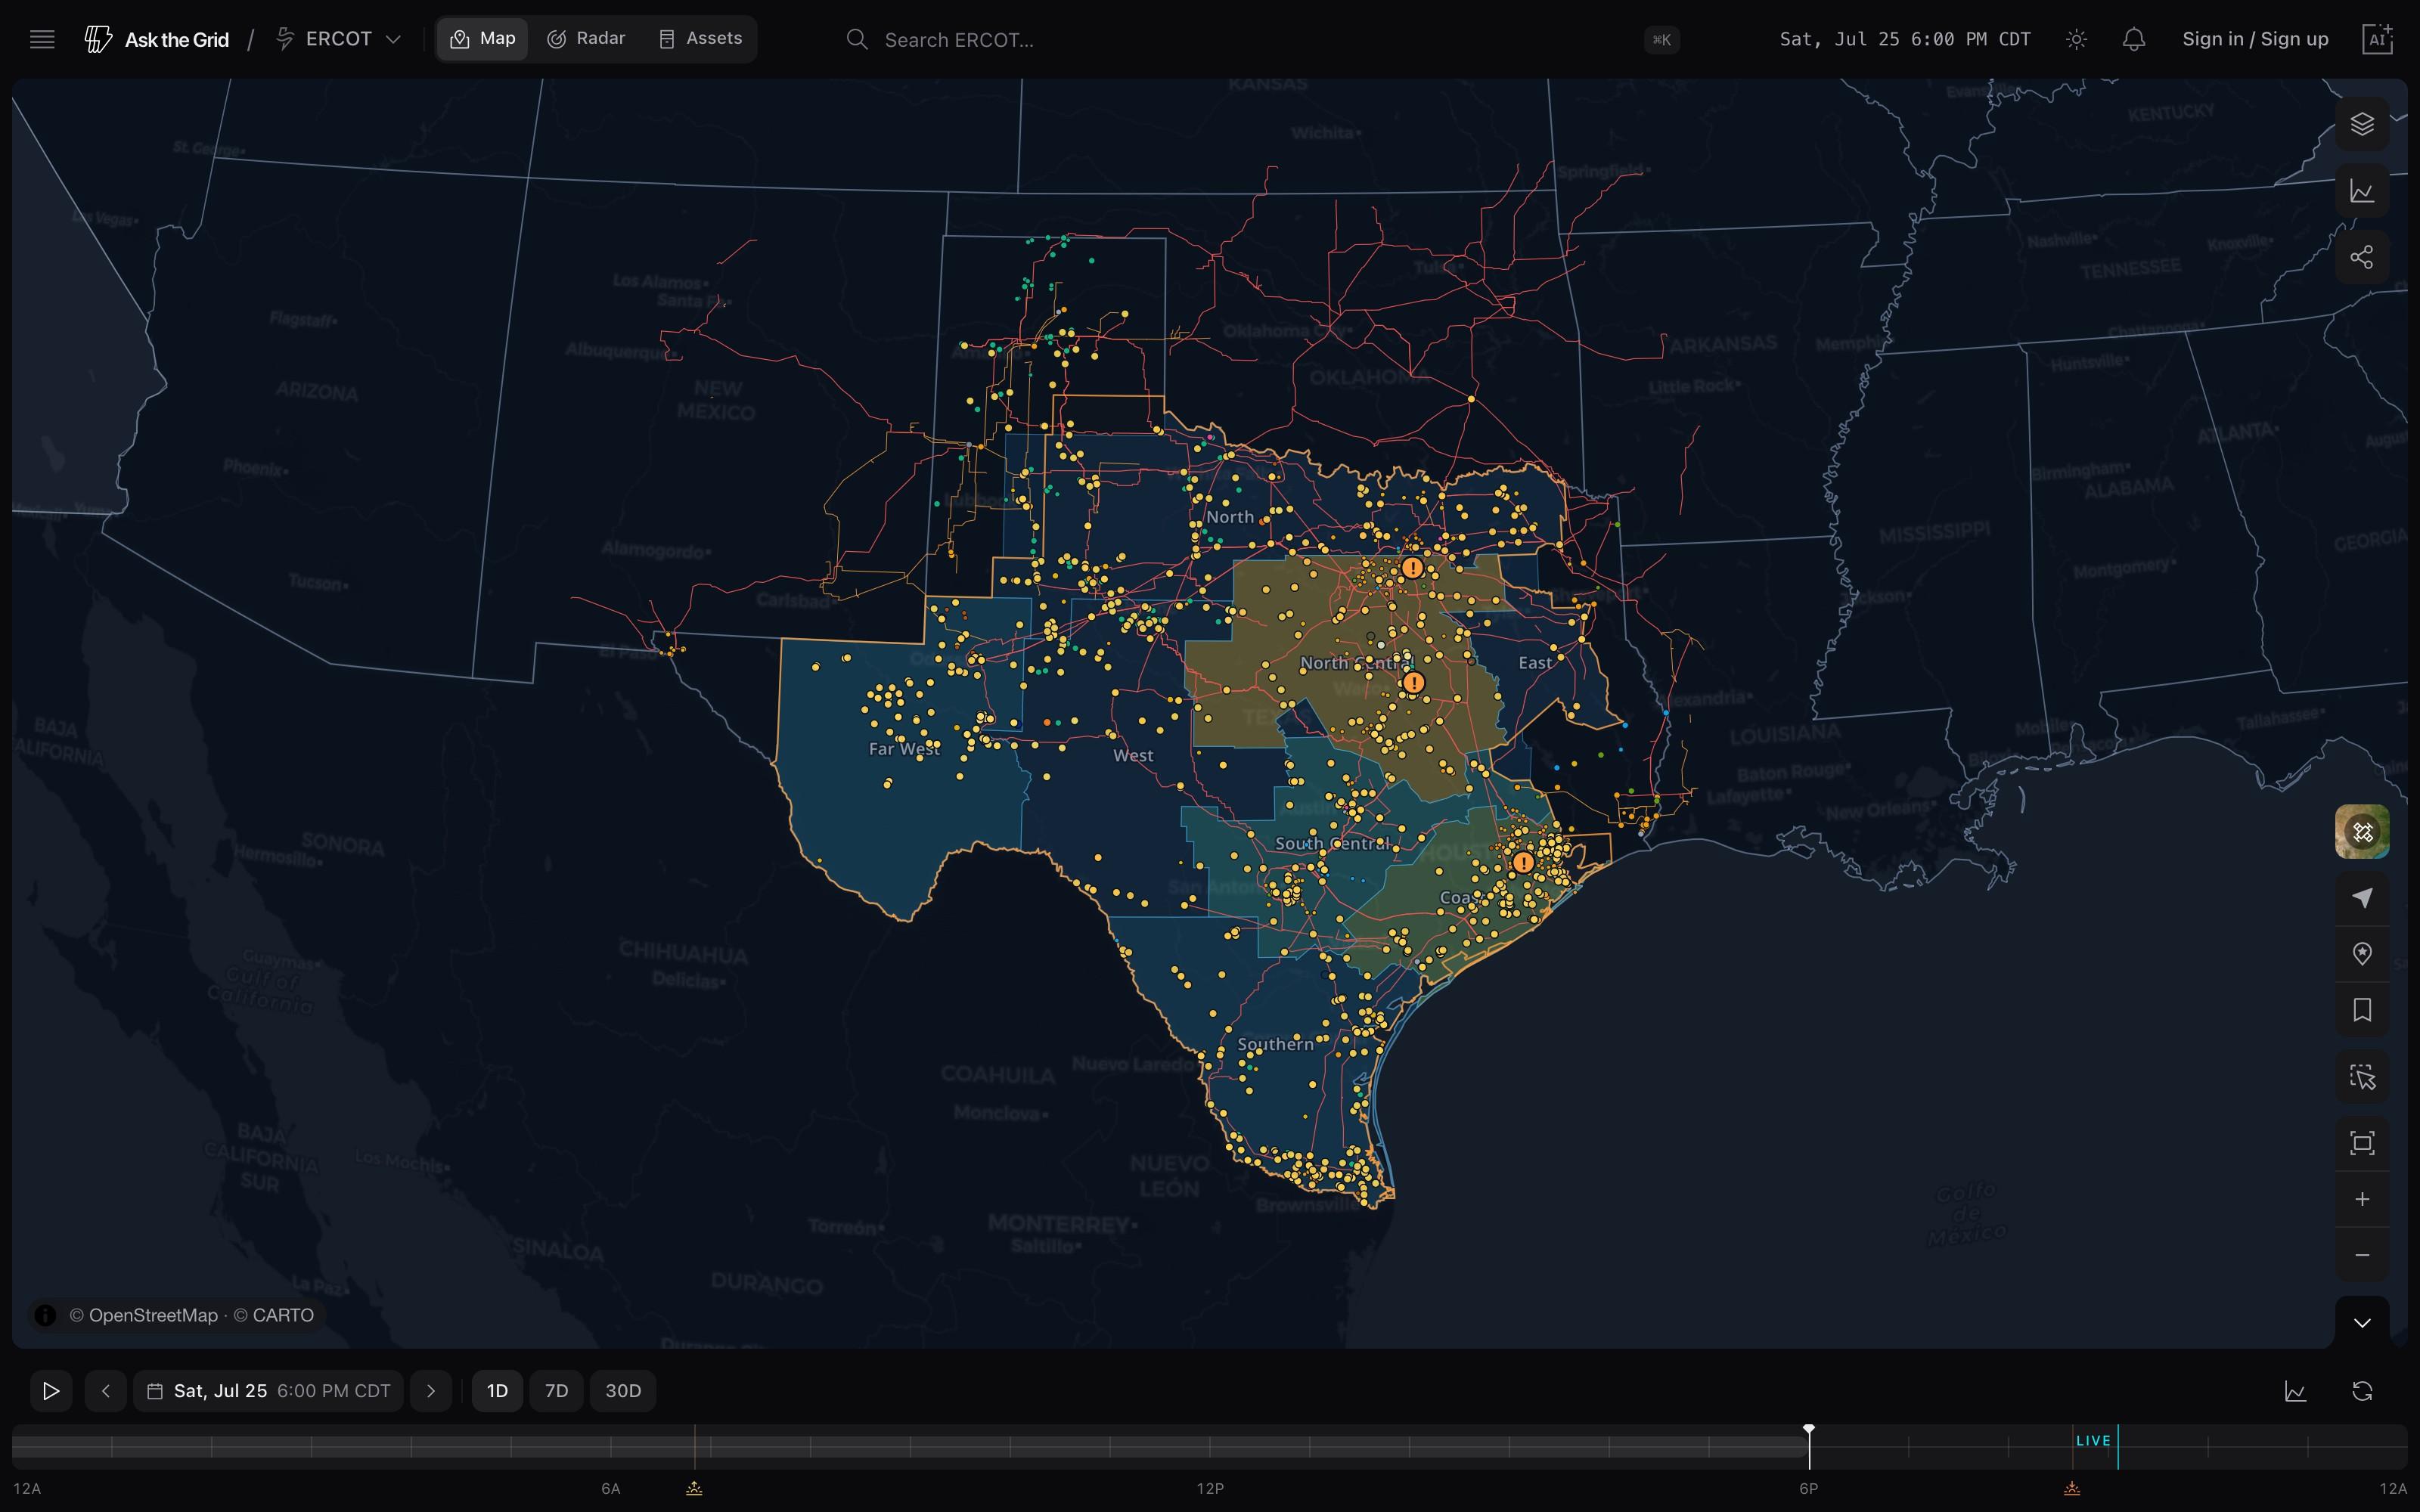
Drag the scrubber. Watch the grid change.
Five real captures of the live ERCOT map, one day, generation coloring on — not a screen recording.
2 PM CDT · Sat, Jul 25 · real capture, not a render
Public overlays, loaded on demand.
Beyond the base layers, a set of public geographic overlays can be switched on when a question needs them. They are fetched from the publishing authority and clipped to the active grid footprint where that makes sense. The basemap itself switches between the flat cartographic style and satellite imagery.
Grid footprint
The ERCOT, CAISO, NYISO, or PJM service boundary for the active market.
ERCOT / HARC · California Energy Commission · U.S. Census Bureau · HIFLD / ORNL
Counties and states
County geometry for Texas, California, and New York; state boundaries across the PJM footprint.
TxDOT / Texas GLO · U.S. Census Bureau
Utility territories
Electric utility service territories in each live market.
HIFLD / ORNL
Natural gas pipelines
Interstate and intrastate gas pipelines across Texas, plus Railroad Commission permitted major trunks.
EIA · Texas RRC
What the map does not claim.
Layer availability is not uniform across markets, and some feeds are models or snapshots rather than live measurement. Both are stated on the layer inside the product, and both are stated here.
Availability by market
ERCOTAll fifteen base layers.
CAISONo DC ties, interconnection queue, or grid events.
NYISONo DC ties or interconnection queue.
PJMNo DC ties, interconnection queue, grid events, or lightning.
Weather is a model
Wind, temperature, precipitation, and cloud cover come from an hourly reanalysis on a 0.25-degree grid over each market’s bounding box, roughly four to five days behind. Lightning is the only near-real-time observational feed. Day and night is an astronomical calculation, not a measurement.
Infrastructure is a snapshot
Transmission, generation, and substation geometry come from public inventories, materialized weekly. They are geographic context — not an operational connectivity or topology model.
Ask the grid
The agent rides on the map, too. Ask it about anything on the screen — it reads the same live data and answers with the source attached.