An asset database for every plant on the grid.
Power plants, batteries, substations, and transmission lines, each with a profile page: the prices where it sits right now, how much it produced in past months, who owns it, and the public records every field came from.
Open a plant profile
Units, generation history, market context, commercial record, and sources on one page.
Search a market's fleet
Every live market has a searchable registry and ranked technology leaderboards.
Trace any number
Each field is read from a public EIA, grid-operator, EPA, or HIFLD record.
A profile, and the fleet around it.
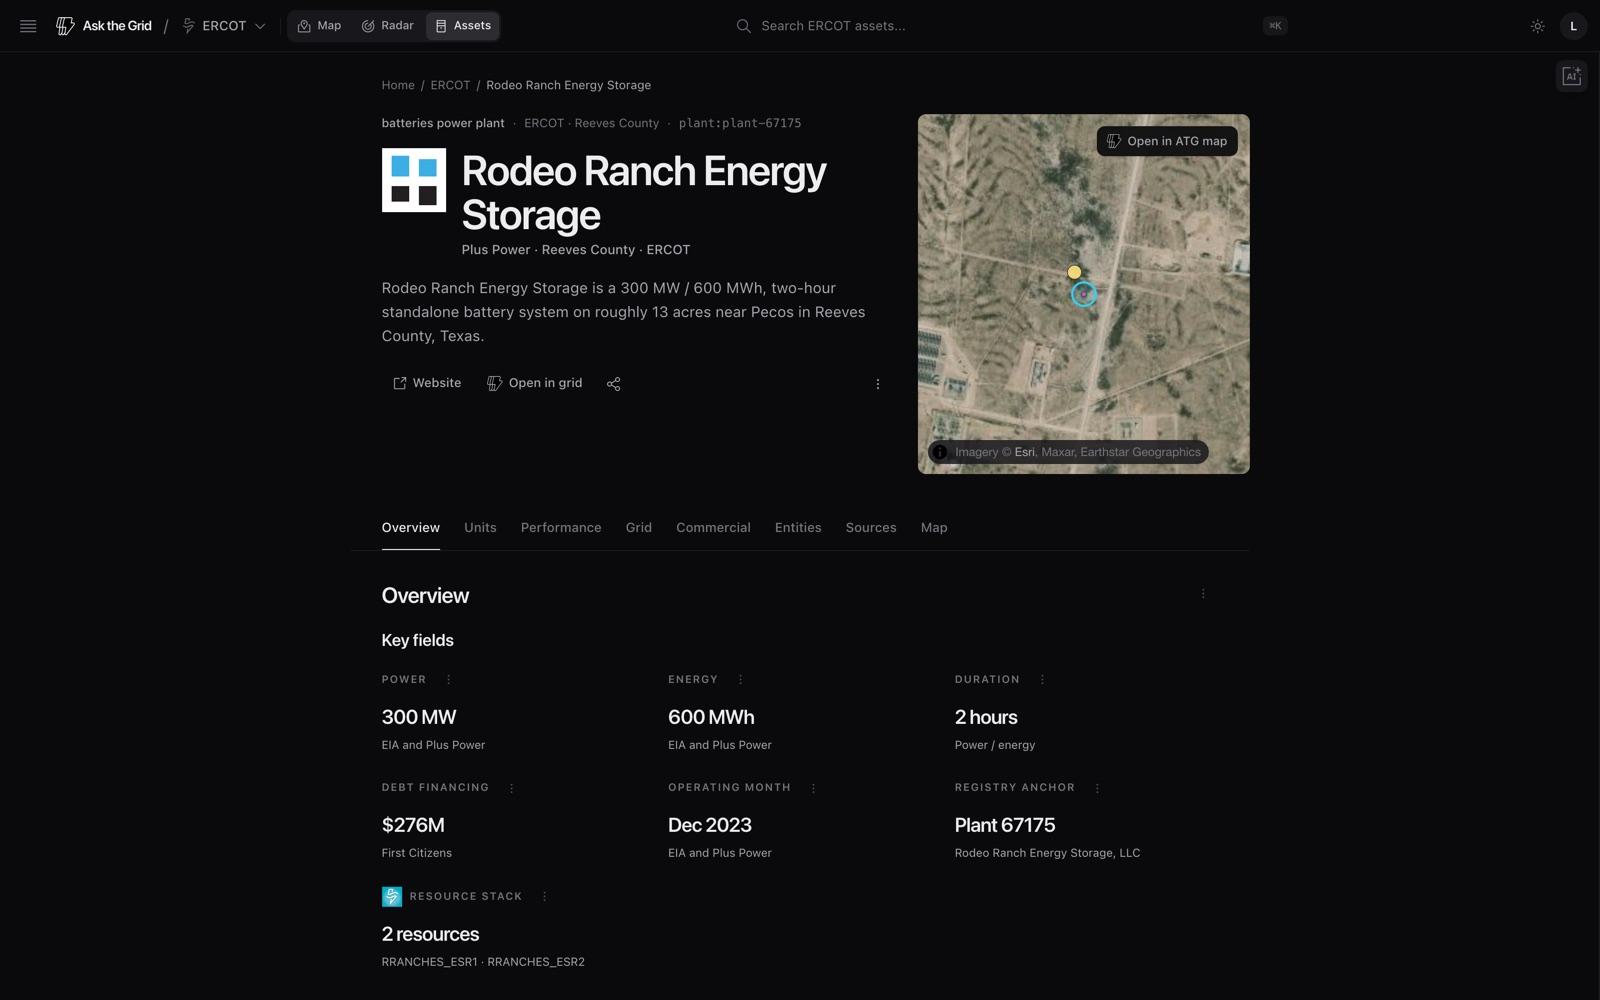
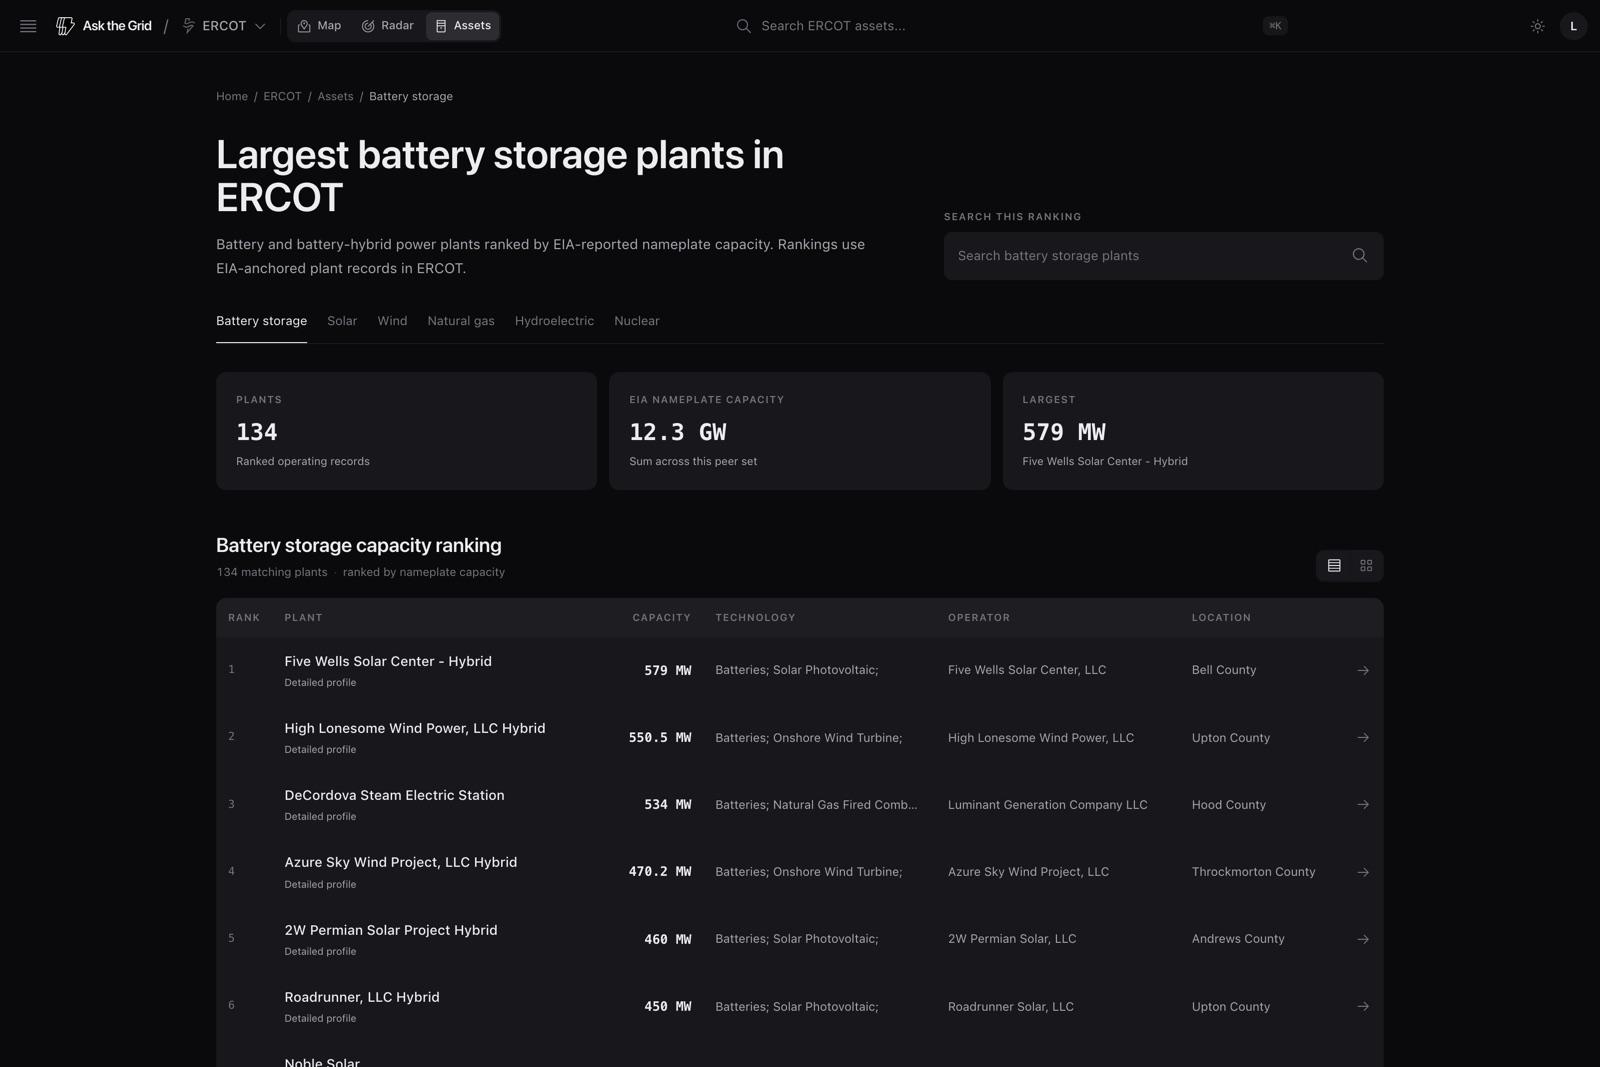
Two captures from the live product — one asset, and the technology ranking it sits inside.
Plant records, ERCOT alone
975registry assets
ERCOT asset directory · 1 Sep 2026
EIA nameplate capacity
176GW
Sum across ERCOT registry records
Market coverage
7live US grids
Every launched market
Open a profile
Six real assets. Click one.
Each card opens the published profile for that plant — the same page an analyst uses, with its units, generation history, grid context, commercial record, and sources attached. The first profile is open to anyone; a free account opens the rest.
Comanche Peak
2,400 MW net summer · Somervell County, TX
James A Fitzpatrick
883 MW · New York
Hanging Rock Energy Facility
1,430 MW · Ohio
Mammoth Pool
190 MW · Madera County, CA
Rodeo Ranch Energy Storage
300 MW / 600 MWh · Reeves County, TX
Millstone
2,259.9 MW · New London County, CT
Figures on each card are taken from that profile’s own published summary.
Or start from the registry.
See the marketsEvery live market has a searchable plant registry — by name, operator, technology, or county — and ranked leaderboards for battery storage, solar, wind, natural gas, hydroelectric, and nuclear, with source-backed profiles published across all of them.
| Market | Territory | Open |
|---|---|---|
| ERCOT | Texas | ERCOT assets |
| CAISO | California | CAISO assets |
| PJM | Mid-Atlantic · Midwest | PJM assets |
| NYISO | New York | NYISO assets |
| MISO | Central United States | MISO assets |
| ISO-NE | New England | ISO-NE assets |
| SPP | Great Plains | SPP assets |
Source: each market’s own asset directory, read 1 September 2026. Counts move as EIA republishes and as profiles are published.
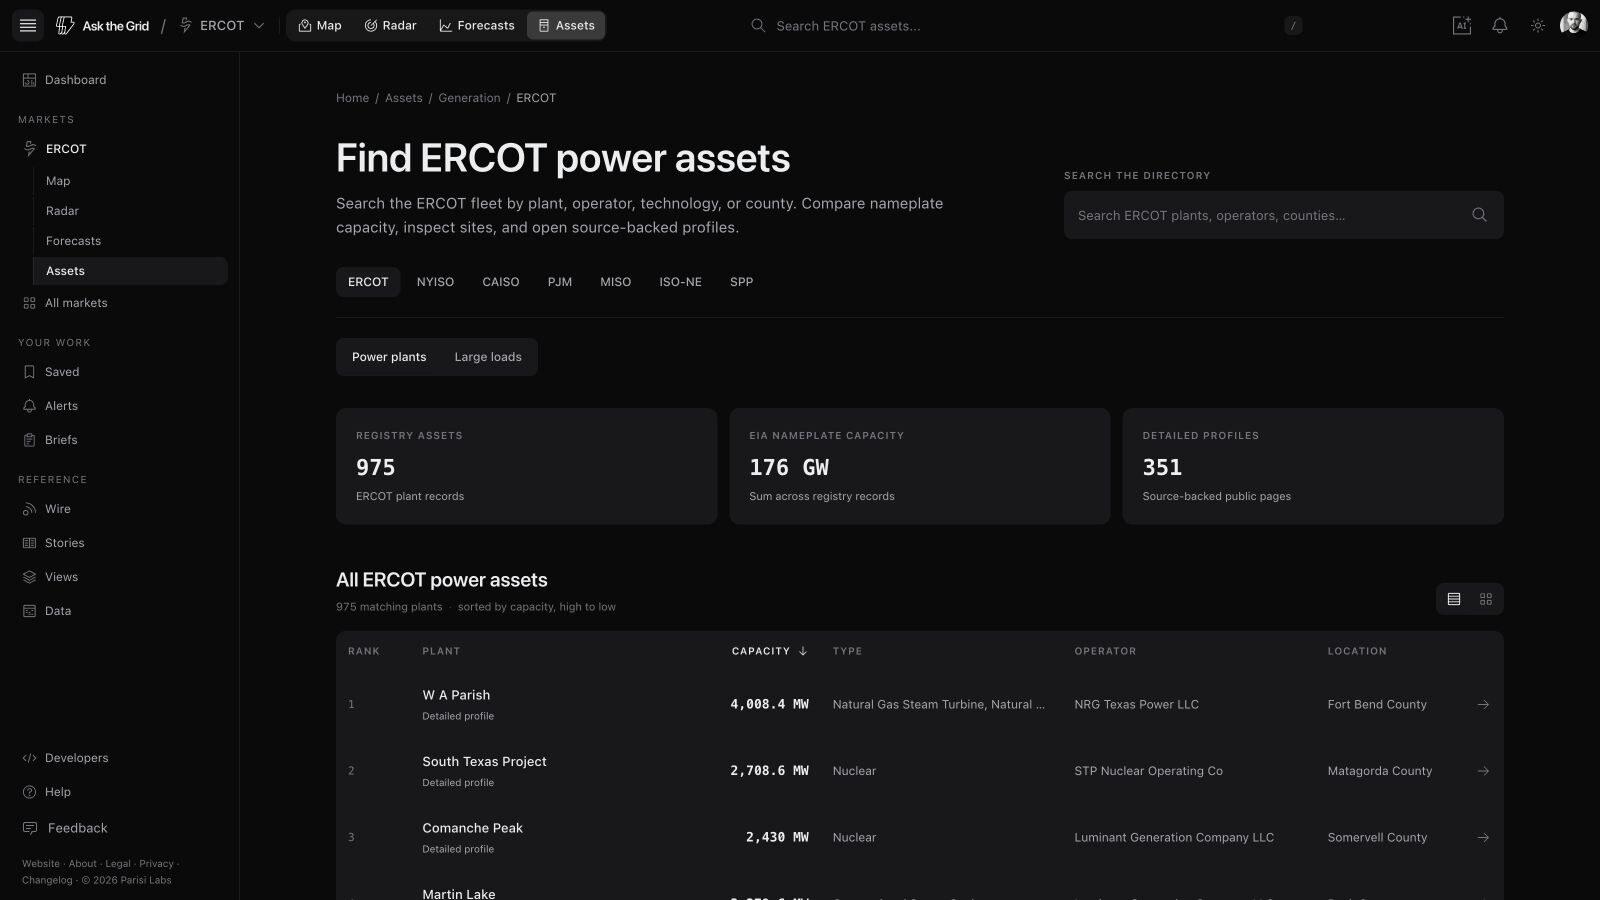
A working profile, not a row in a registry.
Plants, batteries, substations, and lines — each joined to its live market state, dispatch history, ownership, and public record on one page. These are the sections a plant profile renders, in the order the profile’s tab strip lists them. A section that has no data for an asset does not appear.
Overview
Overview tab
Live grid events touching the asset surface first, then the key fields — the headline operating numbers, each with a one-line note on where it comes from or how it is derived. Below them the structured profile, and where the equipment is documented, a layout diagram of the containers, turbines, or panels.
Registry anchor · hydrated public sources
Units and generators
Units tab
Operating generator records and technology attributes: nameplate and net summer capability, energy source, prime mover, status, operating date, and the planned retirement date. Wind turbine manufacturer, model, and hub height, solar tracking and tilt, and storage charge, discharge, and useful-life energy are carried where the filing reports them.
EIA-860
Performance
Performance tab
Monthly generation history and recent market-resource behavior where linked telemetry is available, with peer context — the plant against its technology cohort nationally and in state. Downloadable as CSV.
EIA-923 monthly filings · ERCOT 60-Day SCED Disclosure
Grid and market context
Grid tab
Market registration — settlement point, registered market resources, registered capability — plus operating context from price and outage records, emissions and reported controls, the interconnection record, and the nearest substations. Candidate joins stay labeled until corroborated.
ERCOT public disclosures · ERCOT interconnection queue · U.S. EPA CAMPD · HIFLD
Commercial, land, and environmental record
Commercial tab
Financing events, transactions and agreements, and the land and environmental record — permits, parcels, and disclosures — each row carrying its amount, date, parties, and a link to the document behind it. Only events scoped to the asset itself are listed.
Source-backed public filings and disclosures
Related parties and identifiers
Entities tab
Parties, market resources, and identifiers tied to the asset, with owner, operator, developer, EPC, compliance provider, and interconnecting entity roles kept separate rather than collapsed into one company name.
Entity graph · resolved public records
Timeline and sources
Sources tab
Project milestones and the public references behind the profile, listed by publisher and reference type — every one openable at the original.
The profile's own citation table
Map
Map tab
The asset in place, with a route back onto the live grid map with the selection still attached.
Live map selection
Depth per asset
Not a row in a registry — a working profile: geography, market participation, output history, events, and sources on one page.
Every field has a filing behind it.
A profile is assembled from public records, not scraped prose. These are the publications the fields are read from, and what each one can and cannot tell you.
The publications behind a profile7
Unit records, capacity, technology, status, operating date, and planned retirement
The registry anchor every profile is built on.
Monthly net and gross generation, annual capacity factor
For storage plants, gross generation is shown as a discharge proxy — not a cycle count or a conventional capacity factor.
Disclosed dispatch for the plant's market resources
ERCOT protects resource-specific SCED information for 60 days, so plant output here is historical, never live.
Settlement point, resource mappings, registered capability, unplanned outage disclosures
Price behavior is read at the plant's settlement point over a trailing year.
Queue ID, status, point of interconnection, transmission owner, requested capacity, milestones
Matches carry a confidence and the reasons behind them; a candidate join says so.
Annual gross load, heat input, CO2, SO2 and NOx tonnage, reported unit types, and control technologies
Reported by year, for the units the program covers.
The five nearest substations, with voltage and distance
A public inventory — coverage may be incomplete or generalized.
The agent rides on the asset database, too. Ask it about anything on the screen — it reads the same live data and answers with the source attached.
How it connects.
One live market state runs the whole platform. Follow it into the product, or into the surface next to this one.