The operator’s terminal for energy — in your pocket.
Radar is the operator’s wall of screens, made portable — the whole operating picture of a power market on one screen, readable from a phone.
9 desks and 30 live widgets — load, generation, prices, congestion, weather, the interconnection queue, and operator events where published — all on one clock. Live on ERCOT, NYISO, CAISO, PJM, MISO, ISO-NE, and SPP.
Watch every desk at once
9 desks: Overview, Real-Time, Transmission, Resources, RUC, Renewables, Weather, Queue, and Events.
Now, before, and next
Actuals, forecasts, and history share one clock, so you watch a regime change happen.
Every tile is a live feed
Up to 30 widgets read live ISO data, with each market showing only the feeds its operator publishes.
The desk you’d sit at.
Three screens, one operating picture — the same cockpit that runs in the product, on the wall in front of you.
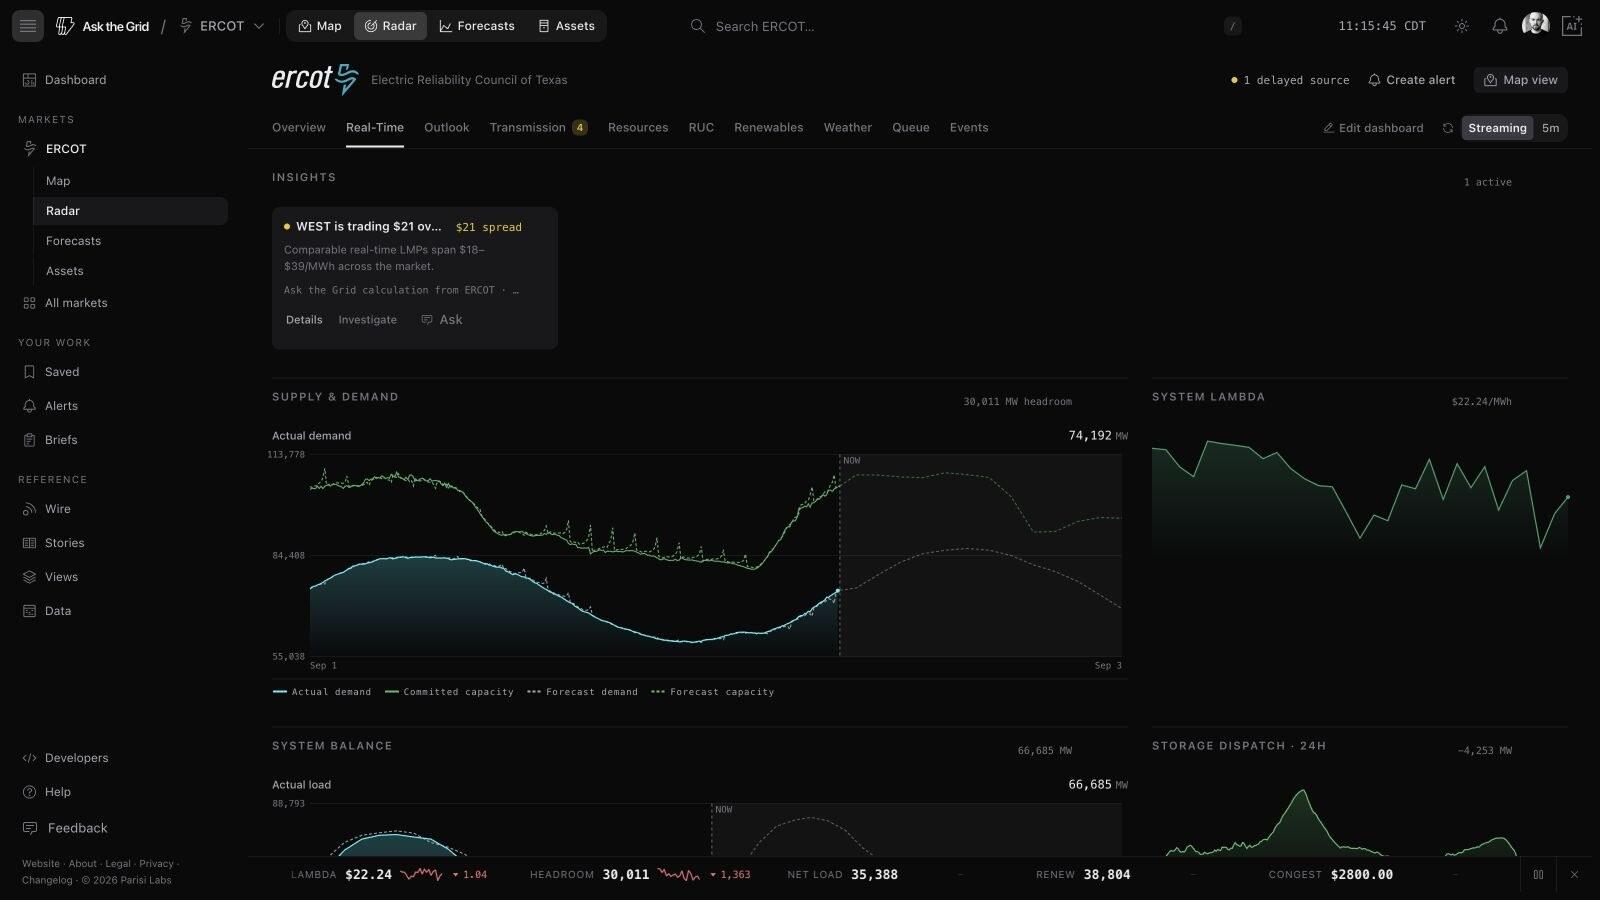
The agent rides on the radar, too. Ask it about anything on the screen — it reads the same live data and answers with the source attached.
A cockpit you can trust because it never guesses.
Every screen on the wall is a live ISO feed on its own clock — the same discipline that runs through the whole platform.
Every tile is a live feed.
Each supported monitor reads a real market publication on its own clock — nothing on the wall is a static image or a canned demo.
A missing feed reads as missing.
When a source has not published, the tile renders an empty or skeleton state. Nothing is interpolated, back-filled, or invented to fill the space.
Now, before, and next share one clock.
Actuals, forecasts, and history are time-aligned across every desk, so a regime change is something you watch happen — not reconstruct after the fact.
The operator’s desks, and how many widgets each carries
9
- 01Overview12 widgets
- 02Real-Time10 widgets
- 03Transmission6 widgets
- 04Resources5 widgets
- 05RUC4 widgets
- 06Renewables5 widgets
- 07Weather4 widgets
- 08Queue6 widgets
- 09Events5 widgets
Every desk is filled entirely with real market data (ERCOT, NYISO, CAISO, PJM, MISO, ISO-NE, and SPP; ERCOT shown here).
Every screen, all at once.
The whole wall in one place — 30 live widgets across 9 desks, each on its own clock.
Normal · Watch · Stressed, at a glance
Load, headroom, price, lambda in one strip
Auto-flagged departures from normal
Realized demand against committed capacity
Gas, wind, solar, nuclear, coal, storage
Load against committed capacity
Real-time prices across hubs and load zones
Clearing prices at the DC interties
Binding transmission constraints, ranked
Real-time price against the forecasts
Clearing across the AS products
Fleet charge / discharge and net position
Capacity committed out of market
Wind output across the footprint
Solar output across the footprint
Temperature across ERCOT weather zones
The marginal system price
Battery dispatch over the last day
Zone temperature forecast, next 24h
Binding-constraint history over the day
Real-time against day-ahead basis
The 7-day operating-event stream
ISO notices and messages in view
Your personal alert activity
Active pipeline, entered, exited, overdue
COD slips, entries, exits, resizes
Projected delivery years for the queue
Active capacity across queue publications
Median project age in the queue
GW by technology across the active queue
Tiles show each widget’s name and shape — representative skeletons, not readouts. In the product every one carries a real, source-stamped value on the shared clock.
The whole grid, on one screen, right now.
Open the cockpit and watch it move — a terminal for the energy markets, in your pocket.