
CAISO grid conditions, prices and demand
California Independent System Operator · California
Explore CAISO electricity prices, demand, renewable output and storage operations. Open the California grid map to compare pricing locations and inspect infrastructure, then ask the agent to investigate the published evidence.
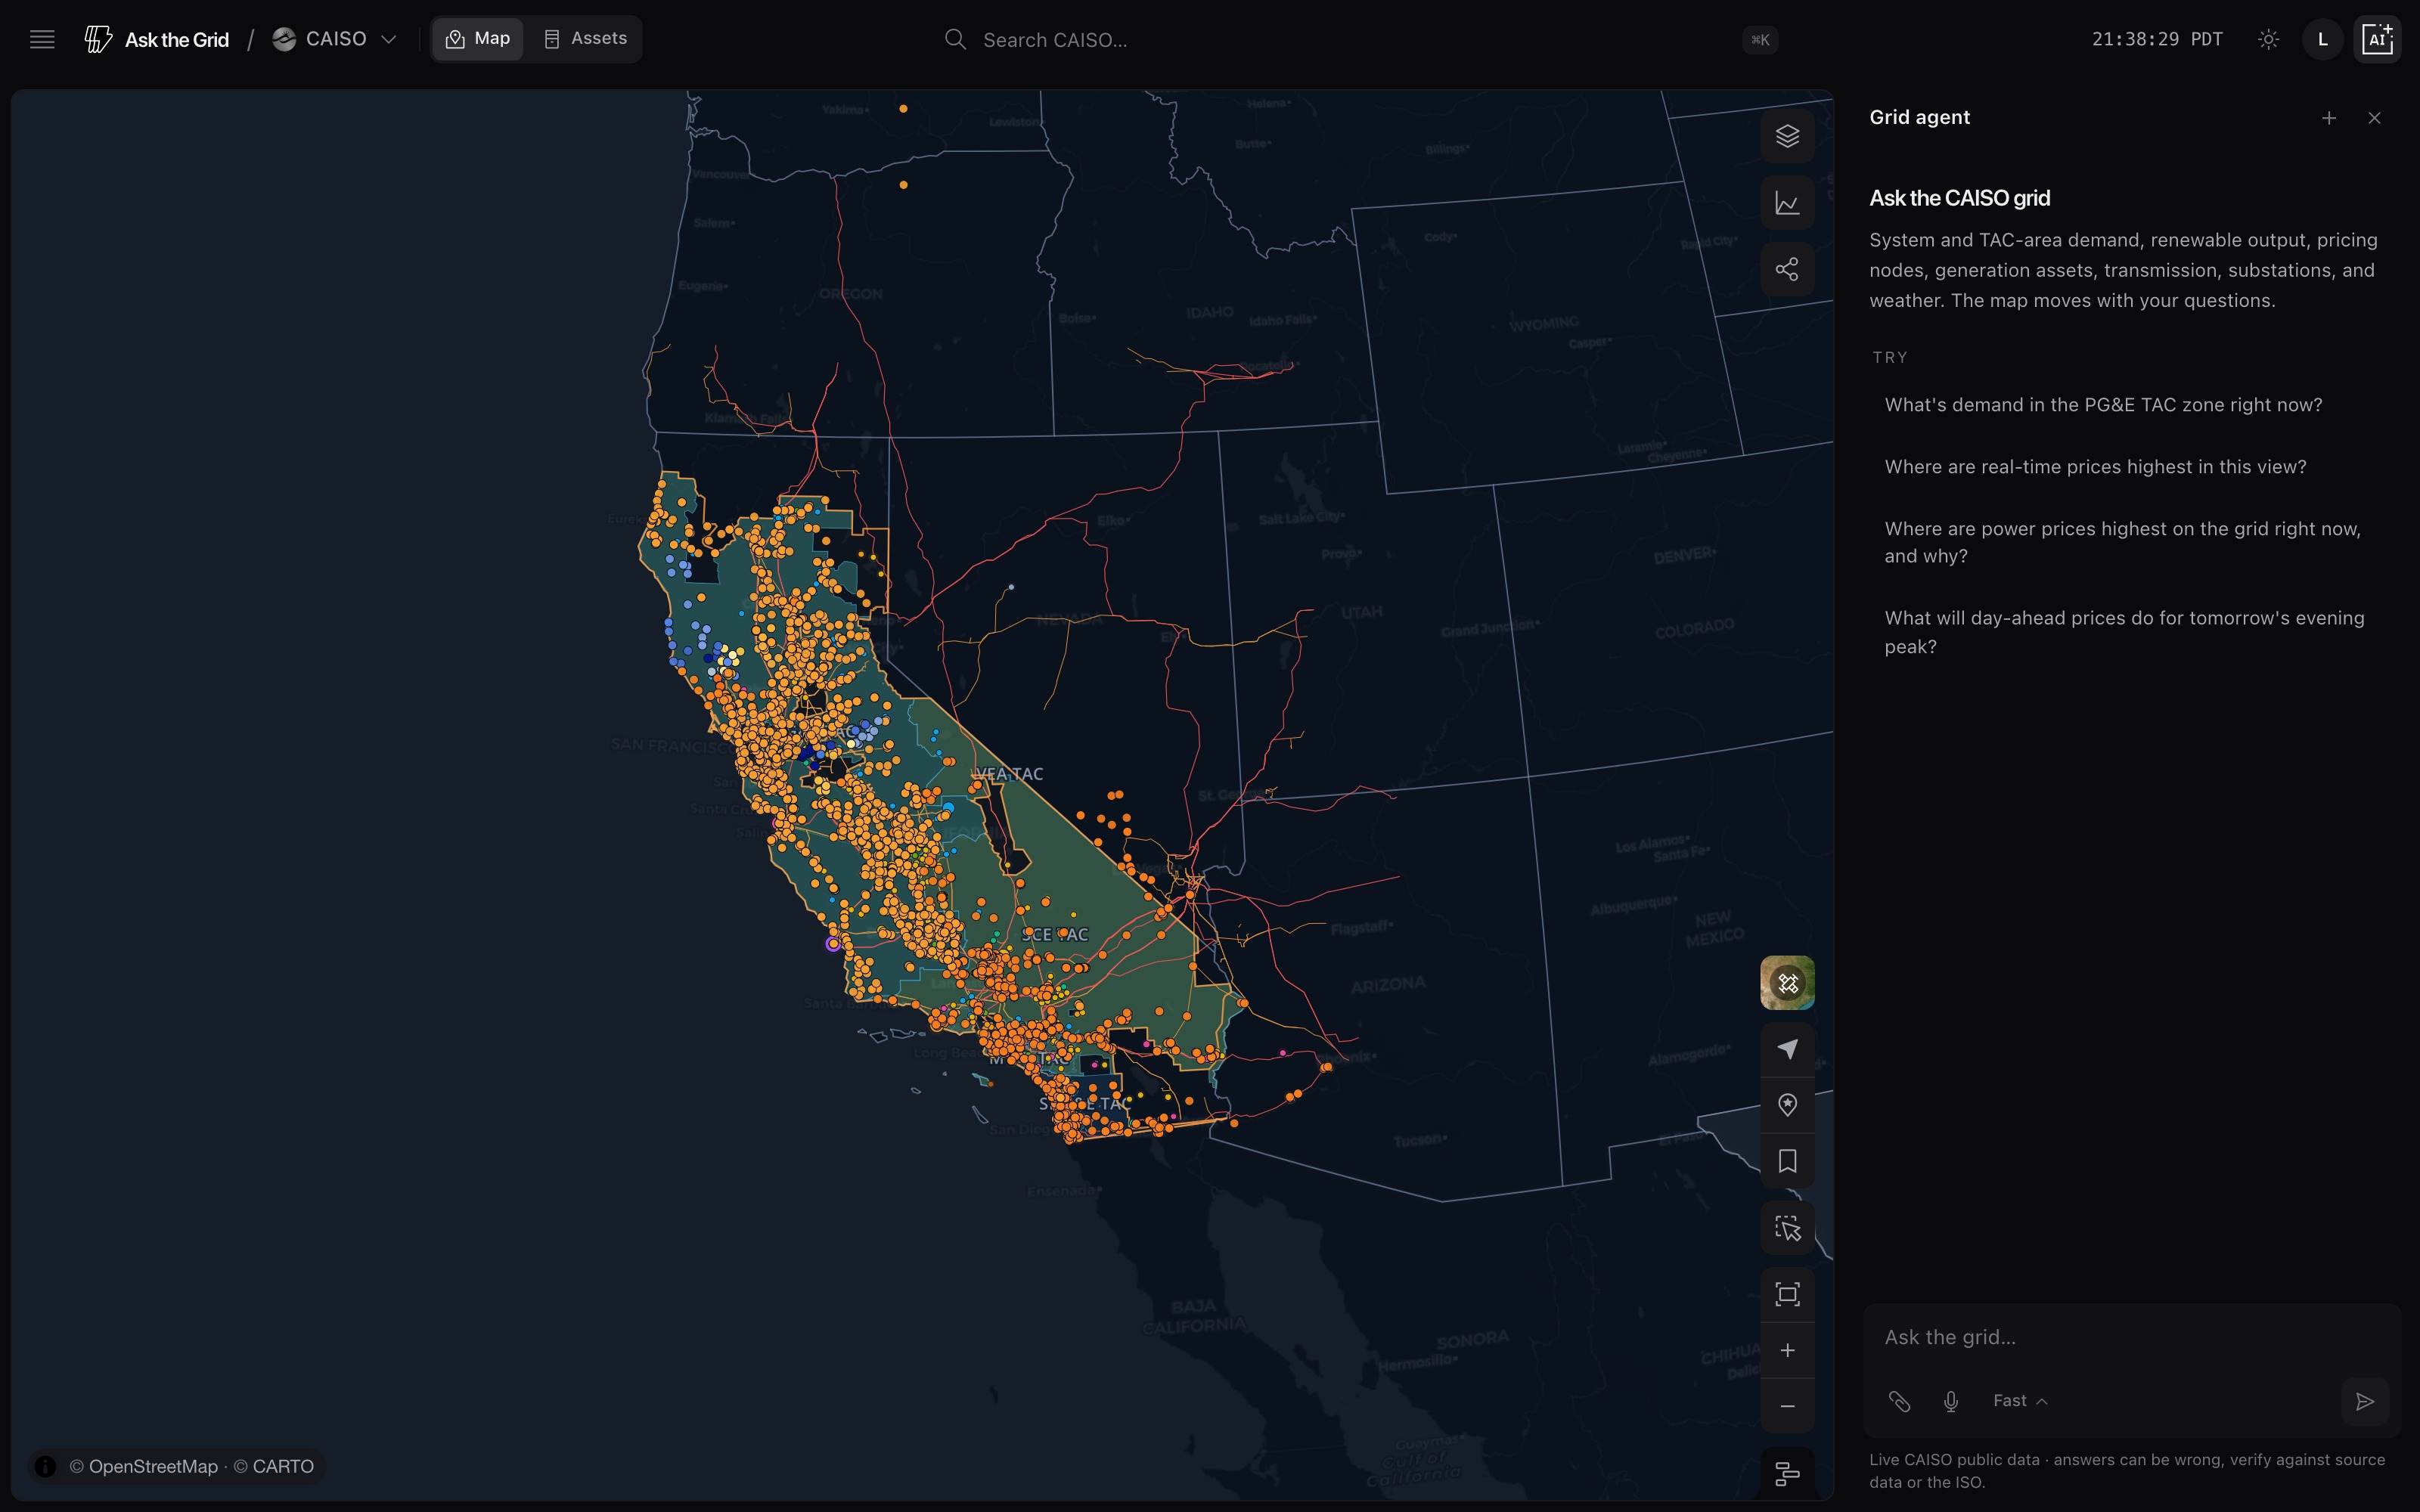
CAISO on the live map
LiveWhat you can ask CAISO
Open the agentClick any question to open it in the live agent with the market already selected. The answer keeps its sources attached.
What's live here
Every dataset, sourced10 coverage areas live today. Each row is backed by named source feeds in the public data catalog — cadence and provenance included.
| Coverage | Detail | Cadence | Status |
|---|---|---|---|
| Real-time LMPs | RTPD nodal prices with explicit energy, congestion, and loss components at every pricing node | 15-min (RTPD) | Live |
| Day-ahead LMPs | Hourly day-ahead nodal prices — the cleared expectation to compare against real time | Hourly (DAM) | Live |
| Battery storage | Five-minute net battery output for the footprint — standalone and hybrid, discharge positive, charge negative | 5-min | Live |
| Renewables | Hourly solar and wind actuals — the inputs to net load and the evening ramp | Hourly | Live |
| Demand | Hourly actual load for the system and transmission access charge areas, plus near-term forecast horizons | Hourly / 5-min forecast | Live |
| Intertie congestion | Five-minute shadow prices on intertie constraints by tie and direction — the CAISO–West seam made visible | 5-min | Live |
| Nomogram constraints | Five-minute shadow prices on multi-element stability and transfer limits | 5-min | Live |
| Node reference | The PNode registry — names, types, voltages, and effective windows for labeling every price | Reference | Live |
| Assets & weather | Plant profiles from EIA-860 and HIFLD, plus ERA5 weather history and forecast grids | Reference / hourly | Live |
| Radar cockpit | Live renewable generation, storage dispatch, supply and demand, prices, congestion, and operator-source clocks | Streaming / 5-min | Live |
Live intelligence for CAISO
Browse every live viewEverything Ask the Grid publishes on CAISO, in one place — what the grid is doing now, where it is headed, and what has been written about it.
Live views
Forecasts and outlooks
Coverage and analysis
Data and access
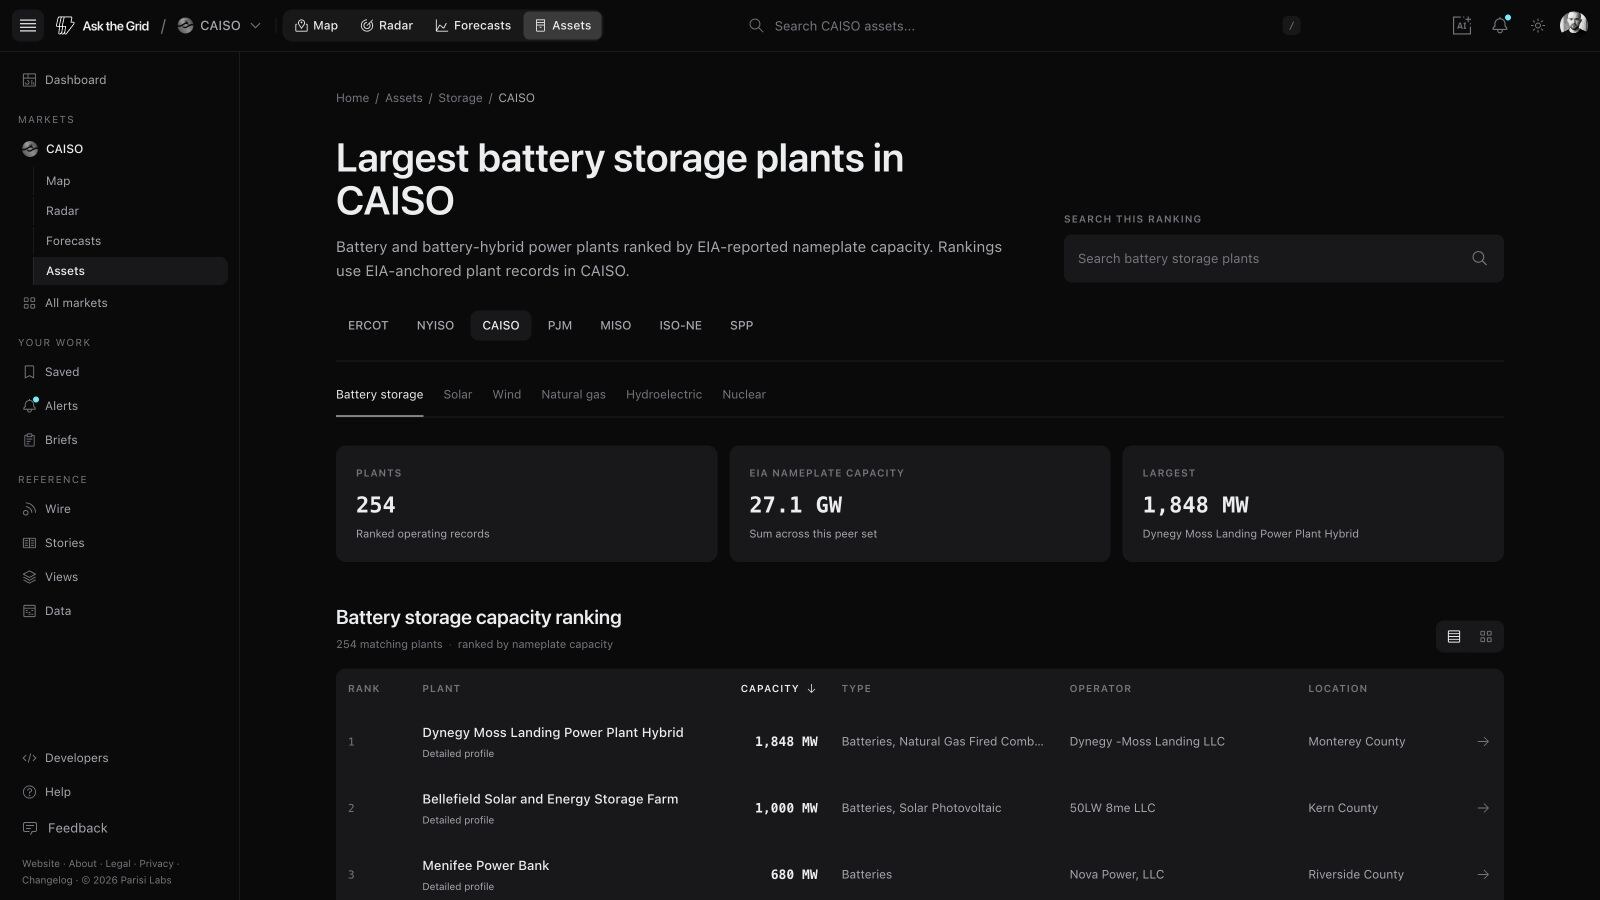
CAISO power plant registry
CAISO’s EIA-anchored plant registry is searchable by operator, technology, and county, with capacity ranked.
Registry assets
1,593CAISO plant records
EIA nameplate capacity
93GW
The product, as it runs
Recorded from the live product, with this market's data.
Read California prices, net load and storage
CAISO publishes locational electricity prices with energy, congestion and loss components. The price View uses the 15-minute real-time pre-dispatch series; day-ahead prices are a separate market result. Compare matching locations and delivery times before reading a spread.
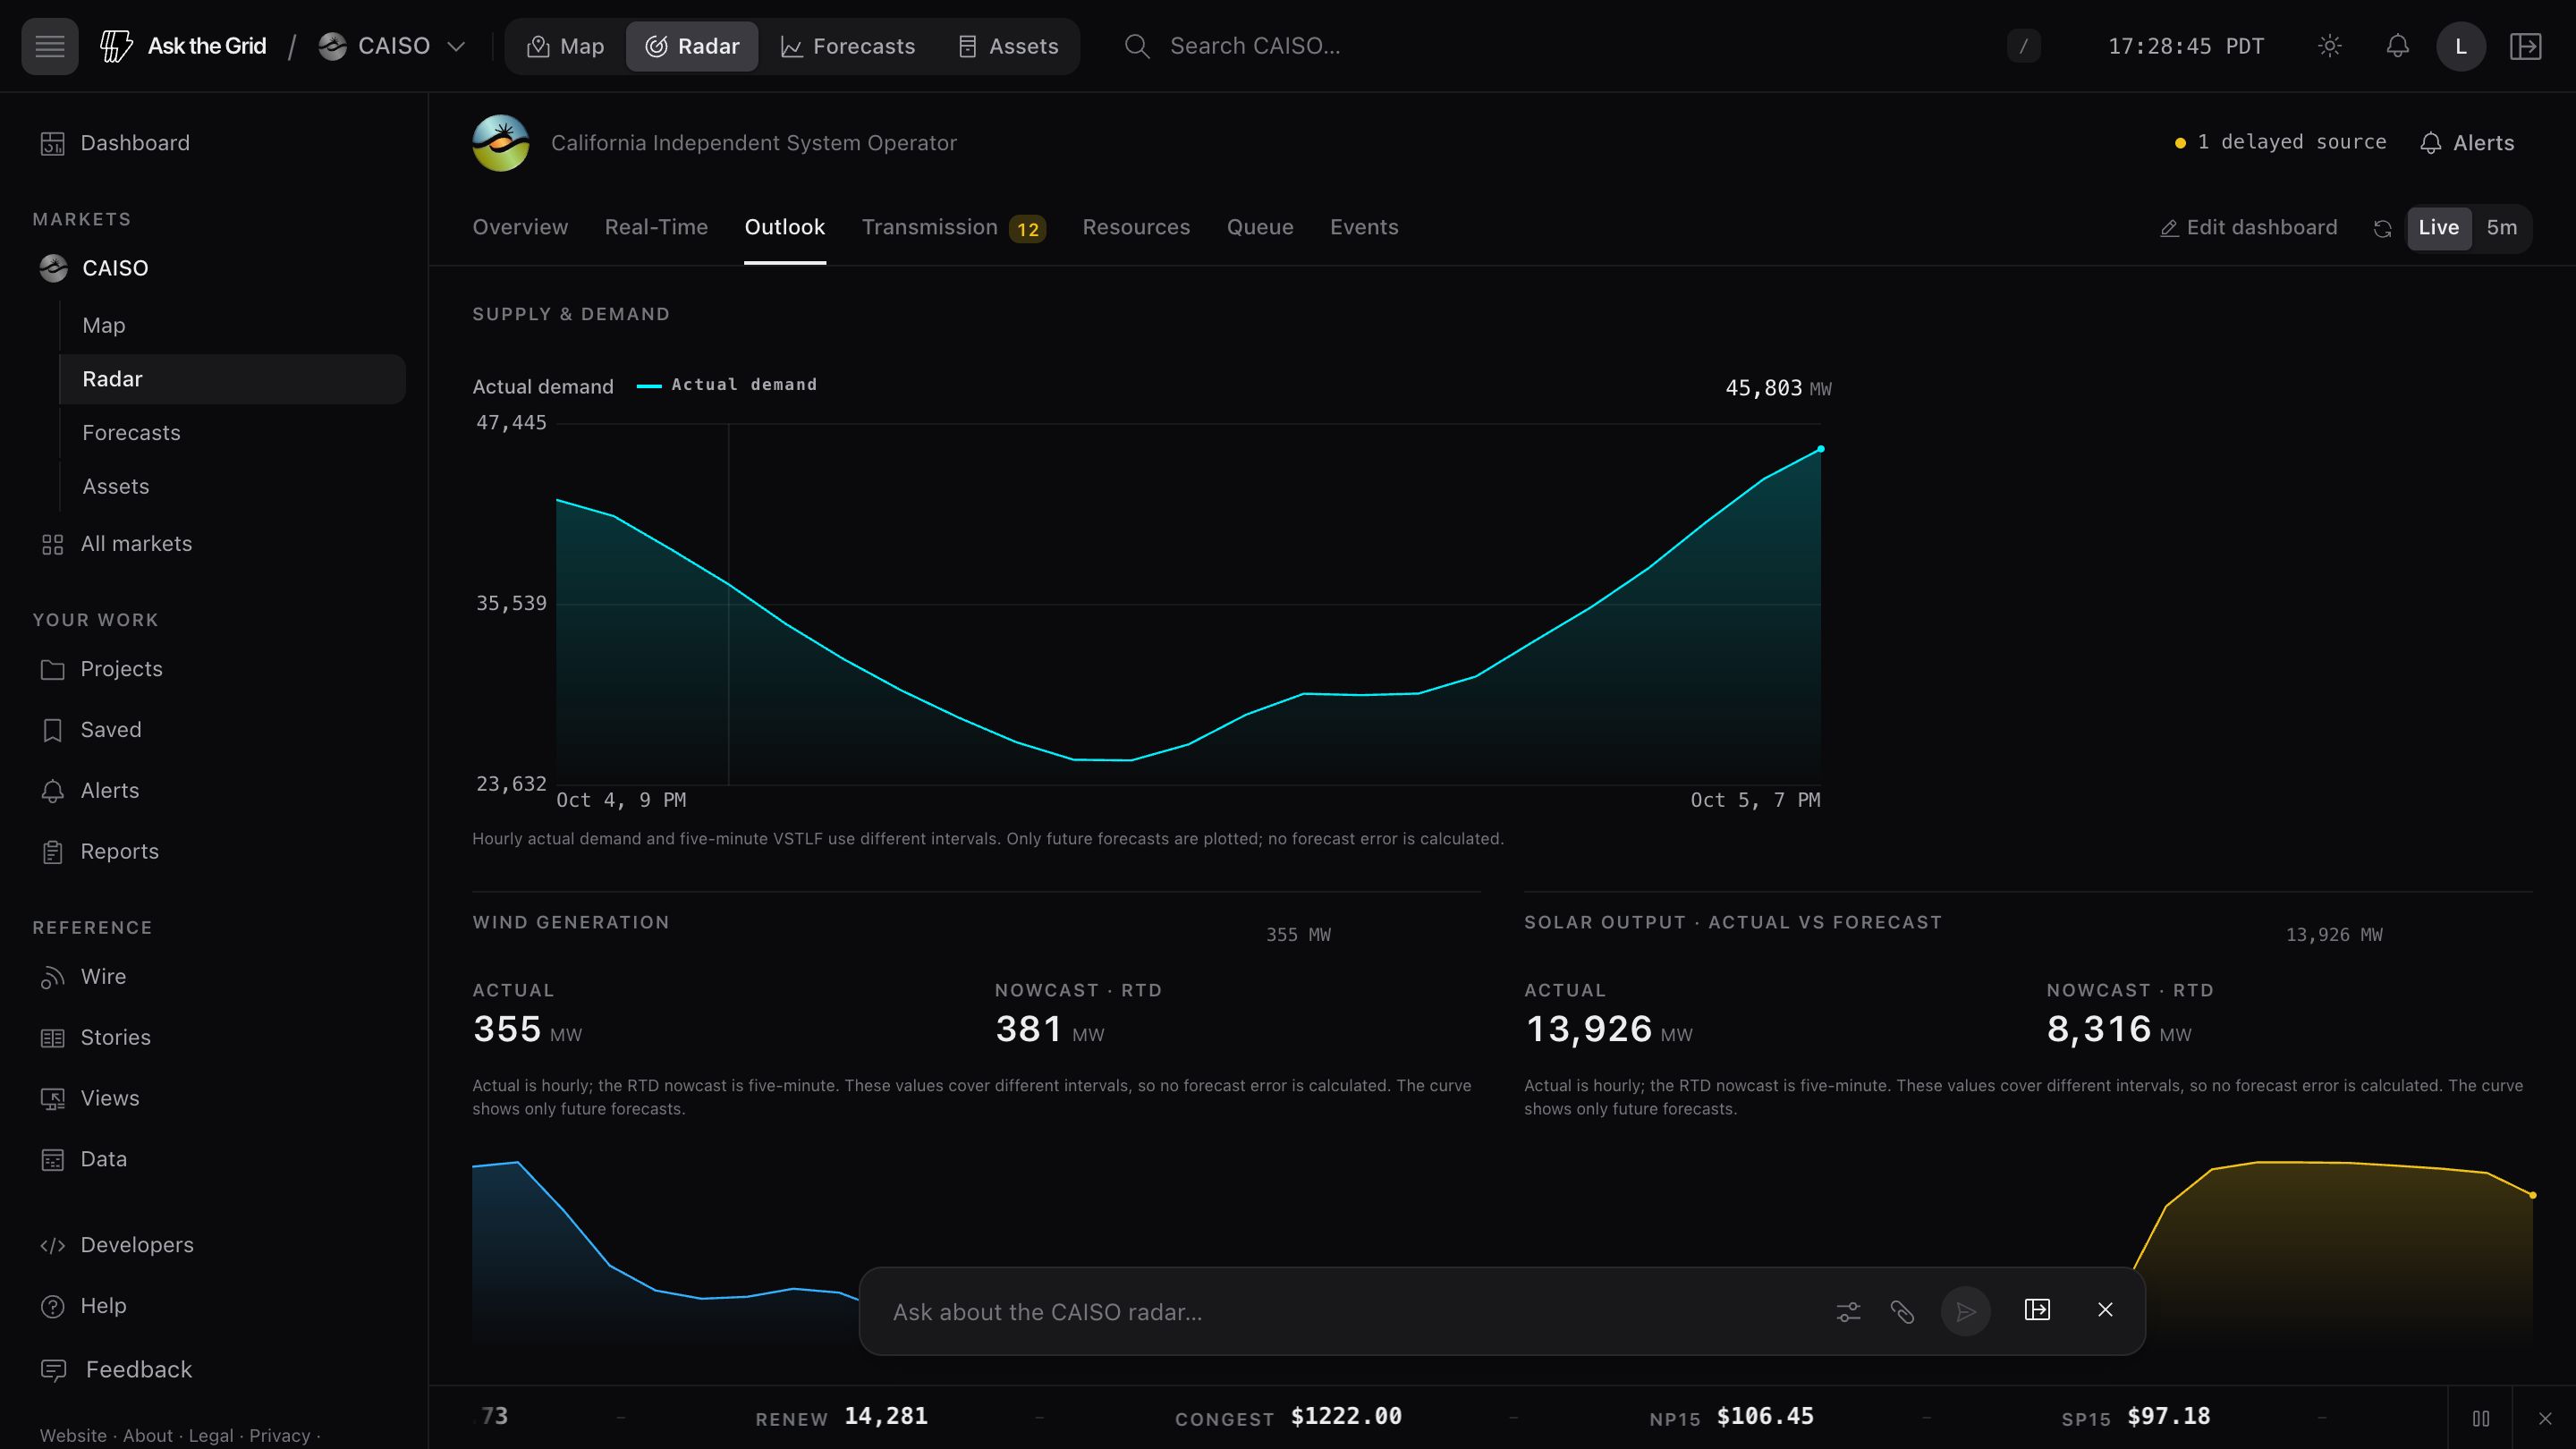
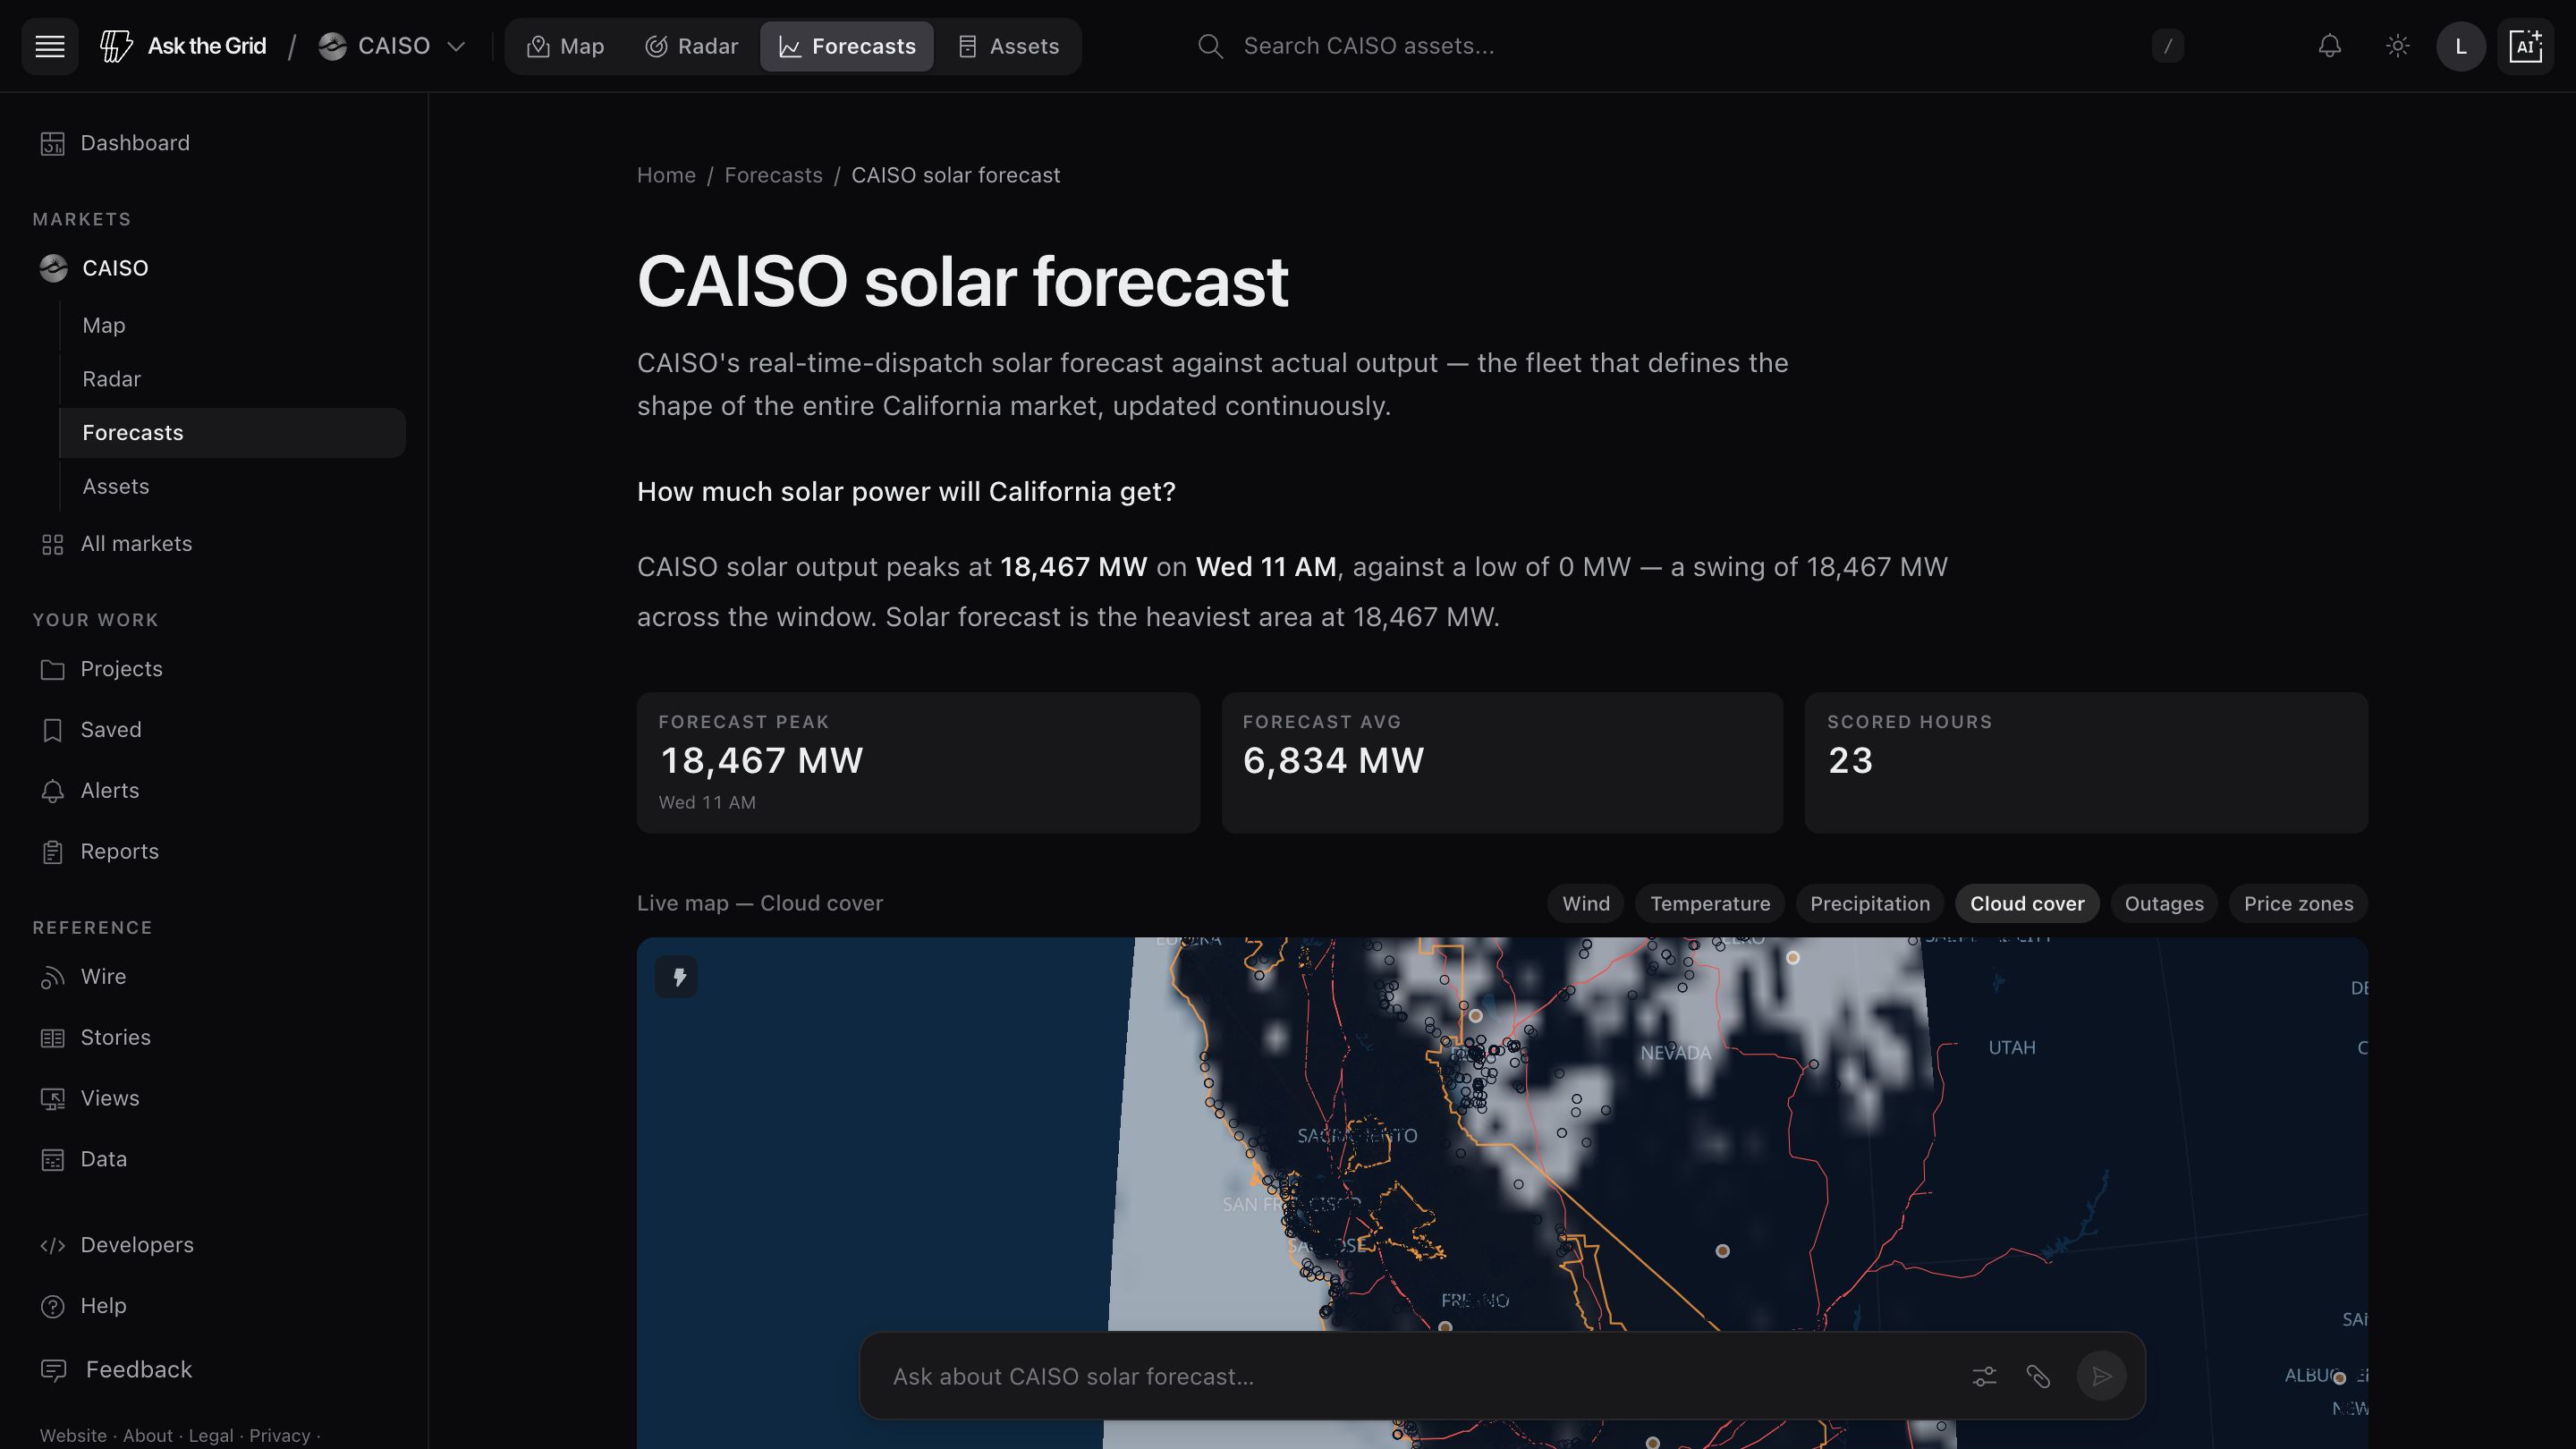
Demand, renewable output and net battery output help put the price interval in context. Battery output is positive when discharging and negative when charging. Compare solar production and the demand outlook when investigating changes in net load.
Open the CAISO map for pricing locations and infrastructure, or use Radar to follow the published operating series. Western market participation and CAISO's balancing-area footprint describe different scopes; a neighboring participant is not part of California's grid territory.
Ask CAISO what changed.
Open the live market and begin with a question, a place, or an interval.