Ask the Grid

Free asset assessment

No cost · delivered by email

How did your battery actually perform in the market?

See how the asset operated, where estimated gross revenue came from, and how dispatch compared with transparent baselines. Start with public market data; add operator data later for a reconciled view.

For battery owners, operators, investors, optimizers, lenders, and acquisition teams.
High-level intake first. Sensitive data is scoped separately.

Ask the Grid · Assessment01 / 18

Market performance

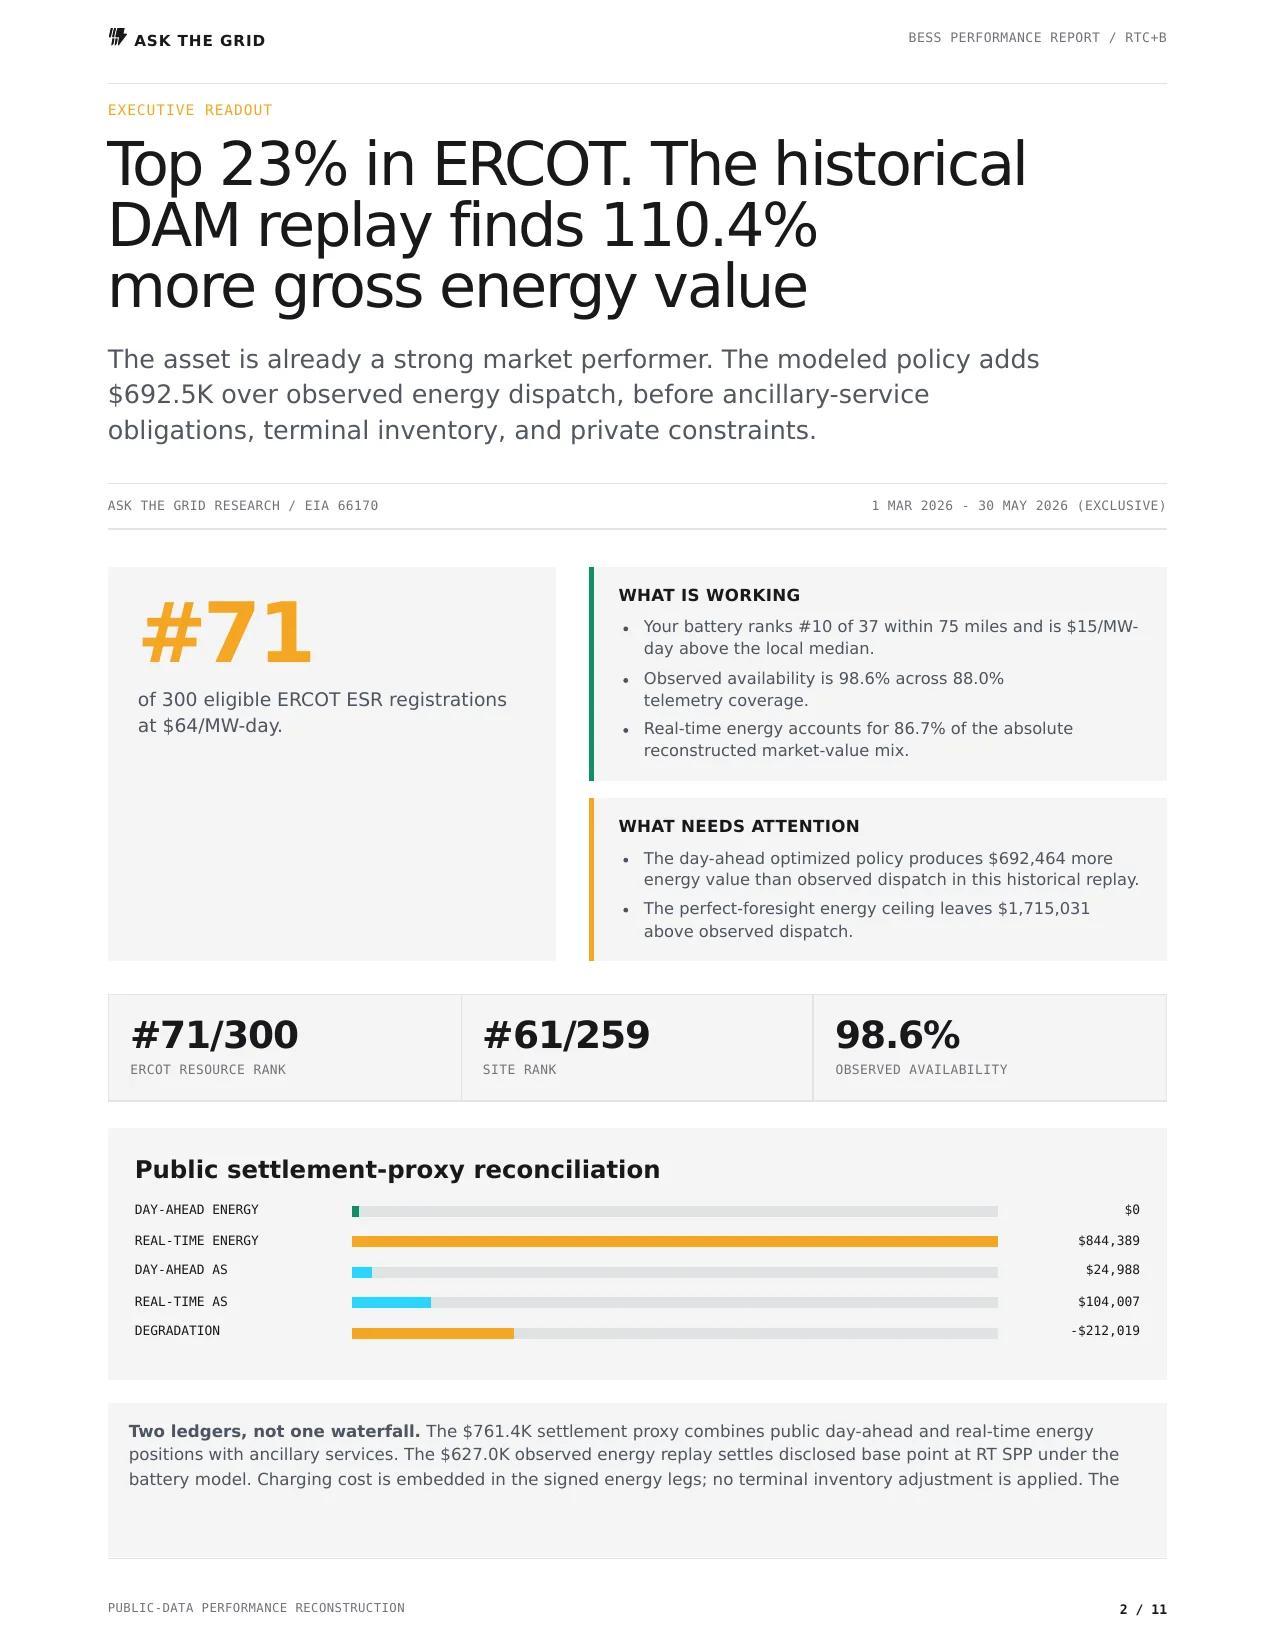
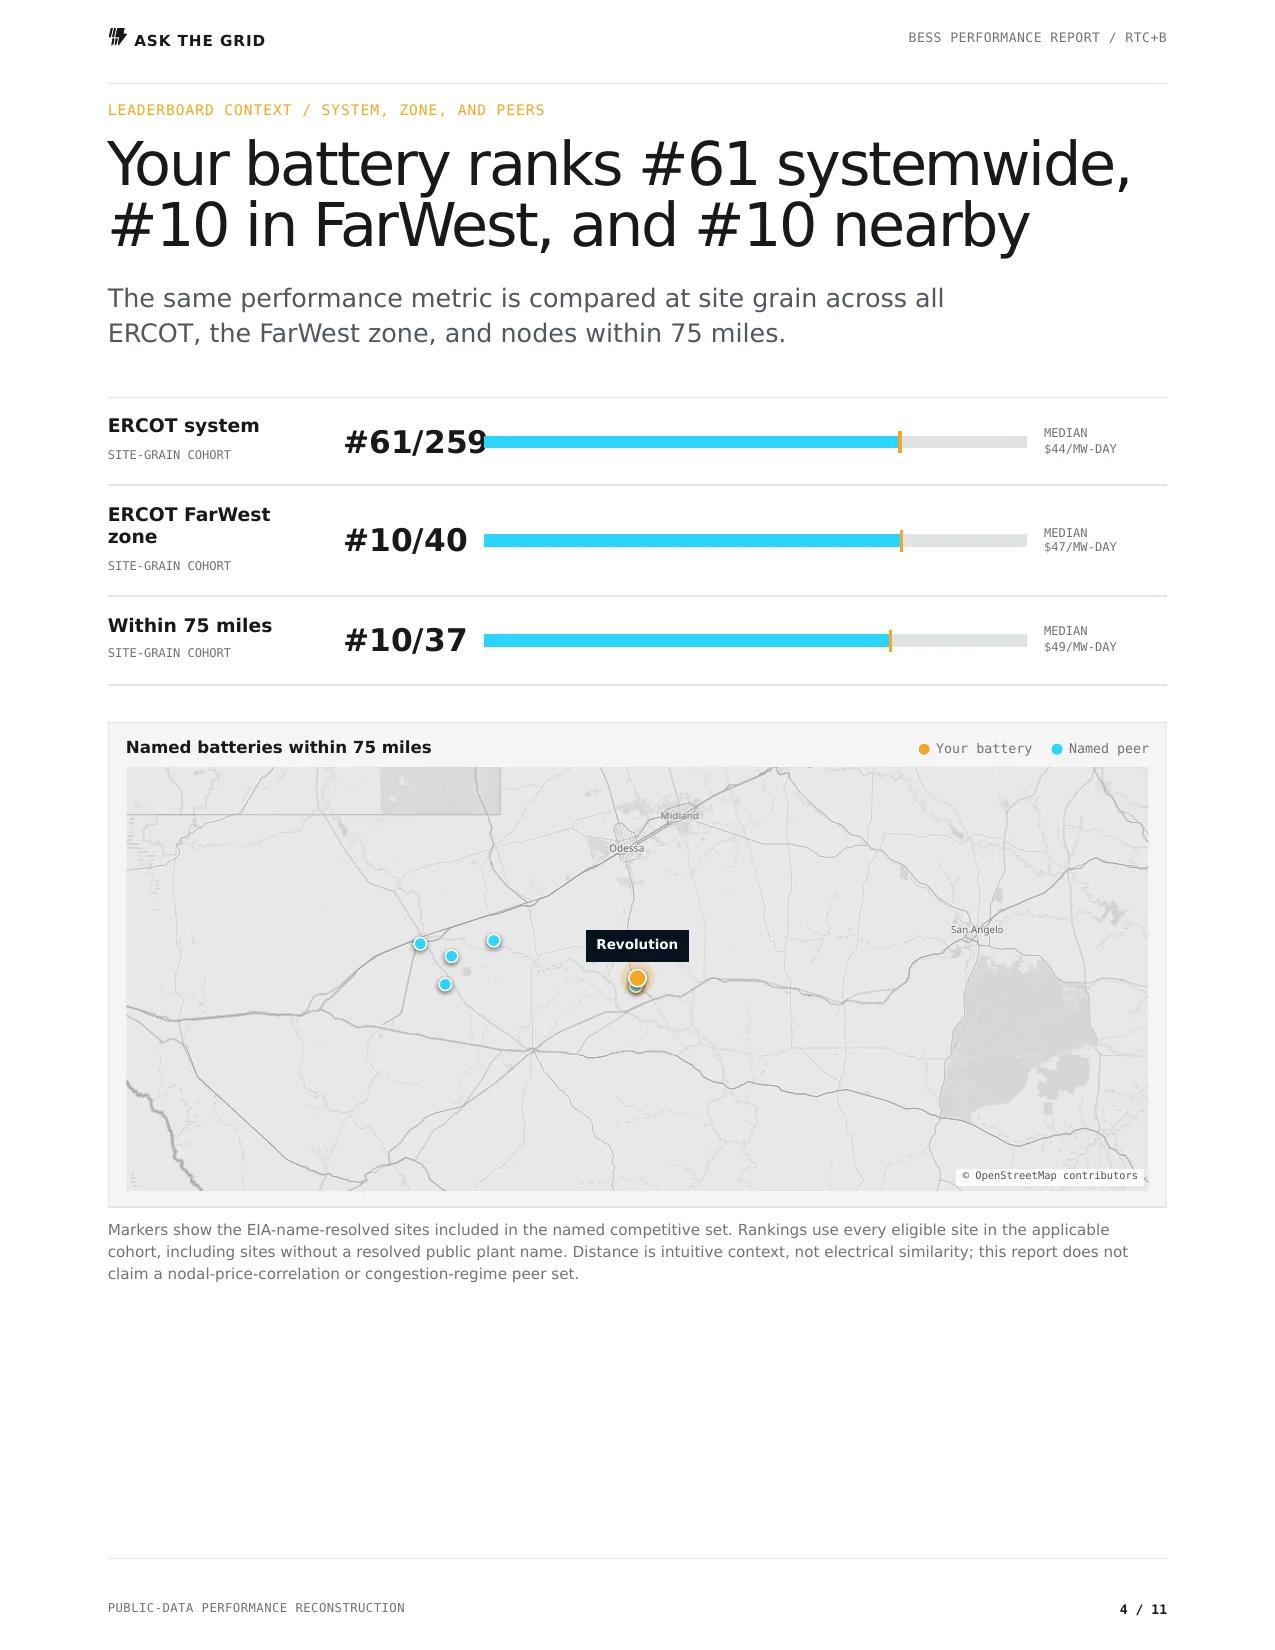
Illustrative 100 MW / 200 MWh battery

$1.20m

Estimated gross market revenue · 30 days

75.0%

Observed / oracle

84.4%

Modeled / oracle

$150k

Modeled uplift

97.8%

Interval coverage

Illustrative example · not an observed asset or customer result

Inside the report

A decision artifact, not a gated brochure.

The output is designed to be reviewed: headline result, evidence, method, uncertainty, and the next data request all live in the same document.

01

Executive performance scorecard

Estimated gross revenue, market participation, data coverage, cycling, concentration, and the few events that explain the period.

02

Revenue and dispatch reconstruction

A time-aligned view of price, charging, discharging, state of charge when available, and cumulative estimated gross revenue.

03

Comparable strategy ladder

Observed dispatch beside a hold baseline, a transparent modeled strategy, and a perfect-foresight oracle that is explicitly an unattainable ceiling.

04

Opportunity and stress-day review

The intervals and operating constraints associated with the largest modeled gaps, without turning hindsight into a promise of achievable profit.

05

Evidence and assumptions appendix

Source, vintage, settlement granularity, asset identity, efficiency, state-of-charge policy, exclusions, and every material coverage gap.

06

A report built to circulate

A concise PDF-style report plus machine-readable assumptions and interval outputs when the supplied data permits them.

Sample pages

The numbers stay attached to their boundary.

Every value below is illustrative. It is not an observed asset, customer result, quote, or promise.

Ask the Grid · Assessment01 / 18

Market performance

Illustrative 100 MW / 200 MWh battery

$1.20m

Estimated gross market revenue · 30 days

75.0%

Observed / oracle

84.4%

Modeled / oracle

$150k

Modeled uplift

97.8%

Interval coverage

Illustrative example · not an observed asset or customer result

Ask the Grid · Assessment06 / 18

Actual, modeled, and oracle

Gross value ladder
Observed dispatch$1.20m
Modeled strategy$1.35m
Oracle ceiling$1.60m

Each comparison uses the same MW, MWh, efficiency, state-of-charge, and point-of-interconnection limits.

Daily cumulative value
ObservedModeledOracle
Energy

62%

Ancillary services

38%

Illustrative example · not an observed asset or customer result

Methodology

The method is part of the deliverable.

A result without provenance is difficult to use and impossible to challenge. The report exposes the evidence, transformations, assumptions, and unresolved gaps that produced the answer.

  1. 01

    Resolve the asset and clock

    Match the resource, settlement point, market interval, timezone, and reporting window before calculating a dollar.

  2. 02

    Audit coverage before performance

    Measure missing intervals, telemetry availability, grouping assumptions, and settlement compatibility so confidence follows the evidence.

  3. 03

    Reconstruct, then benchmark

    Estimate observed gross market value from the best available dispatch and price data, then run each benchmark under the same MW, MWh, efficiency, state-of-charge, and point-of-interconnection constraints.

  4. 04

    Keep hindsight in its lane

    Use a perfect-foresight oracle only as a ceiling. Publication-aware or simple baselines carry the actionable comparison.

  5. 05

    Separate market products

    Energy and ancillary-service value are shown separately. No report claims full co-optimization unless the awards, deployments, prices, and model actually support it.

  6. 06

    Publish the uncertainty

    Show concentration, seasonal stability, data limitations, and the difference between a public reconstruction and an operator-verified settlement reconciliation.

Data ladder

Start light. Earn each stronger claim.

The landing form asks only for enough context to establish coverage. Sensitive records move through a separately scoped handoff only when they materially change the report.

01Screen

Enough to start

ISO, asset or resource name, settlement point if known, reporting period, MW, and duration.

02Model

Better with operating context

Dispatch, state of charge, availability, outages, awards, and the physical limits used by the operator.

03Verify

Verified economics

Settlement statements, fees, contracts, degradation, tolls, and O&M are required before an estimated gross reconstruction can become a reconciled net result.

Evidence boundary

What this report will not pretend to know.

  • Public-data reconstruction is estimated gross market revenue—not profit, a settlement statement, or investment advice.

  • The oracle is an unattainable hindsight ceiling, never a forecast or promised uplift.

  • Hedges, tolls, degradation, fees, and contract economics remain excluded unless supplied and explicitly reconciled.

  • Sensitive telemetry and settlements are not collected in this landing-page form; a secure data boundary is scoped separately.

Questions

Before you request it.

Can you start with public data only?+

Yes. The first version can be a clearly labeled public-data reconstruction. It estimates gross market value and operating behavior; it does not pretend to be the operator's settlement statement.

What makes the result operator-verified?+

Operator telemetry, availability, awards, state of charge, and settlement records must be reconciled against the public reconstruction, with included and excluded costs listed.

Does the report promise recoverable missed revenue?+

No. It separates transparent, publication-aware benchmarks from a perfect-foresight ceiling and identifies data or operating constraints before calling any gap actionable.

Which markets can start from public data alone?+

ERCOT is the current public named-resource starting point. For PJM, CAISO, NYISO, or another market, operator dispatch or telemetry is required before we can reconstruct an individual battery's performance.

Request the assessment

One real asset. One bounded question.

Complete the high-level intake, confirm the request with a free account, and we will deliver the finished report to that verified email after the inputs have been reviewed.

  1. 01Describe the asset or property
  2. 02Sign in to confirm the recipient
  3. 03Receive data questions and the report by email

Free · high-level intake

Request the Battery market performance

~2 min

Start with identifiers and operating context only. Do not paste bills, telemetry, settlements, or agreements here; we will scope a secure handoff if the report needs them.

Your verified account email is used for delivery. By continuing, you agree to the Privacy Policy. This request records high-level intake only and does not start an automated study.