
MISO grid conditions, prices and generation
Midcontinent Independent System Operator · Central United States
Explore MISO electricity prices, demand and generation across its regional system. Open the grid map to compare pricing locations, inspect transmission and queue projects, or ask the agent to investigate the published data.
MISO on the live map
LiveWhat you can ask MISO
Open the agentClick any question to open it in the live agent with the market already selected. The answer keeps its sources attached.
What's live here
Every dataset, sourced5 coverage areas live today. Each row is backed by named source feeds in the public data catalog — cadence and provenance included.
| Coverage | Detail | Cadence | Status |
|---|---|---|---|
| Real-time prices | Nodal and hub prices as MISO publishes them | 1-min snapshots / 5-min RT | Live |
| Demand & forecasts | Actual load and forecast series across the footprint | 5-min – hourly | Live |
| Fuel mix | Generation by fuel, with wind as the headline series | 5-min / hourly | Live |
| Constraints | Binding-constraint and congestion evidence | 1-min snapshots / hourly | Live |
| Radar cockpit | Live system conditions, north-south transfer limits, hub and zone prices, forecasts, generation, congestion, and source clocks | Streaming / 5-min | Live |
Live intelligence for MISO
Browse every live viewEverything Ask the Grid publishes on MISO, in one place — what the grid is doing now, where it is headed, and what has been written about it.
Live views
Forecasts and outlooks
Coverage and analysis
Data and access
The product, as it runs
Real product screenshots, shown in full.
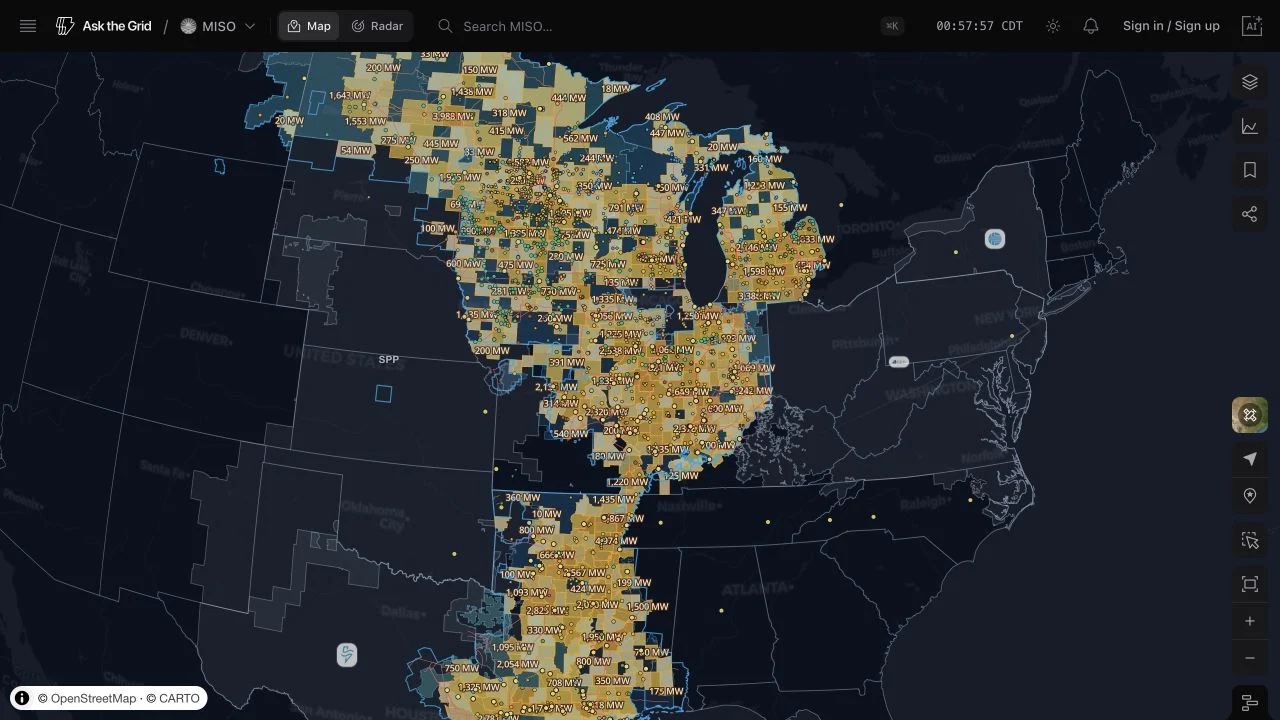
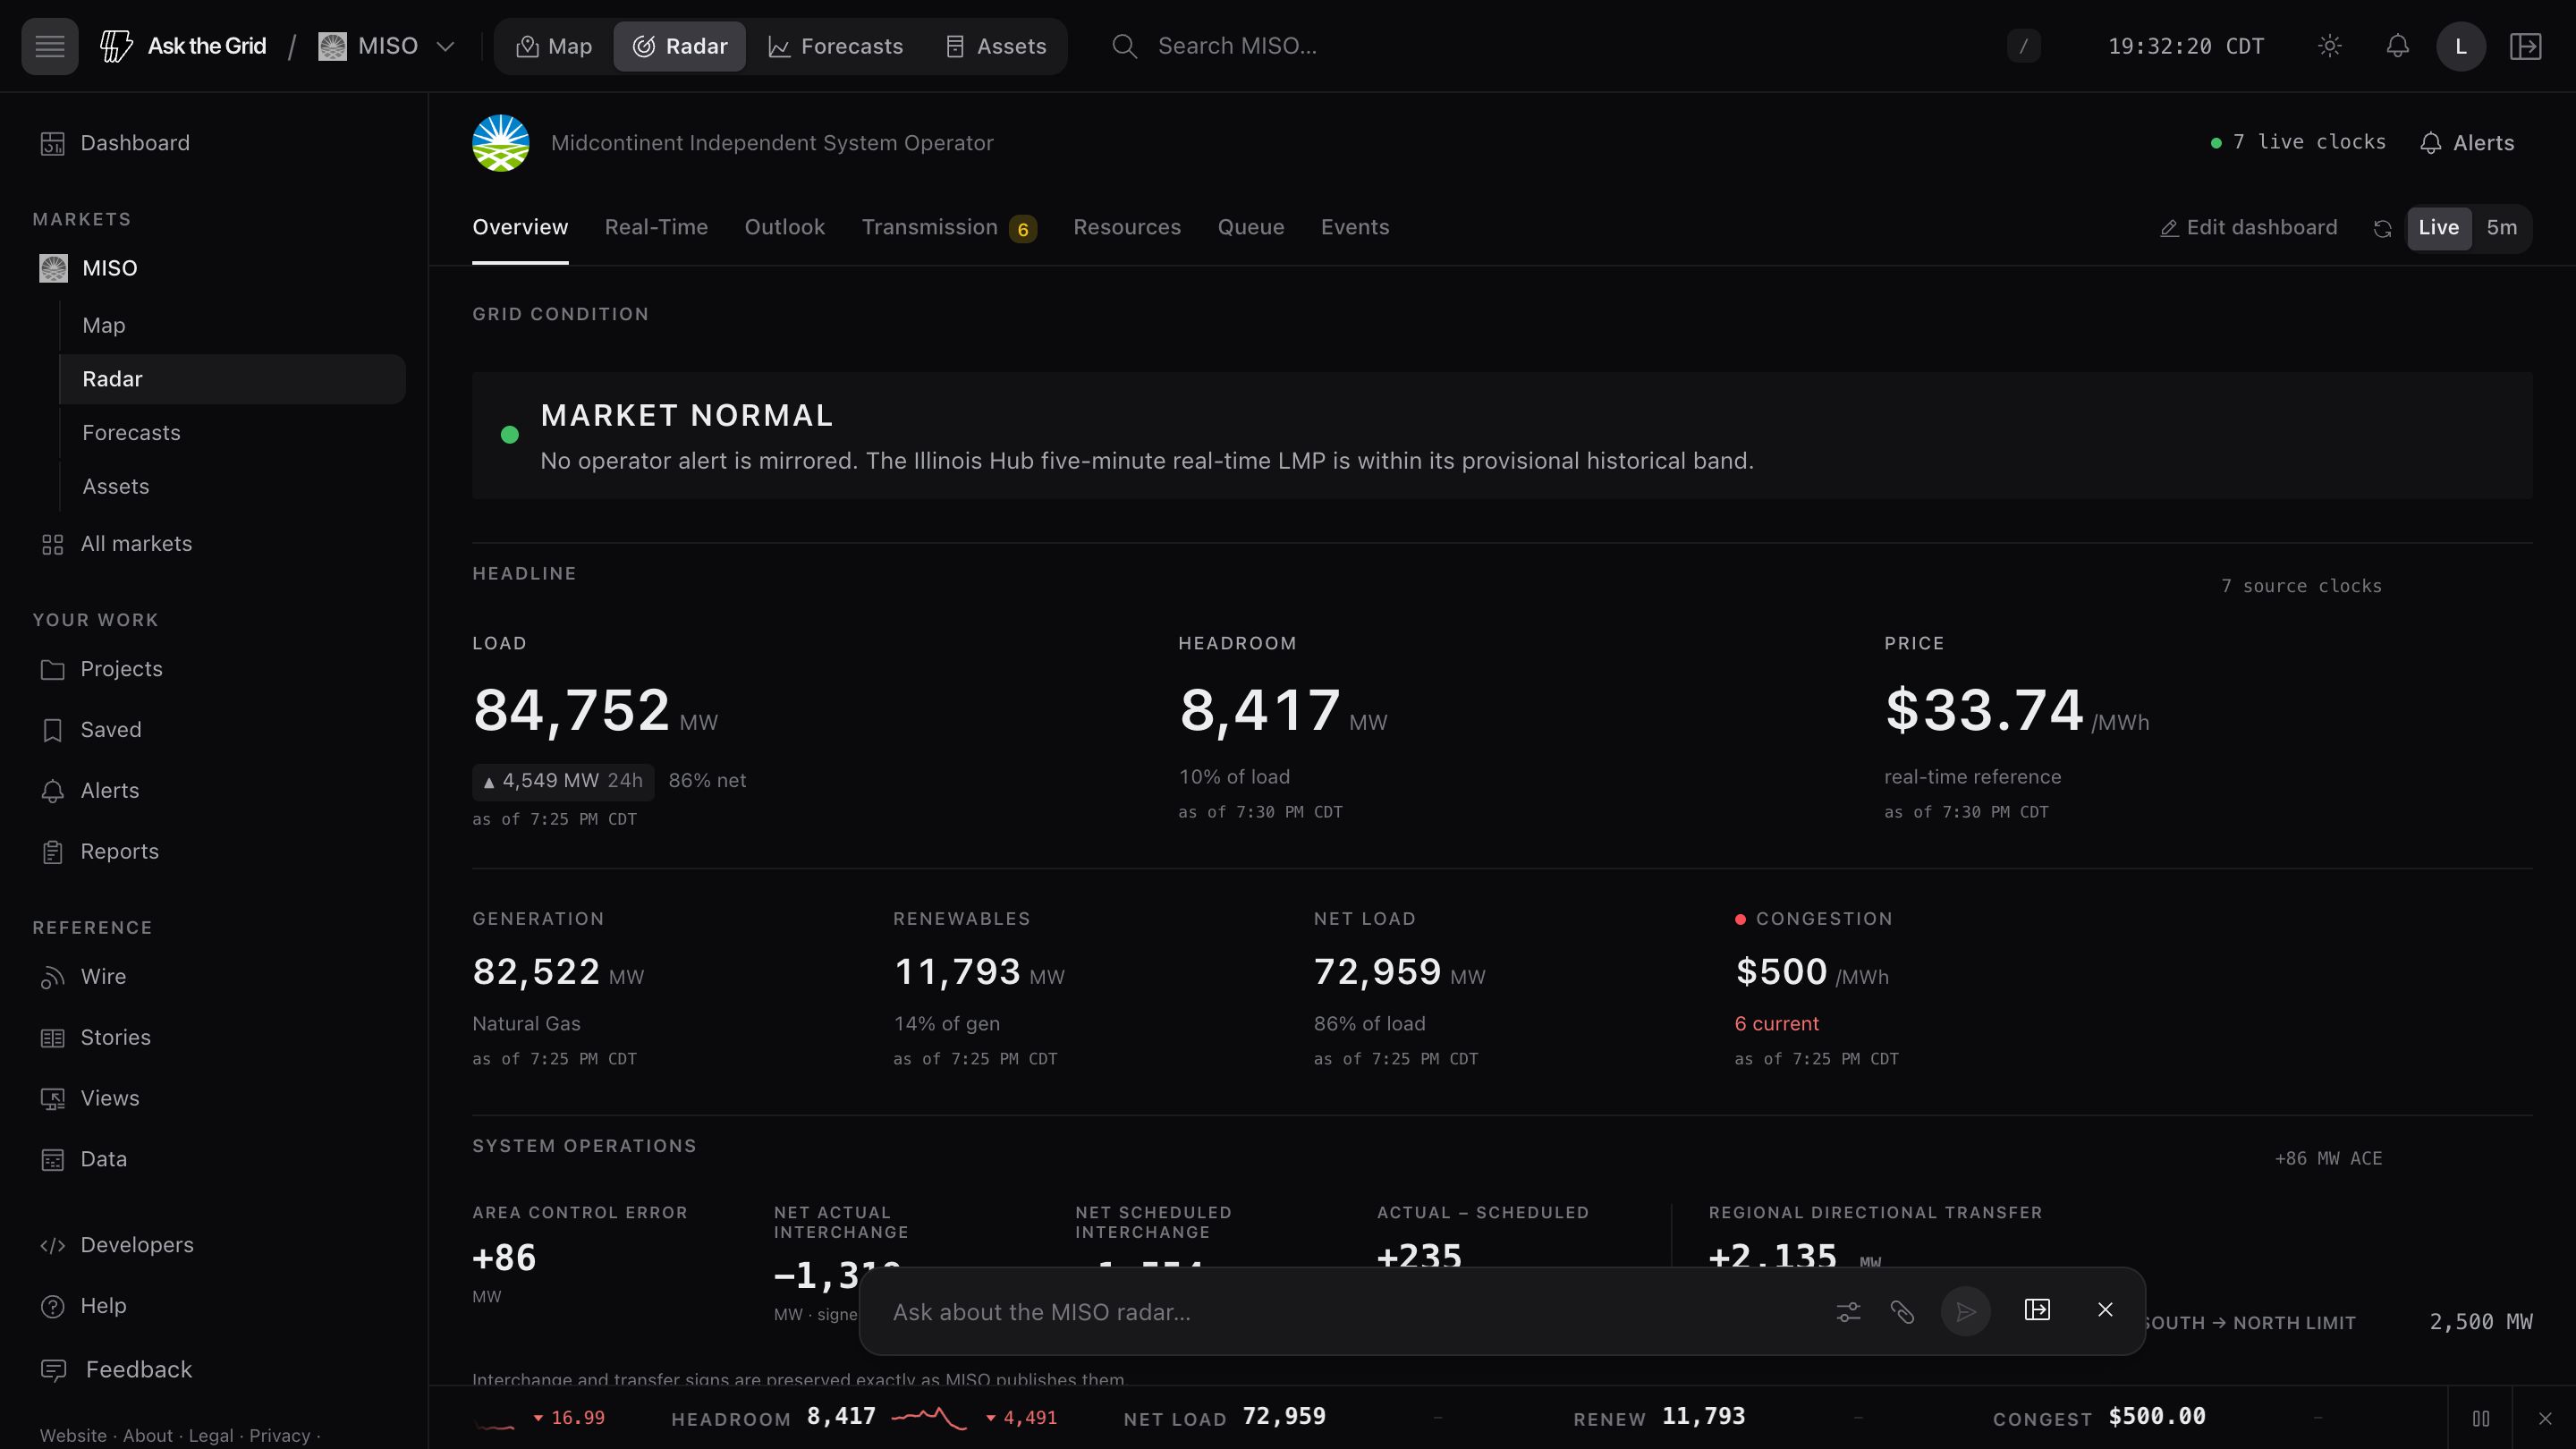
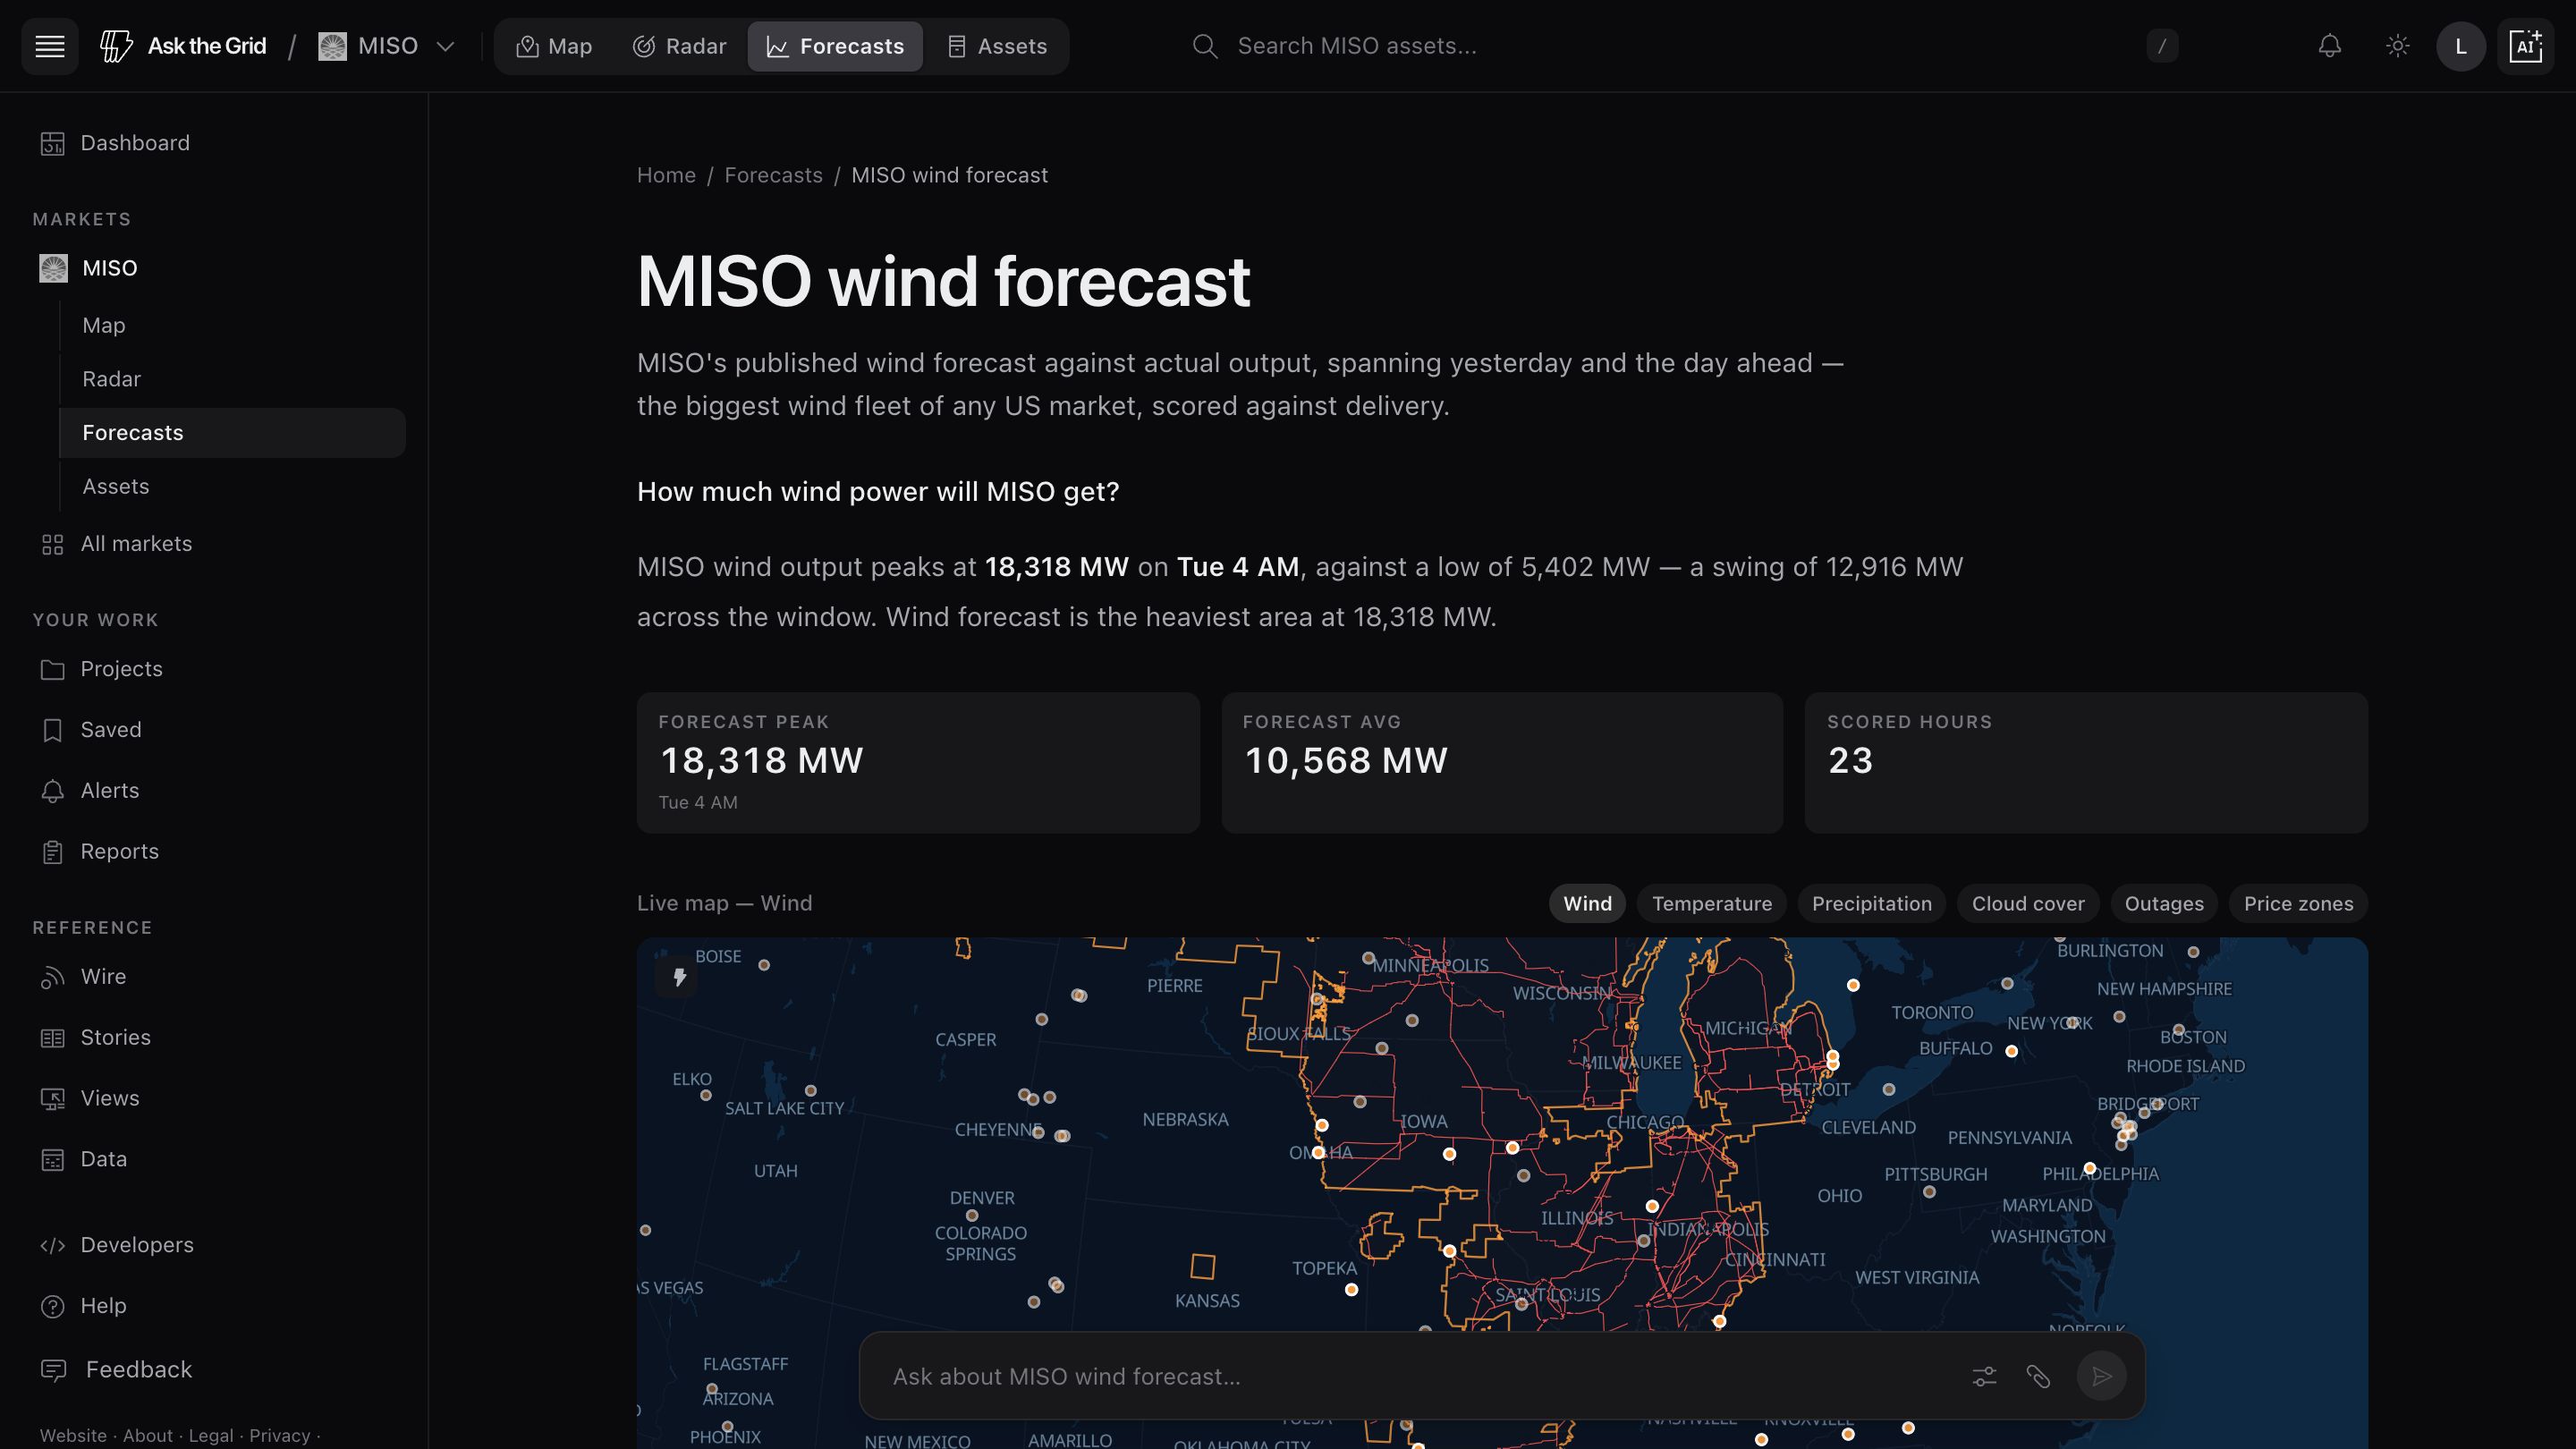
Read MISO prices across regions and reserve zones
MISO's footprint spans Midwest and Southern operating regions. Its real-time price map shows published nodal LMPs, while Indiana Hub provides a separate hub reference. Region, reserve zone and pricing node identify different parts of the market.
Compare prices with published demand, generation by fuel and constraints. Keep the observation times aligned: MISO's market clock uses Eastern Standard Time throughout the year. The fuel-mix total and signed import or storage adjustments retain MISO's own reporting basis.
Open the map to inspect pricing locations, transmission and interconnection requests. Radar and the agent use the same market context so you can continue an investigation without selecting another grid.
Read the market's language
Full glossaryAsk MISO what changed.
Open the live market and begin with a question, a place, or an interval.