Texas's Battery Buildout Split Between Incumbents and Entrants
Texas commissioned 6,002 MW of battery power in 2025. Half came from 17 platforms entering the operating fleet for the first time; half came from incumbents defending scale.
Texas commissioned 6,002 MW of battery power in 2025, divided almost evenly between established portfolios and new entrants. In the frozen project mapping, 3,027 MW came from 17 platforms with no earlier operating Texas battery, while incumbents added 2,975 MW.
The split widened the field even as its largest players expanded. ENGIE added 1,002 MW, ending the year with 2,790 MW in the asset mapping. New platforms were simultaneously completing their first operating projects, creating a market in which growth and competition advanced together.
Read the explorer asset by asset. Each colored segment is a battery site, not an abstract corporate total. Switch from Fleet to Added to see which platforms converted projects in a given year; switch the cohort to New or Incumbent to separate market entry from portfolio expansion. The labels are operating-platform groupings, not a claim about ultimate beneficial ownership or the company scheduling each megawatt in ERCOT.
Incumbents kept the lead, not the market#
On a fixed year-end 2025 platform mapping, the five largest groups account for 47.0 percent of commissioned MW, down from 61.1 percent in the 2024 commissioning-vintage cut. That is not a reconstructed corporate ledger for each historical year; acquisitions make that impossible from a frozen mapping. It is still a useful measure of where the physical fleet sits today: the leaders grew, but 2025 capacity arrived faster outside the top five.
ENGIE shows what incumbent scale looks like. Its 2023 acquisition of Broad Reach Power brought an operating Texas fleet, projects under construction and a development pipeline into one platform. The company then commissioned another gigawatt in 2025. That sequence, buy a portfolio, integrate it, then keep converting the queue, matters more than the static number at the top of a leaderboard. Scale only remains an advantage if the next projects reach commercial operation.
Entrants supplied the other half#
The first-time cohort had been shrinking as a share of annual additions from 2021 through 2024. In 2025 it came back to 50.4 percent. "First-time" does not mean newly formed. It means a platform had no earlier commissioned Texas battery in this project mapping. The cohort includes global energy companies, specialist storage developers and infrastructure-backed platforms moving from development into operations.
| Operating platform | MW added | MWh | Sites |
|---|---|---|---|
| esVolta | 500 | 980 | 3 |
| TotalEnergies | 455 | 694 | 3 |
| Intersect Power | 321 | 640 | 2 |
| SER Capital Partners | 314 | 680 | 2 |
| Brookfield Renewable | 280 | 280 | 3 |
| Gridstor | 220 | 440 | 1 |
| Eni New Energy | 205 | 400 | 1 |
| Tokyo Gas America | 174 | 348 | 1 |
| Nightpeak Energy | 150 | 300 | 1 |
| Apex Clean Energy | 103 | 200 | 1 |
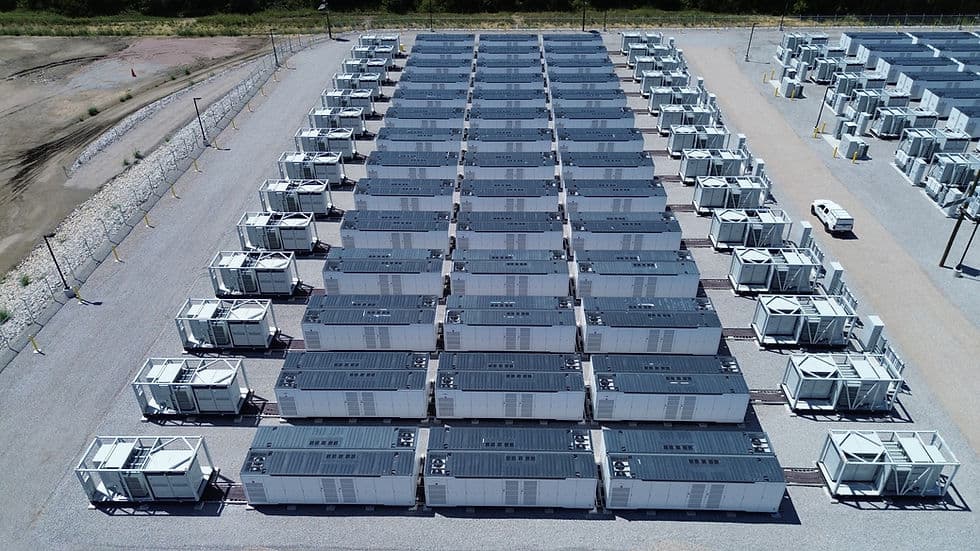
Those are operating assets, not queue announcements. The entrant cohort proved that interconnection, procurement, financing and construction were penetrable at scale. The next test is harder: whether those portfolios can earn through a market where ancillary-service saturation, nodal congestion and thousands of additional battery megawatts are compressing the value of simply being online.
2026 is now a conversion test#
Ask the Grid's April 2026 EIA battery inventory already contains 30 ERCOT projects with a 2026 operating month, totaling 2,207.5 MW. Platinum Storage is the largest at 348 MW, followed by Old 300 Storage Center at 250 MW and Bypass BESS at 200 MW. These are filing-level assets; their reporting entities are not automatically the beneficial parent or the desk operating them in the market.
Another 3,160.1 MW sat in 18 active battery projects with positive capacity and proposed 2026 completion dates in Ask the Grid's deduplicated July 1 ERCOT interconnection queue. Betel Storage I and II account for 1,000 MW by themselves. Several rows still carried dates that had already passed, which is why the queue is a schedule of intent, not a delivery forecast.
The public planning cases bracket the year rather than predict it. ERCOT's December 2025 Capacity, Demand and Reserves report counted 5,074 MW of battery additions that had cleared its milestone screen for summer 2026. EIA's December developer survey carried 12.9 GW of planned 2026 additions across all of Texas. The first is a screened ERCOT set; the second is a statewide developer schedule. Ask the Grid's tracked case, reported operating capacity plus the active queue subset, sits between them at 5,367.6 MW.
For incumbents, 2026 is a share-defense year: another large fleet expansion is required just to keep pace with the denominator. For entrants, it is a conversion year: a proposed commercial date has no strategic value until the site reaches operations. For both, the useful forecast is project-level, node by node and month by month, not one statewide gigawatt number.
Capacity is not an operating edge#
The corporate platform is only one layer of a Texas battery. A legal project company may hold the asset. ERCOT's Resource Entity is the registered party that owns and/or controls it. The Qualified Scheduling Entity, or QSE, submits bids and schedules the battery. The optimizer may be an internal trading desk, a third party or a counterparty under a toll. One organization can fill several roles, or each role can sit with a different firm.
That distinction changes how to read the cohort charts. They show who accumulated commissioned steel, not who operated it best. Ask the Grid's separate ERCOT battery revenue leaderboard reconstructs site-level market yield and shows third-party scheduling desks beside owner-operators. A large fleet can improve procurement, financing and augmentation economics. It cannot rescue a weak node or a trading strategy that misses the hours when scarcity pays.
What each cohort has to decide#
Incumbents have to decide where portfolio scale is actually worth defending. The next marginal project should add more than nameplate MW: it should improve nodal diversity, duration, interconnection timing or the desk's ability to manage a fleet across different price regimes. ENGIE's lead is useful because it creates options, not because first place carries a premium by itself.
Entrants have to decide whether to build an operating capability or buy one. A first battery creates a 24-hour obligation: bid strategy, telemetry, outages, state of charge, degradation and real-time exposure. The choice among an internal desk, software, a third-party optimizer or a toll can matter more to the first years of revenue than the corporate label attached to the project.
QSEs and optimizers should read the 17 first-time platforms as a distribution map. Each new operating portfolio is a potential mandate, but not every mandate is equal. The valuable ones pair multiple assets, differentiated nodes and owners willing to expose enough operational control for the market desk to create an edge.
How we built the cohorts#
The historical cohort mapping uses the downloadable project rows behind Modo Energy's Texas owner visualization, which cites ERCOT. Sites are grouped by the platform label and commercial-operation date in that file and frozen at year-end 2025. The mapping contains 213 project rows, 51 platform labels, 13,888.1 MW and 22,853.0 MWh. Those rows produce the 17 first-time platforms, 3,027 MW and 50.4 percent used throughout the charts.
Fleet totals vary with the unit being counted. December 2025 EIA-860M records 13,779.4 MW across 200 operational battery generator records under balancing-authority code ERCO. ERCOT's December Capacity Changes workbook reports 16,645.9 MW of cumulative operational battery capacity. The cohort analysis uses the separate project mapping above, retaining its project boundaries, platform labels and status definitions.
Each project is assigned wholly to its source platform label, which may identify a brand, developer, sponsor or asset manager. The analysis follows that frozen mapping consistently across years rather than weighting capacity by equity interests. For example, it retains the National Grid Renewables label for 414 MW even though the business had become Geronimo Power after the May 2025 Brookfield-led acquisition.
The market that emerges is not one leaderboard. Incumbents still control the largest portfolios, but first-time platforms supplied half of 2025 additions and pushed the top five below half of mapped capacity. With another multigigawatt build year underway, the competitive edge moves from accumulating steel to choosing the right assets, reaching operation on time and putting each megawatt in the hands of the right market operator.