PJM's Higher Power Prices Raise the Stakes of Governance Reform
Ahead of FERC's July 23 conference, day-ahead prices had passed the gas-crisis benchmark, expensive hours were becoming more frequent and the eastern zones faced the largest increases.
July 2026 analysis. Reporting and market data are frozen at July 25, 2026. The governance timetable below reflects the commitments made at the July 23 conference.
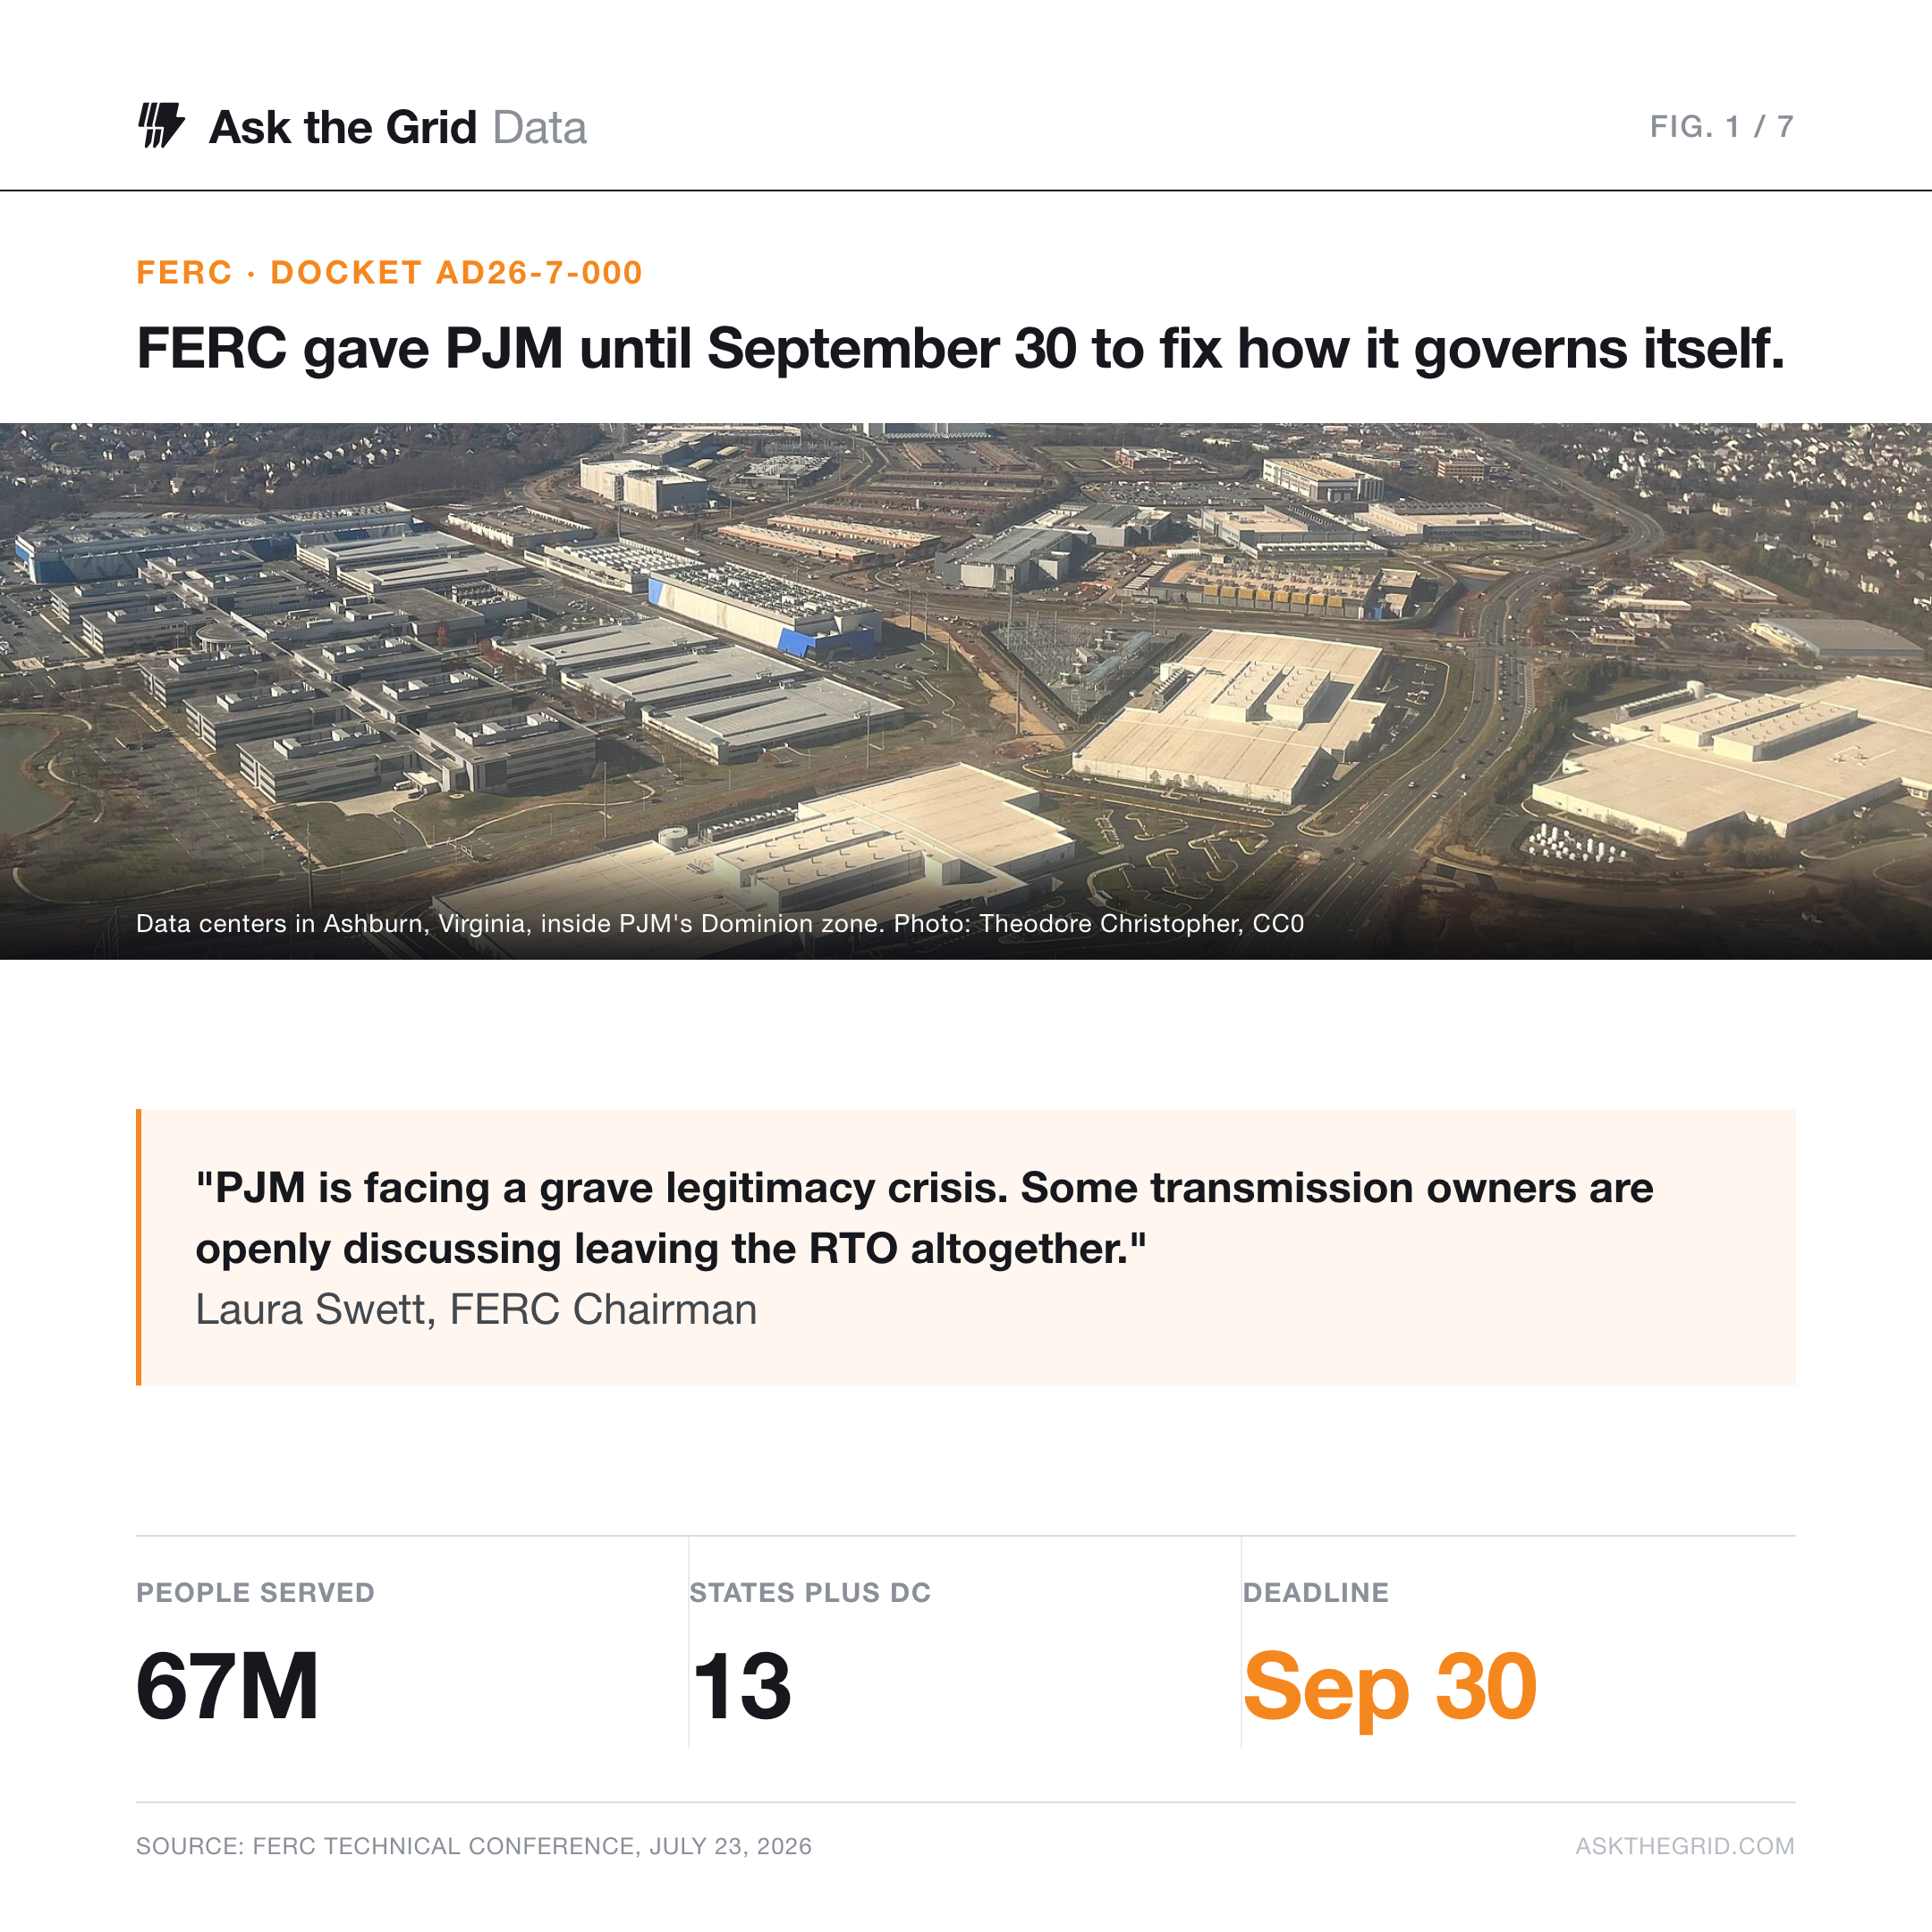
PJM's day-ahead electricity price averaged $72.26/MWh from January 1 through July 20, 2026, above the same period in the 2022 gas crisis and more than double its 2024 level. That rise formed the market backdrop to FERC's July 23 conference on who makes decisions for the grid serving 67 million people across 13 states and the District of Columbia.
The conference brought utilities, state regulators and market participants into a debate over board authority, voting rights and accountability. FERC Chairman Laura Swett called PJM's position a “grave legitimacy crisis” and said some transmission owners were discussing leaving the regional operator.
The stakes extend from the market's daily operating costs to the rules for procuring future capacity. Ask the Grid's analysis shows more frequent high-price hours, a widening geographic divide and elevated forced outages. Those conditions explain the urgency of the debate, while the proposals address how PJM reaches decisions about them.
Power prices rose while the gas benchmark fell#
Comparing the same January 1–July 20 window in each year, the PJM-wide reference price was $66.78/MWh in 2022 and $32.24/MWh in 2024. The 2026 average exceeds both, despite a substantially lower national gas benchmark than in the crisis year.
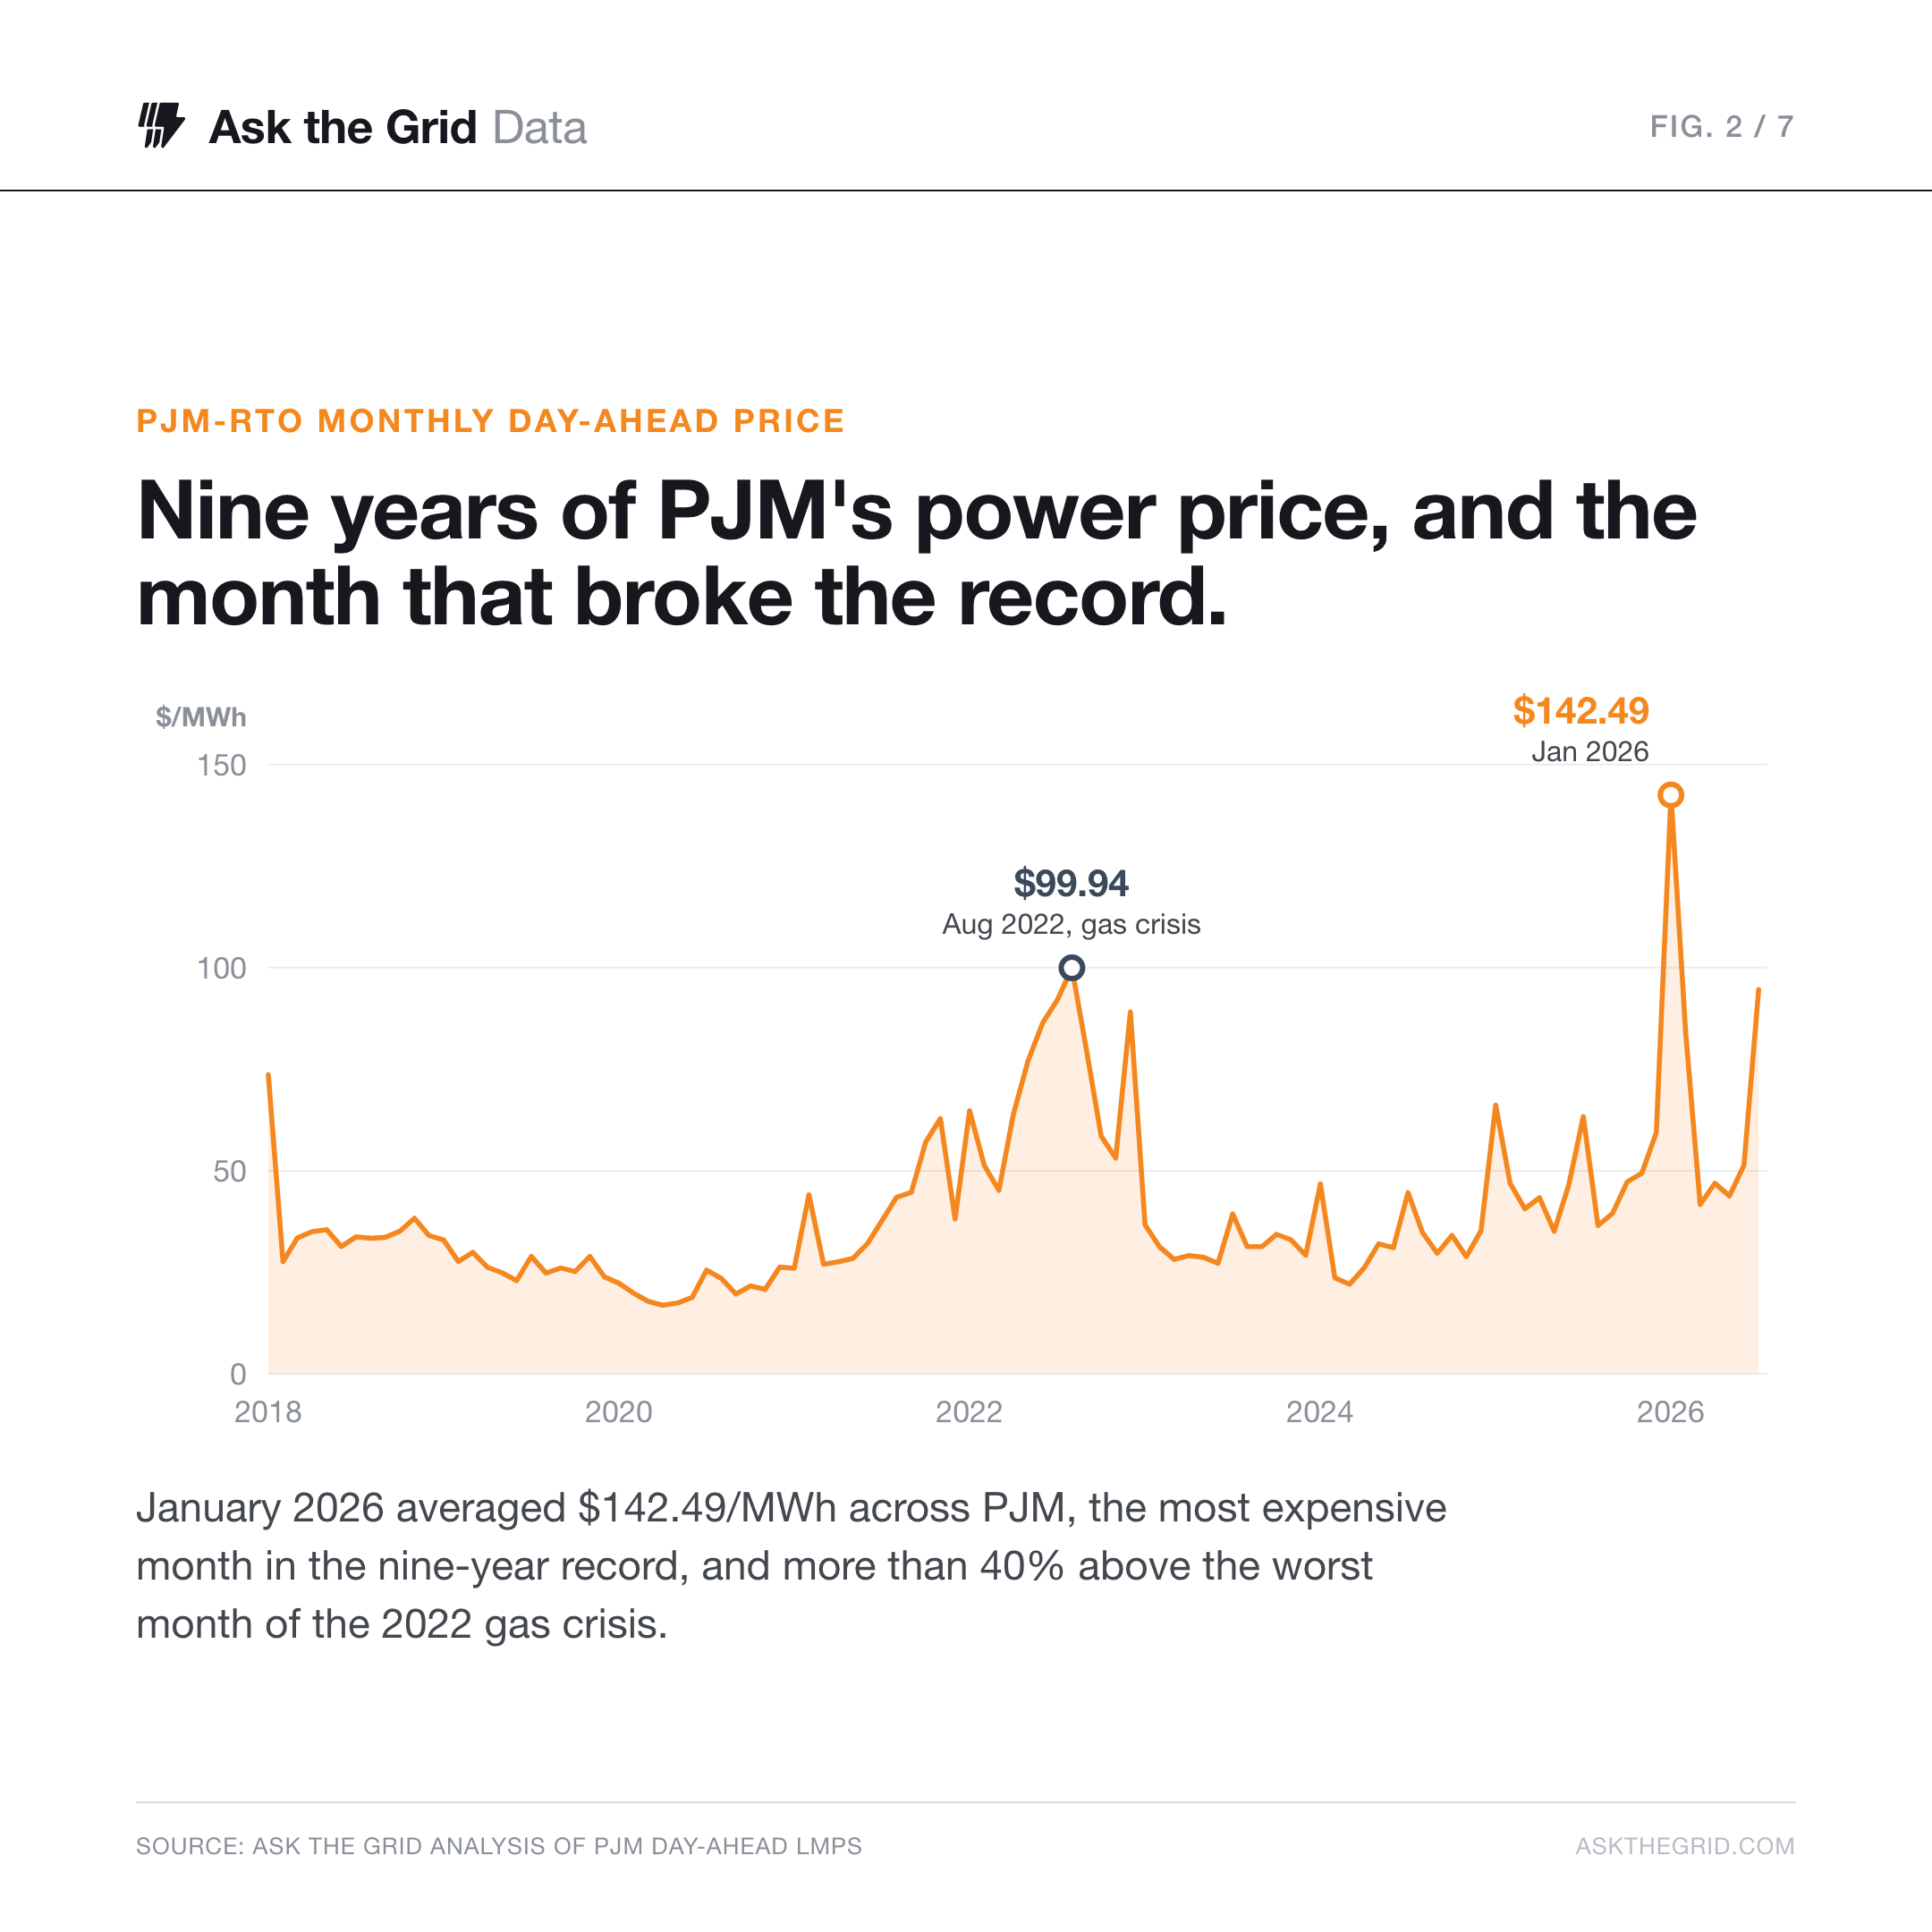
January carried much of the increase. Its PJM-wide day-ahead average reached $142.49/MWh, the highest monthly value in the January 2018–July 2026 price record and more than 40 percent above the highest month of 2022. The concentration in winter matters for a region whose planning debate often centers on summer demand.
Gas prices provide a useful comparison because fuel costs feed into the offers of gas-fired generators. Henry Hub averaged $6.13/MMBtu during the aligned 2022 window, compared with $3.73/MMBtu in 2026, a decline of 39 percent. Power prices moved in the opposite direction.
Dividing the reference electricity price by Henry Hub produces an implied market heat rate. The ratio expresses the relationship between power and the national gas benchmark; changes reflect the combined effects of the marginal generation mix, delivered fuel costs, other operating costs and market conditions.
The ratio was 9.57 in 2021, 10.89 in 2022 and 19.39 in 2026. The widening relationship shows that the increase in electricity prices has outpaced Henry Hub. Regional gas prices can separate from that national benchmark, especially in winter, so the ratio is a market comparison rather than an allocation of the increase to any one cause.
High-price hours became more frequent#
High-price hours make the change more concrete. They expose buyers and sellers to concentrated periods of cost that a yearly average spreads across thousands of hours.
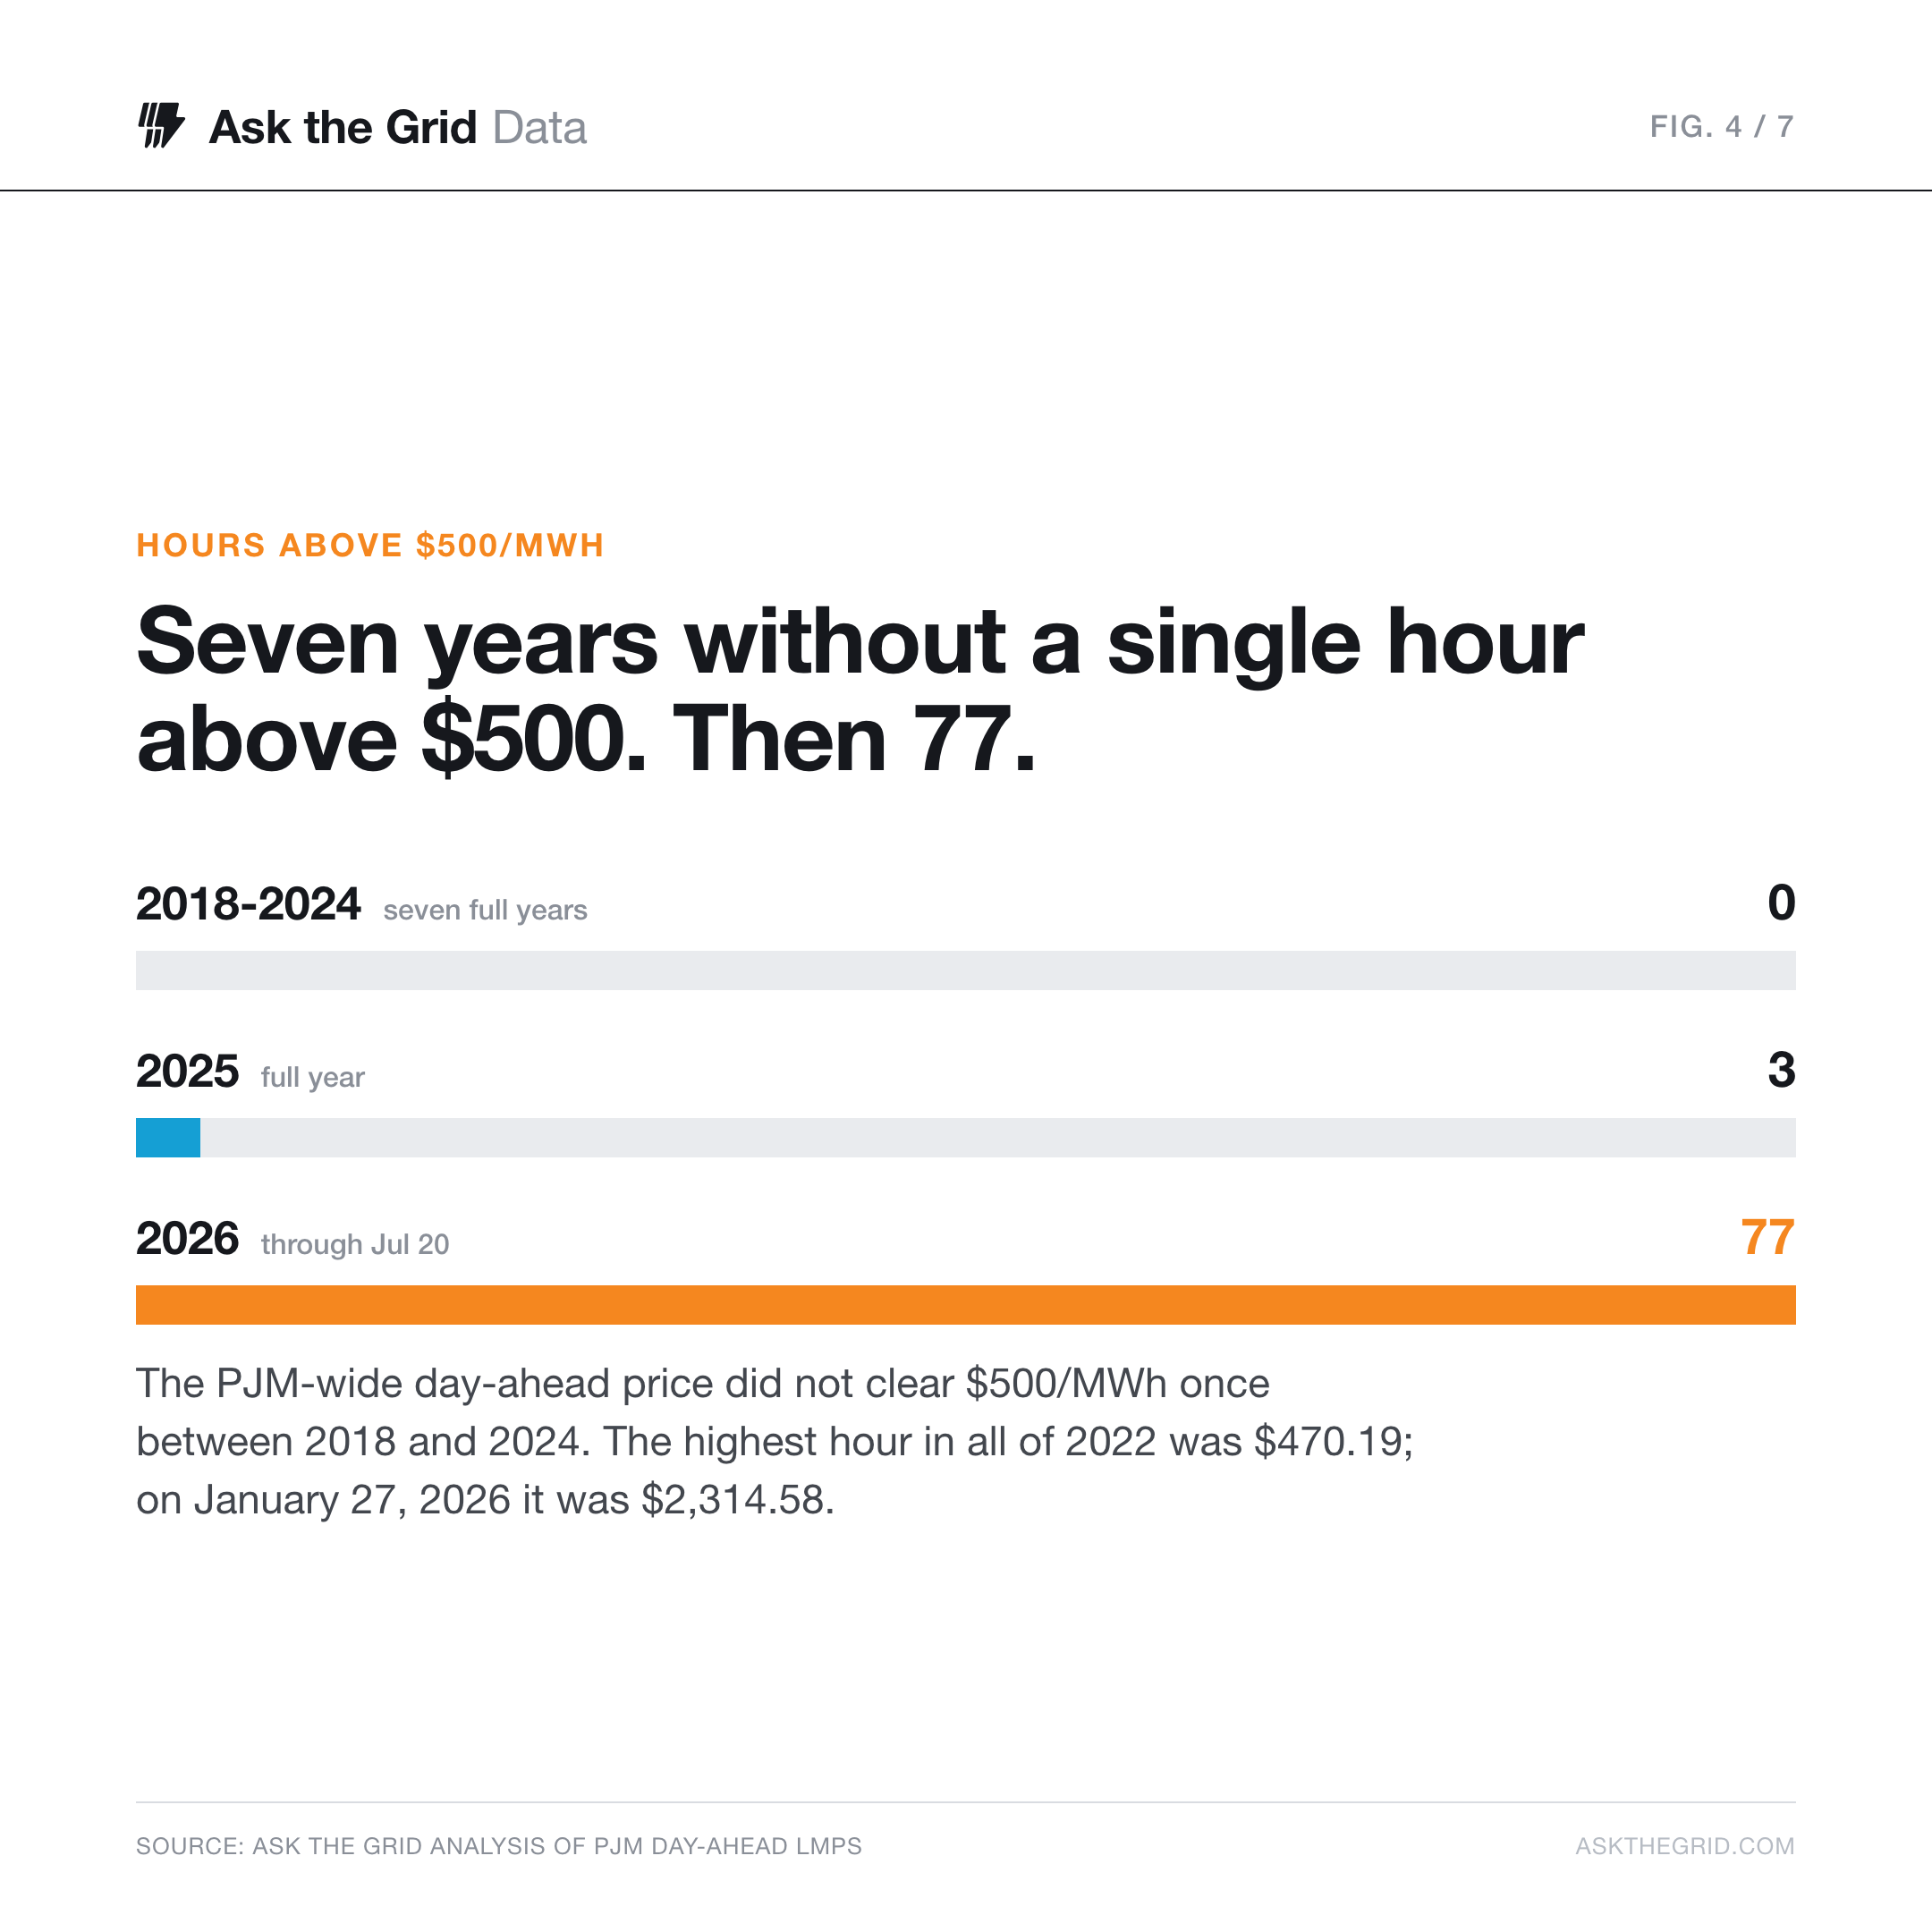
From 2018 through 2024, the PJM-wide day-ahead reference never cleared $500/MWh; the highest hour in 2022 was $470.19/MWh. It crossed $500 three times in 2025 and 77 times by July 20, 2026.
The lower $250/MWh threshold shows a similar shift: 50 hours in all of 2022, compared with 280 in the 2026 window. These are price thresholds applied consistently to the reference series, capturing the growing frequency of expensive hours.
Winter carried the largest price event#
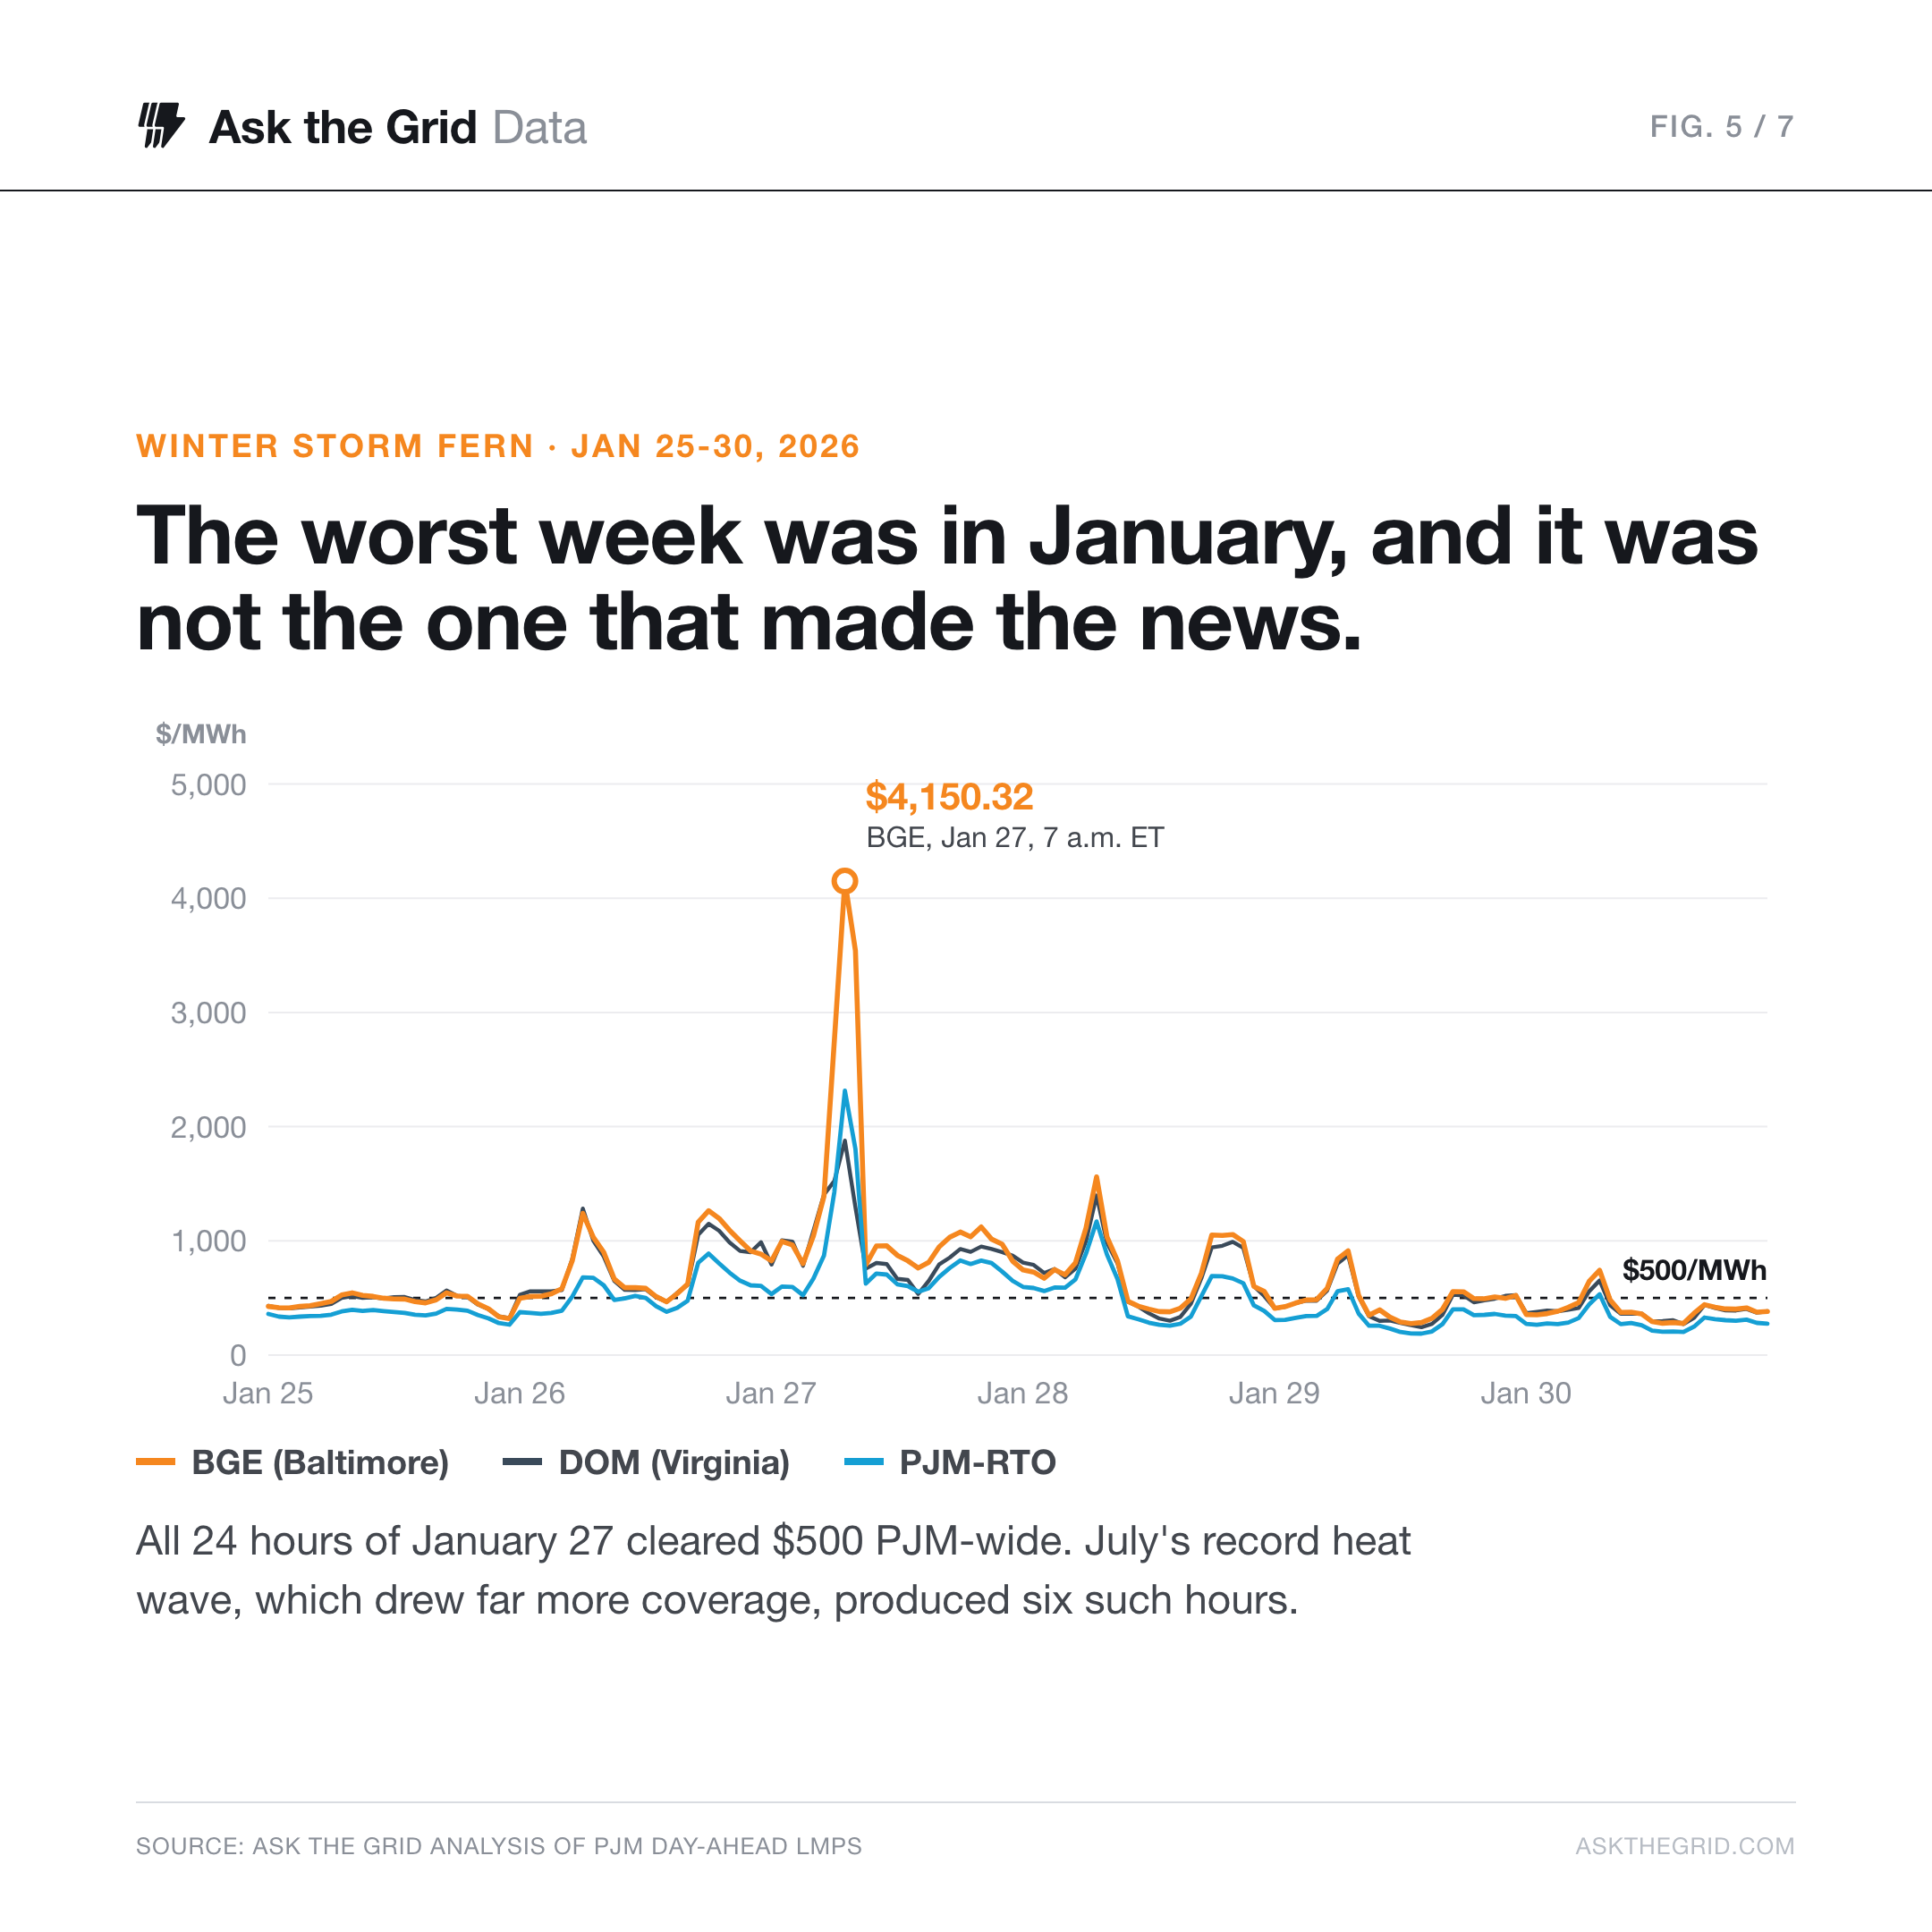
The July 2 heat emergency produced six hours above $500/MWh. Winter Storm Fern had produced 24 on January 27, when every hour cleared above that threshold.
At 7 a.m. Eastern on January 27, the BGE zone around Baltimore cleared $4,150.32/MWh, while the PJM-wide reference reached $2,314.58/MWh, its highest day-ahead hour in the nine-year record. PJM had projected a winter peak near 147 GW and applied to DOE for emergency authority on January 24, placing the winter price event alongside an operator request for additional flexibility.
The cost increase was concentrated in the east#
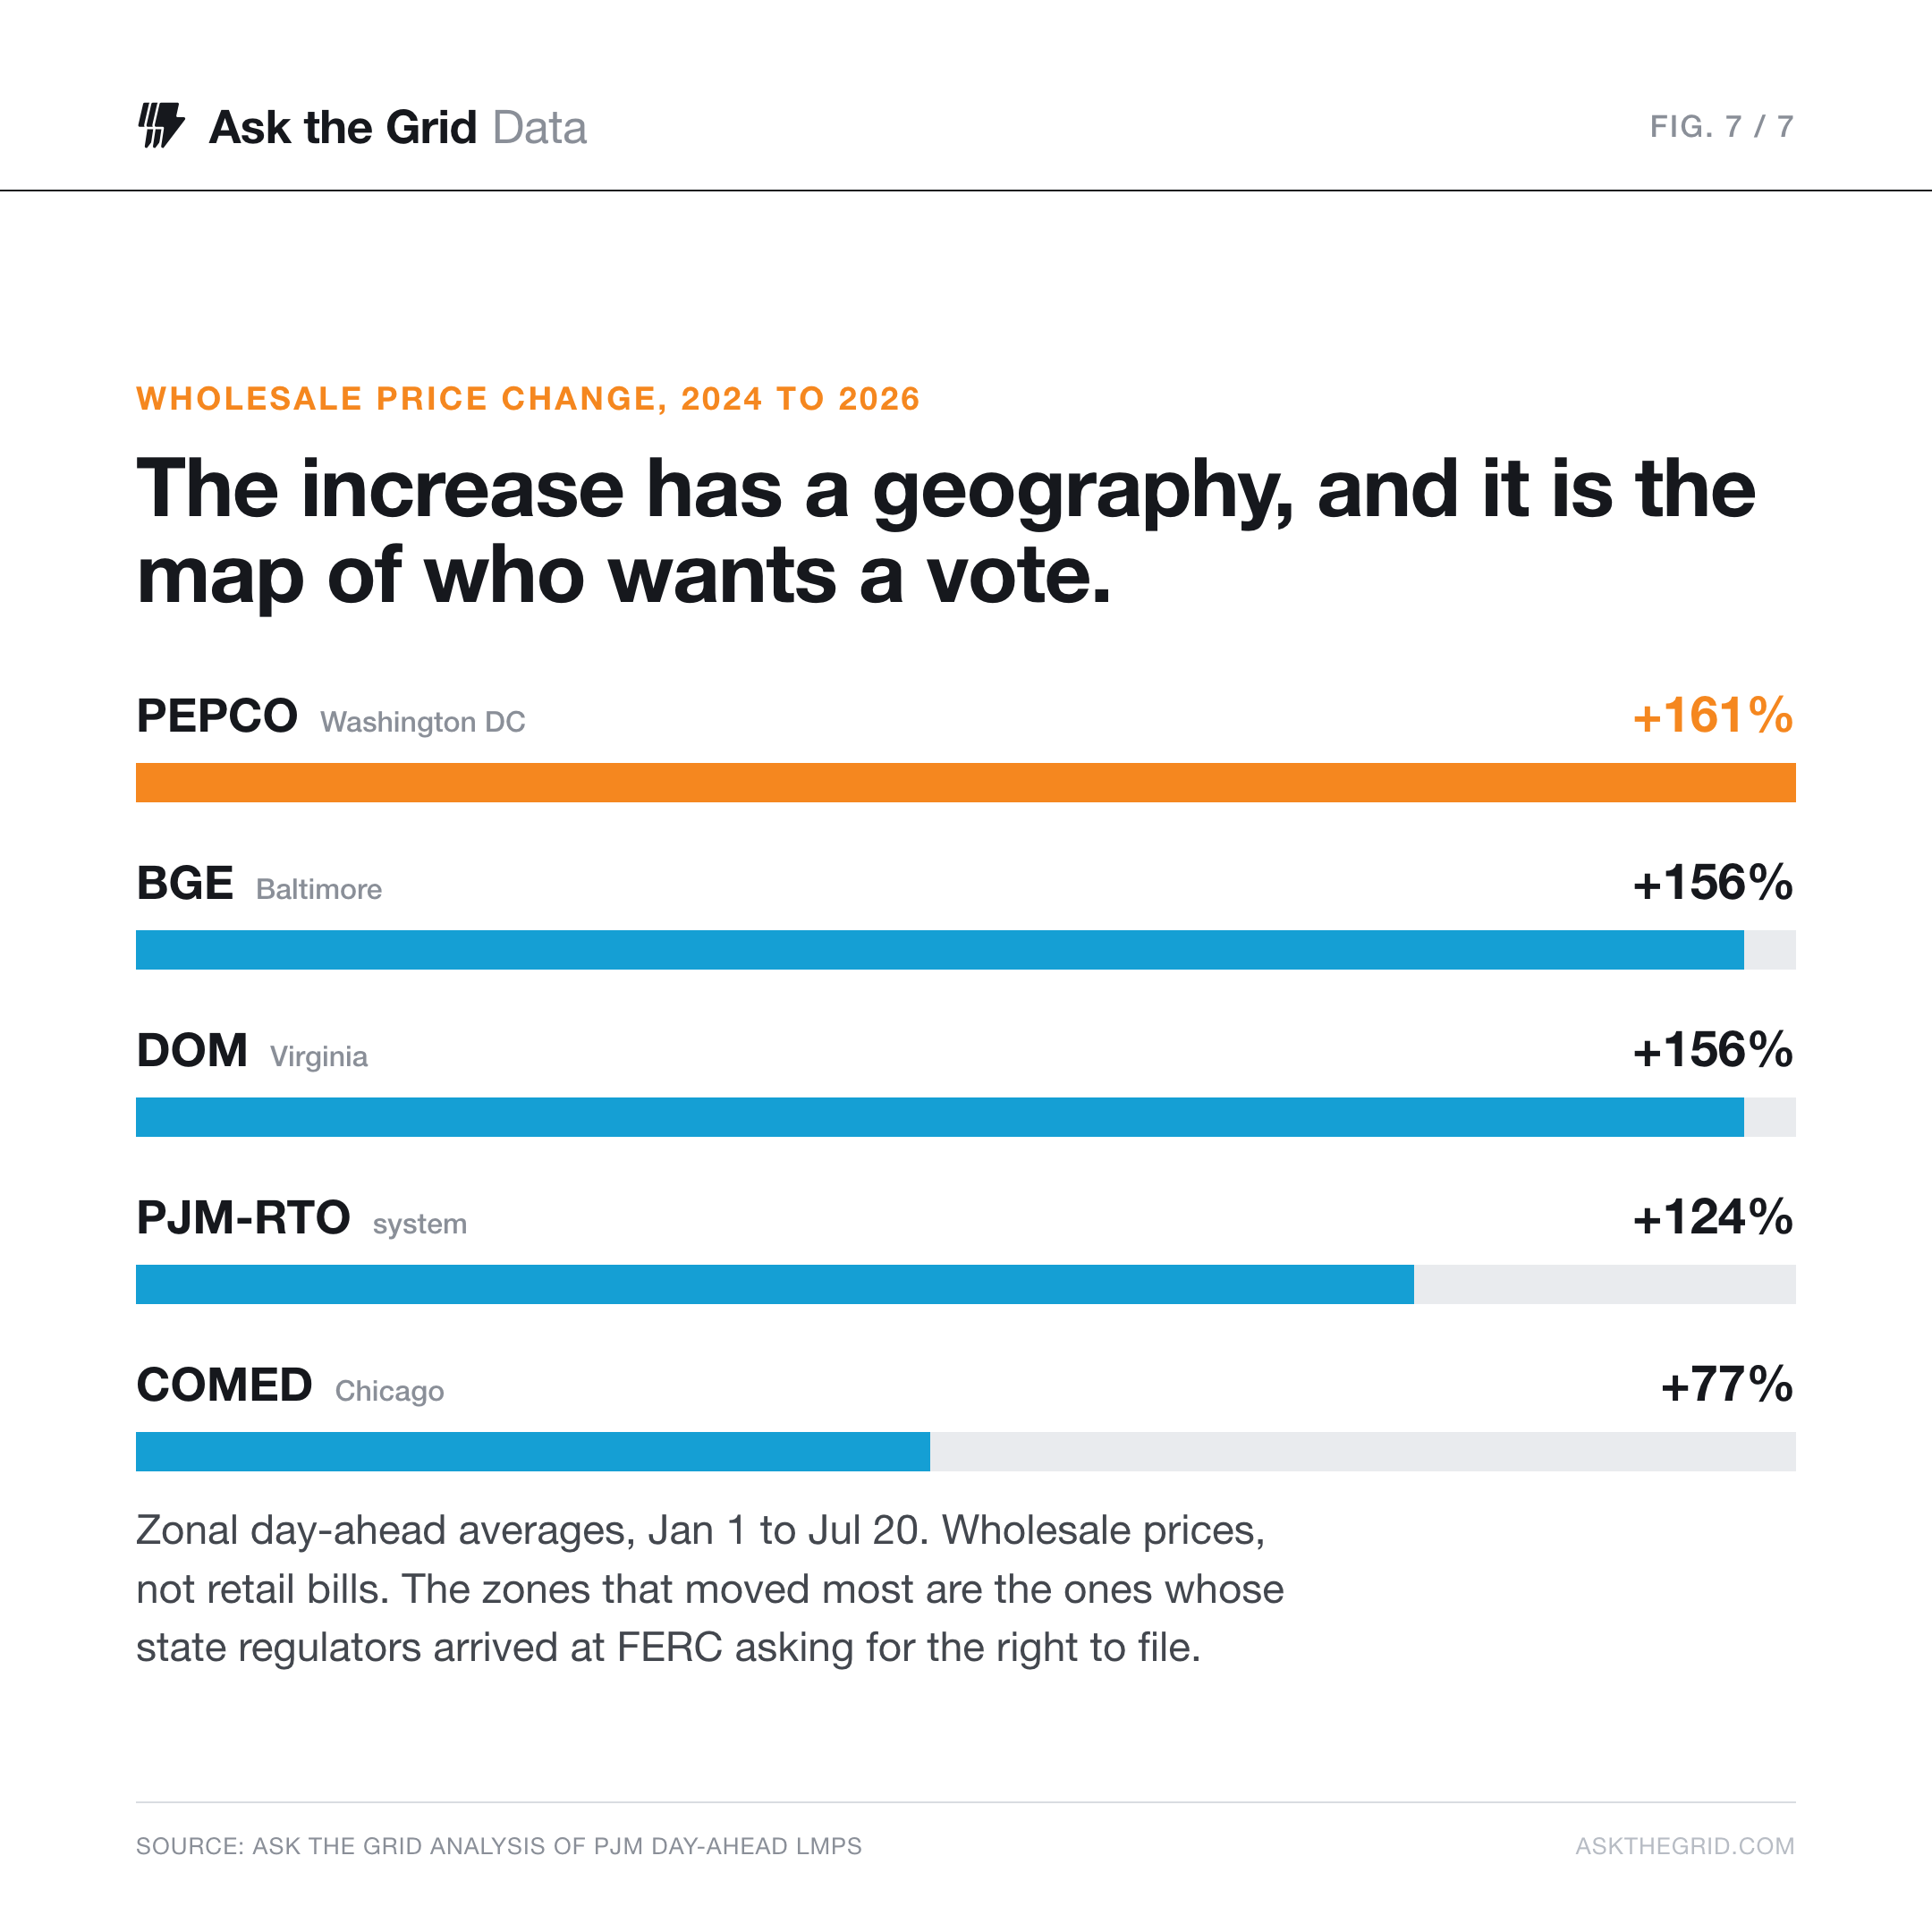
The cost increase also has a geography. Wholesale prices in Baltimore, Washington and Northern Virginia rose faster than those around Chicago, creating different exposures within the same regional market.
| Zone | 2024 average | 2026 average | Change |
|---|---|---|---|
| BGE (Baltimore) | $39.43 | $101.05 | +156% |
| PEPCO (Washington DC) | $37.64 | $98.30 | +161% |
| DOM (Dominion, Virginia) | $36.89 | $94.49 | +156% |
| APS (Allegheny) | $31.75 | $76.71 | +142% |
| PJM-RTO (system reference) | $32.24 | $72.26 | +124% |
| PSEG (New Jersey) | $27.52 | $61.41 | +123% |
| AEP (Ohio, West Virginia) | $30.36 | $61.78 | +103% |
| COMED (Chicago) | $25.00 | $44.24 | +77% |
The BGE, PEPCO and Dominion zones reached roughly two and a half times their 2024 price in the aligned window. ComEd rose 77 percent. BGE's price was about 1.6 times ComEd's in 2024 and 2.3 times in 2026, widening the regional spread.
The eastern corridor is also where PJM forecasts much of its data-center growth and where July's emergency actions were targeted. State regulators seeking a greater role in regional decisions therefore arrived with both an operating concern and a cost concern for their customers.
Wholesale costs reach retail customers through utility procurement, hedging and state regulation. The zone comparison locates the market exposure; capacity-auction costs create a further route to bills. Increases exceeding 20 percent for some utilities' customers helped bring governors into the governance debate.
More generation was unexpectedly unavailable#
Generation availability adds pressure alongside demand growth. A forced outage removes a plant unexpectedly, reducing the resources available to serve the load that remains.
Forced outages averaged 9,328 MW across June and July 2026 in the publication snapshot, the highest summer figure in the twelve-year series and more than double the 4,431 MW recorded in summer 2020. The trend puts the condition and availability of the existing fleet alongside the debate over building new capacity.
A sudden load transfer added another operating challenge#
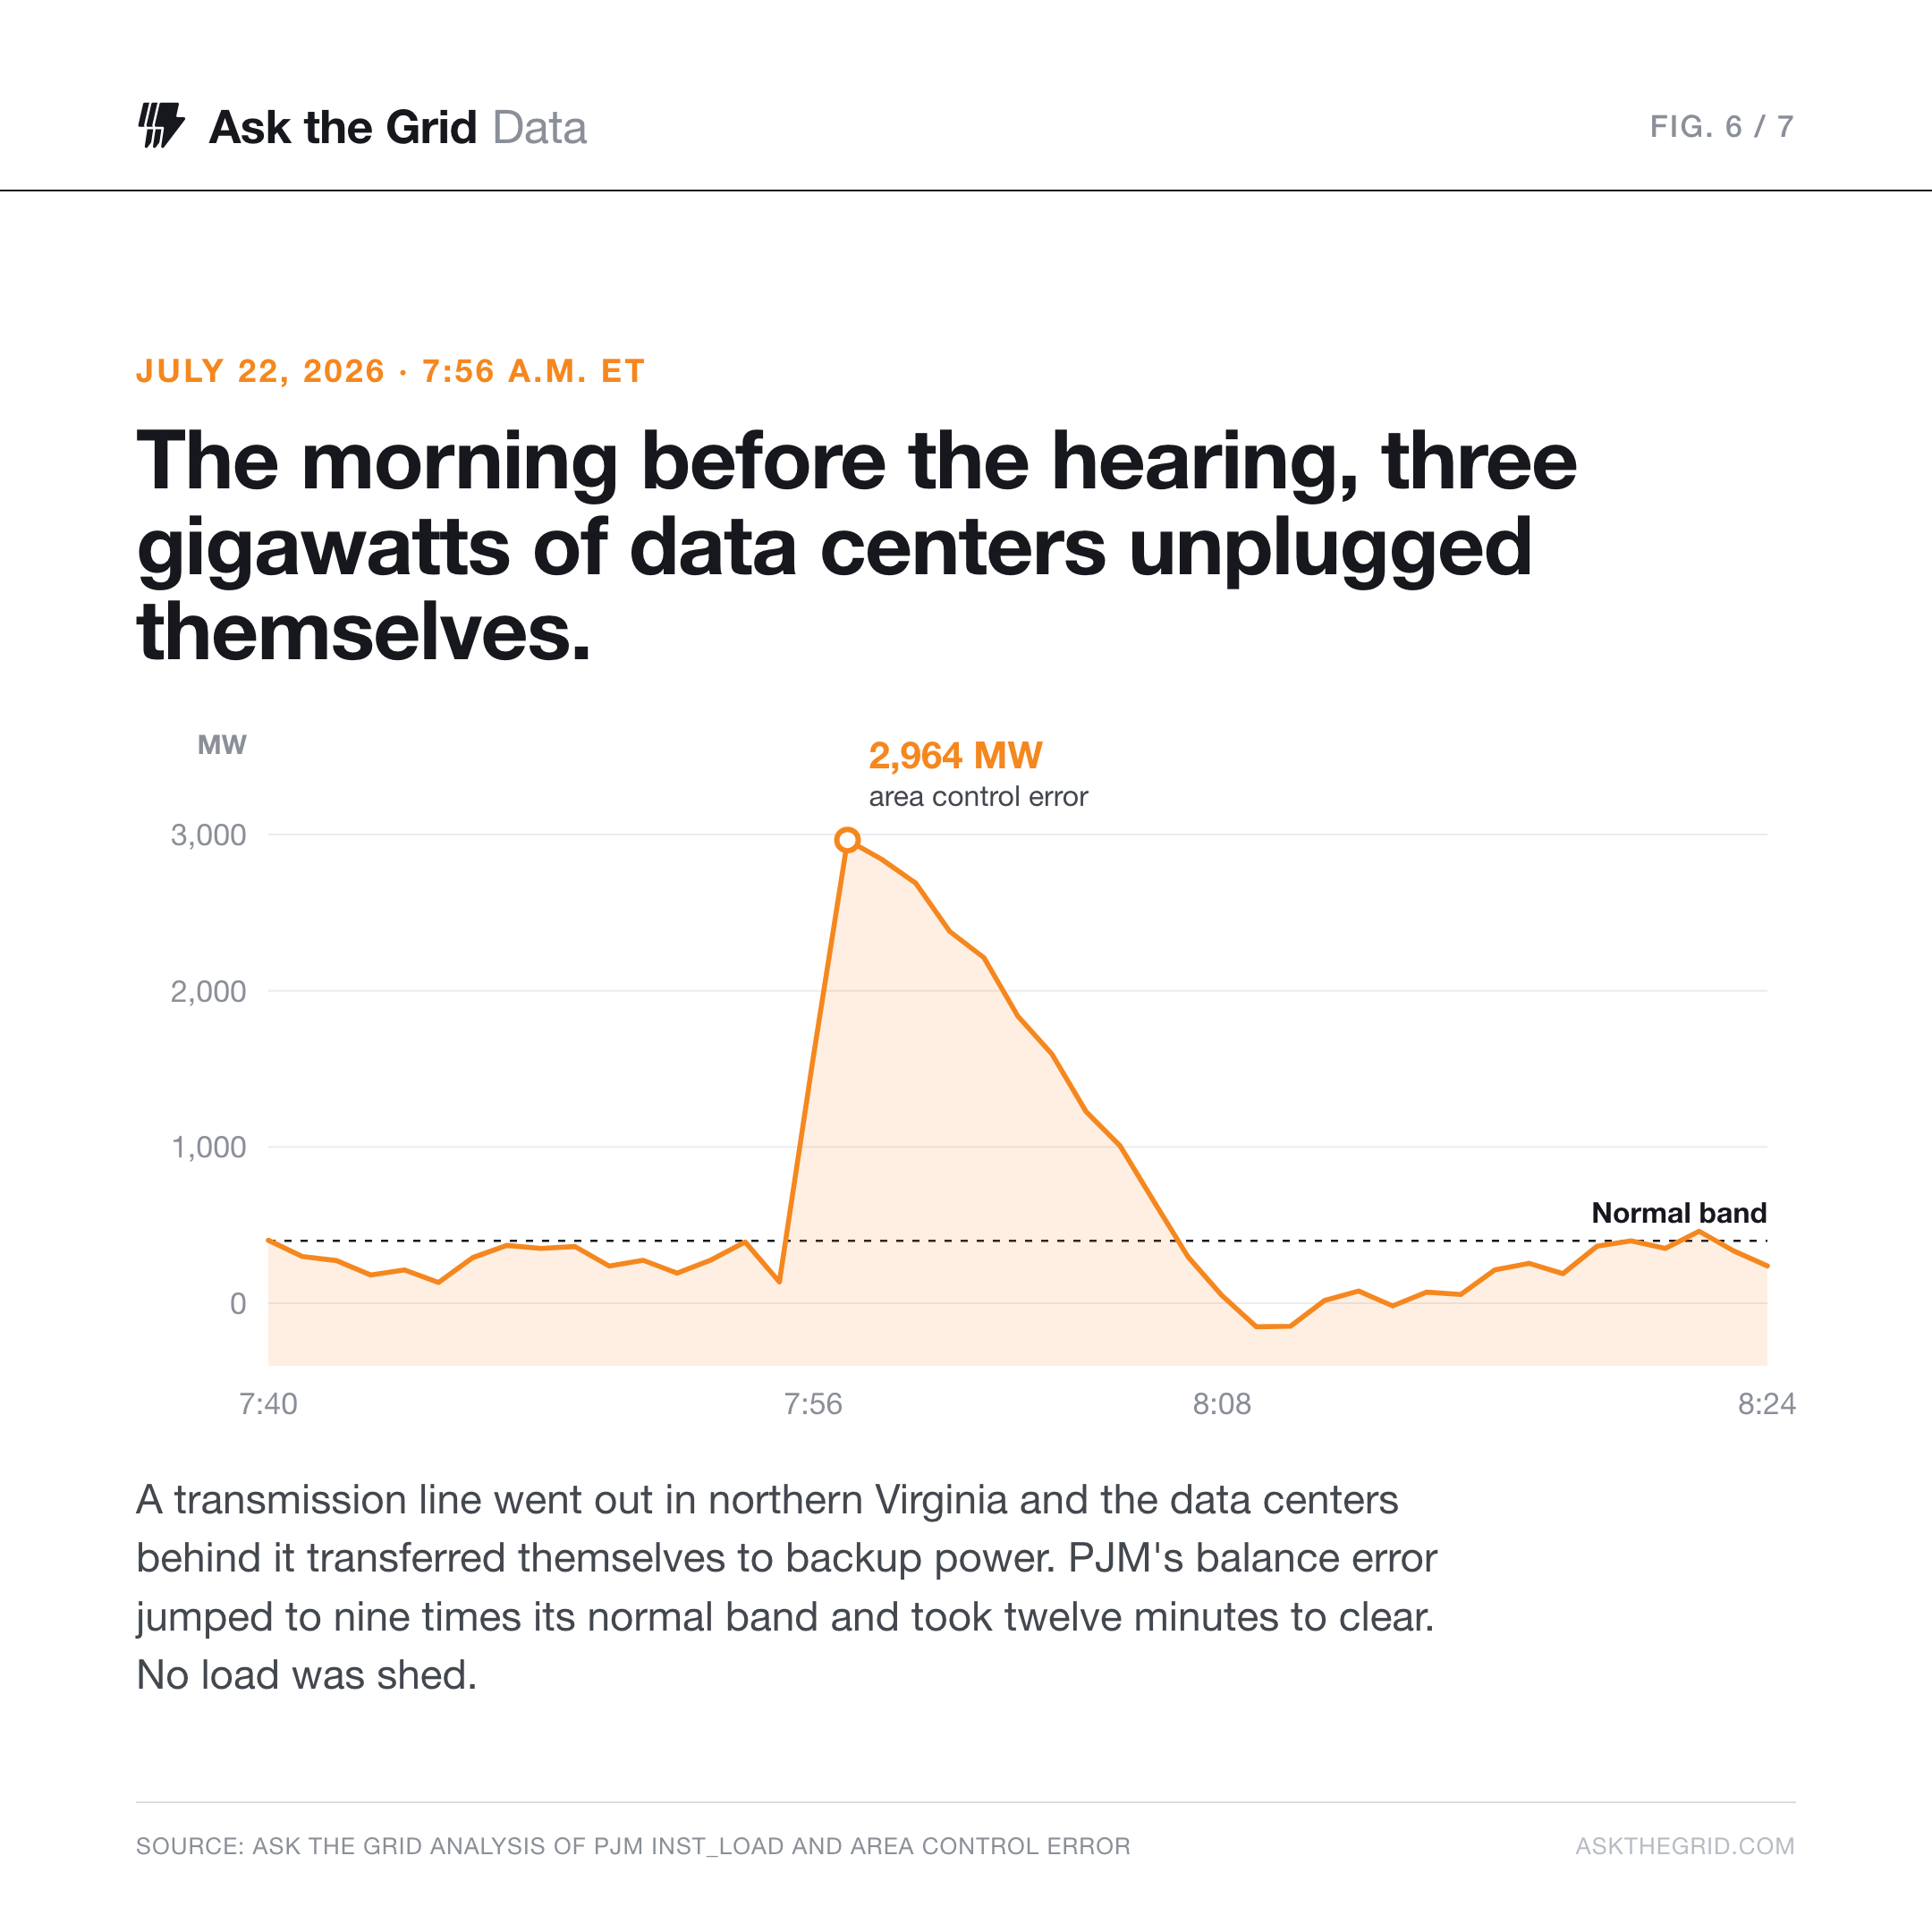
A separate event on the morning before the conference showed how quickly large loads can change the operator's task. At about 7:56 a.m. Eastern on July 22, a Northern Virginia transmission line went out of service and data centers transferred to on-site backup generation, according to Dominion's account reported by Reuters.
The transfer removed more than 3 GW of demand in seconds. PJM said reliability was maintained, while the operating record captured the size of the response and the subsequent recovery.
Dominion's published five-minute load samples fell from 17,683 MW to 14,775 MW, a 2,908 MW difference between adjacent observations. Load recovered over the following twenty minutes as the sites returned. These samples show the event at five-minute resolution.
Area control error, which measures a balancing area's deviation from its scheduled balance, also moved sharply. Before the event, the series had remained within roughly plus or minus 400 MW during the preceding hour.
At 7:57 a.m., the minute average reached 2,964 MW, with individual samples up to 3,487 MW. By 8:08 a.m., it was back inside the preceding band. Dominion said operators stabilized conditions within minutes, and PJM reported no impact on reliability.
For planners, the event adds the behavior of large loads to the question of their size. A concentrated cluster can change demand rapidly when its protection systems respond to a disturbance, requiring coordination among the grid operator, utilities and the facilities themselves.
Who should make the decisions#
That coordination sits alongside the governance questions raised in Docket AD26-7-000. Member companies vote through PJM's sector-based stakeholder process, and the Board of Managers decides whether to accept the resulting proposals. Critics at the conference argued that the structure can delay changes and separate voting influence from responsibility for the outcome.
PSEG regulatory officer Jodi Moskowitz said sector-weighted voting “doesn't sufficiently align voting interest with accountability.” Her argument put the distribution of decision-making power at the center of the reform discussion.
| Proposal | What it would change | Raised by |
|---|---|---|
| Board independence | Move decisions from member votes to the Board of Managers, leaving stakeholders advisory | FERC commissioners, AEP, PSEG |
| Longer board terms | Extend three-year terms to six or nine years so directors cannot be removed for unpopular decisions | Discussed at the conference |
| State filing rights | Let states file proposals at FERC alongside PJM, rather than lobbying through the member process | State regulators, R Street |
| Open board proceedings | Public board meetings, roll-call votes in the minutes, and written orders explaining decisions | R Street testimony |
| Public interest mandate | Write an explicit affordability and reliability duty into how the board operates | PJM's independent market monitor |
Commissioner David LaCerte called for a more empowered board. Peter Lake of the White House National Energy Dominance Council advocated an independent, transparent board able to make difficult decisions, while Deputy Energy Secretary James Danly sought greater transparency in board proceedings.
Participants pointed to MISO's model, in which stakeholders advise and the board decides. AEP supported an advisory structure and a larger state role. Virginia regulator Kelsey Bagot said the states' three annual meetings with PJM's board were unproductive, illustrating the limited channel available to officials responsible for retail customers.
Independent market monitor Joseph Bowring argued that staff objectives should be defined around the public interest. PJM chief executive David Mills said the operator was committed to addressing the challenge, including capacity-market reform.
At the July conference, FERC set the end of September as the target for a governance package and said it would convene a dispute-resolution forum and impose reforms if agreement did not emerge. That timetable made the allocation of authority an immediate decision for PJM's members.
The next test was the reform process#
Open meetings, recorded votes and written explanations would give participants a clearer account of how a regional decision was reached. Changes to board independence and stakeholder voting would go further, altering who can advance or block a proposal.
The market record gives those choices practical stakes: more frequent high-price hours, growing differences between zones and a generation fleet with elevated forced outages. Governance determines how PJM turns competing responses to those conditions into a rule or an investment decision.
The next milestone in the July timetable was September's reform process. Its concrete tests were whether participants agreed on board authority, a meaningful state role and a public record of decisions, and which changes FERC would require if they did not.
This analysis preserves the July 25, 2026 reporting snapshot. Year-over-year prices compare January 1–July 20 in each year, using PJM day-ahead LMPs. Forced outages come from PJM's outage outlook; the July 22 comparison uses instantaneous load and area control error. Gas comparisons use the EIA Henry Hub daily spot series. Prices are wholesale reference or zonal measures as labeled. Explore PJM on the map.