Goldman's RWE Deal Turns on a 1.2 GW Pipeline's Tax-Credit Status
The announced sale includes 308 MWac operating and a 1.2 GW pipeline Goldman calls “safe-harbored” for federal tax credits, without disclosing how much of it qualifies. Ask the Grid also traces 49 public predecessor assets and finds a lower 2024 capacity factor than RWE's larger solar fleet.
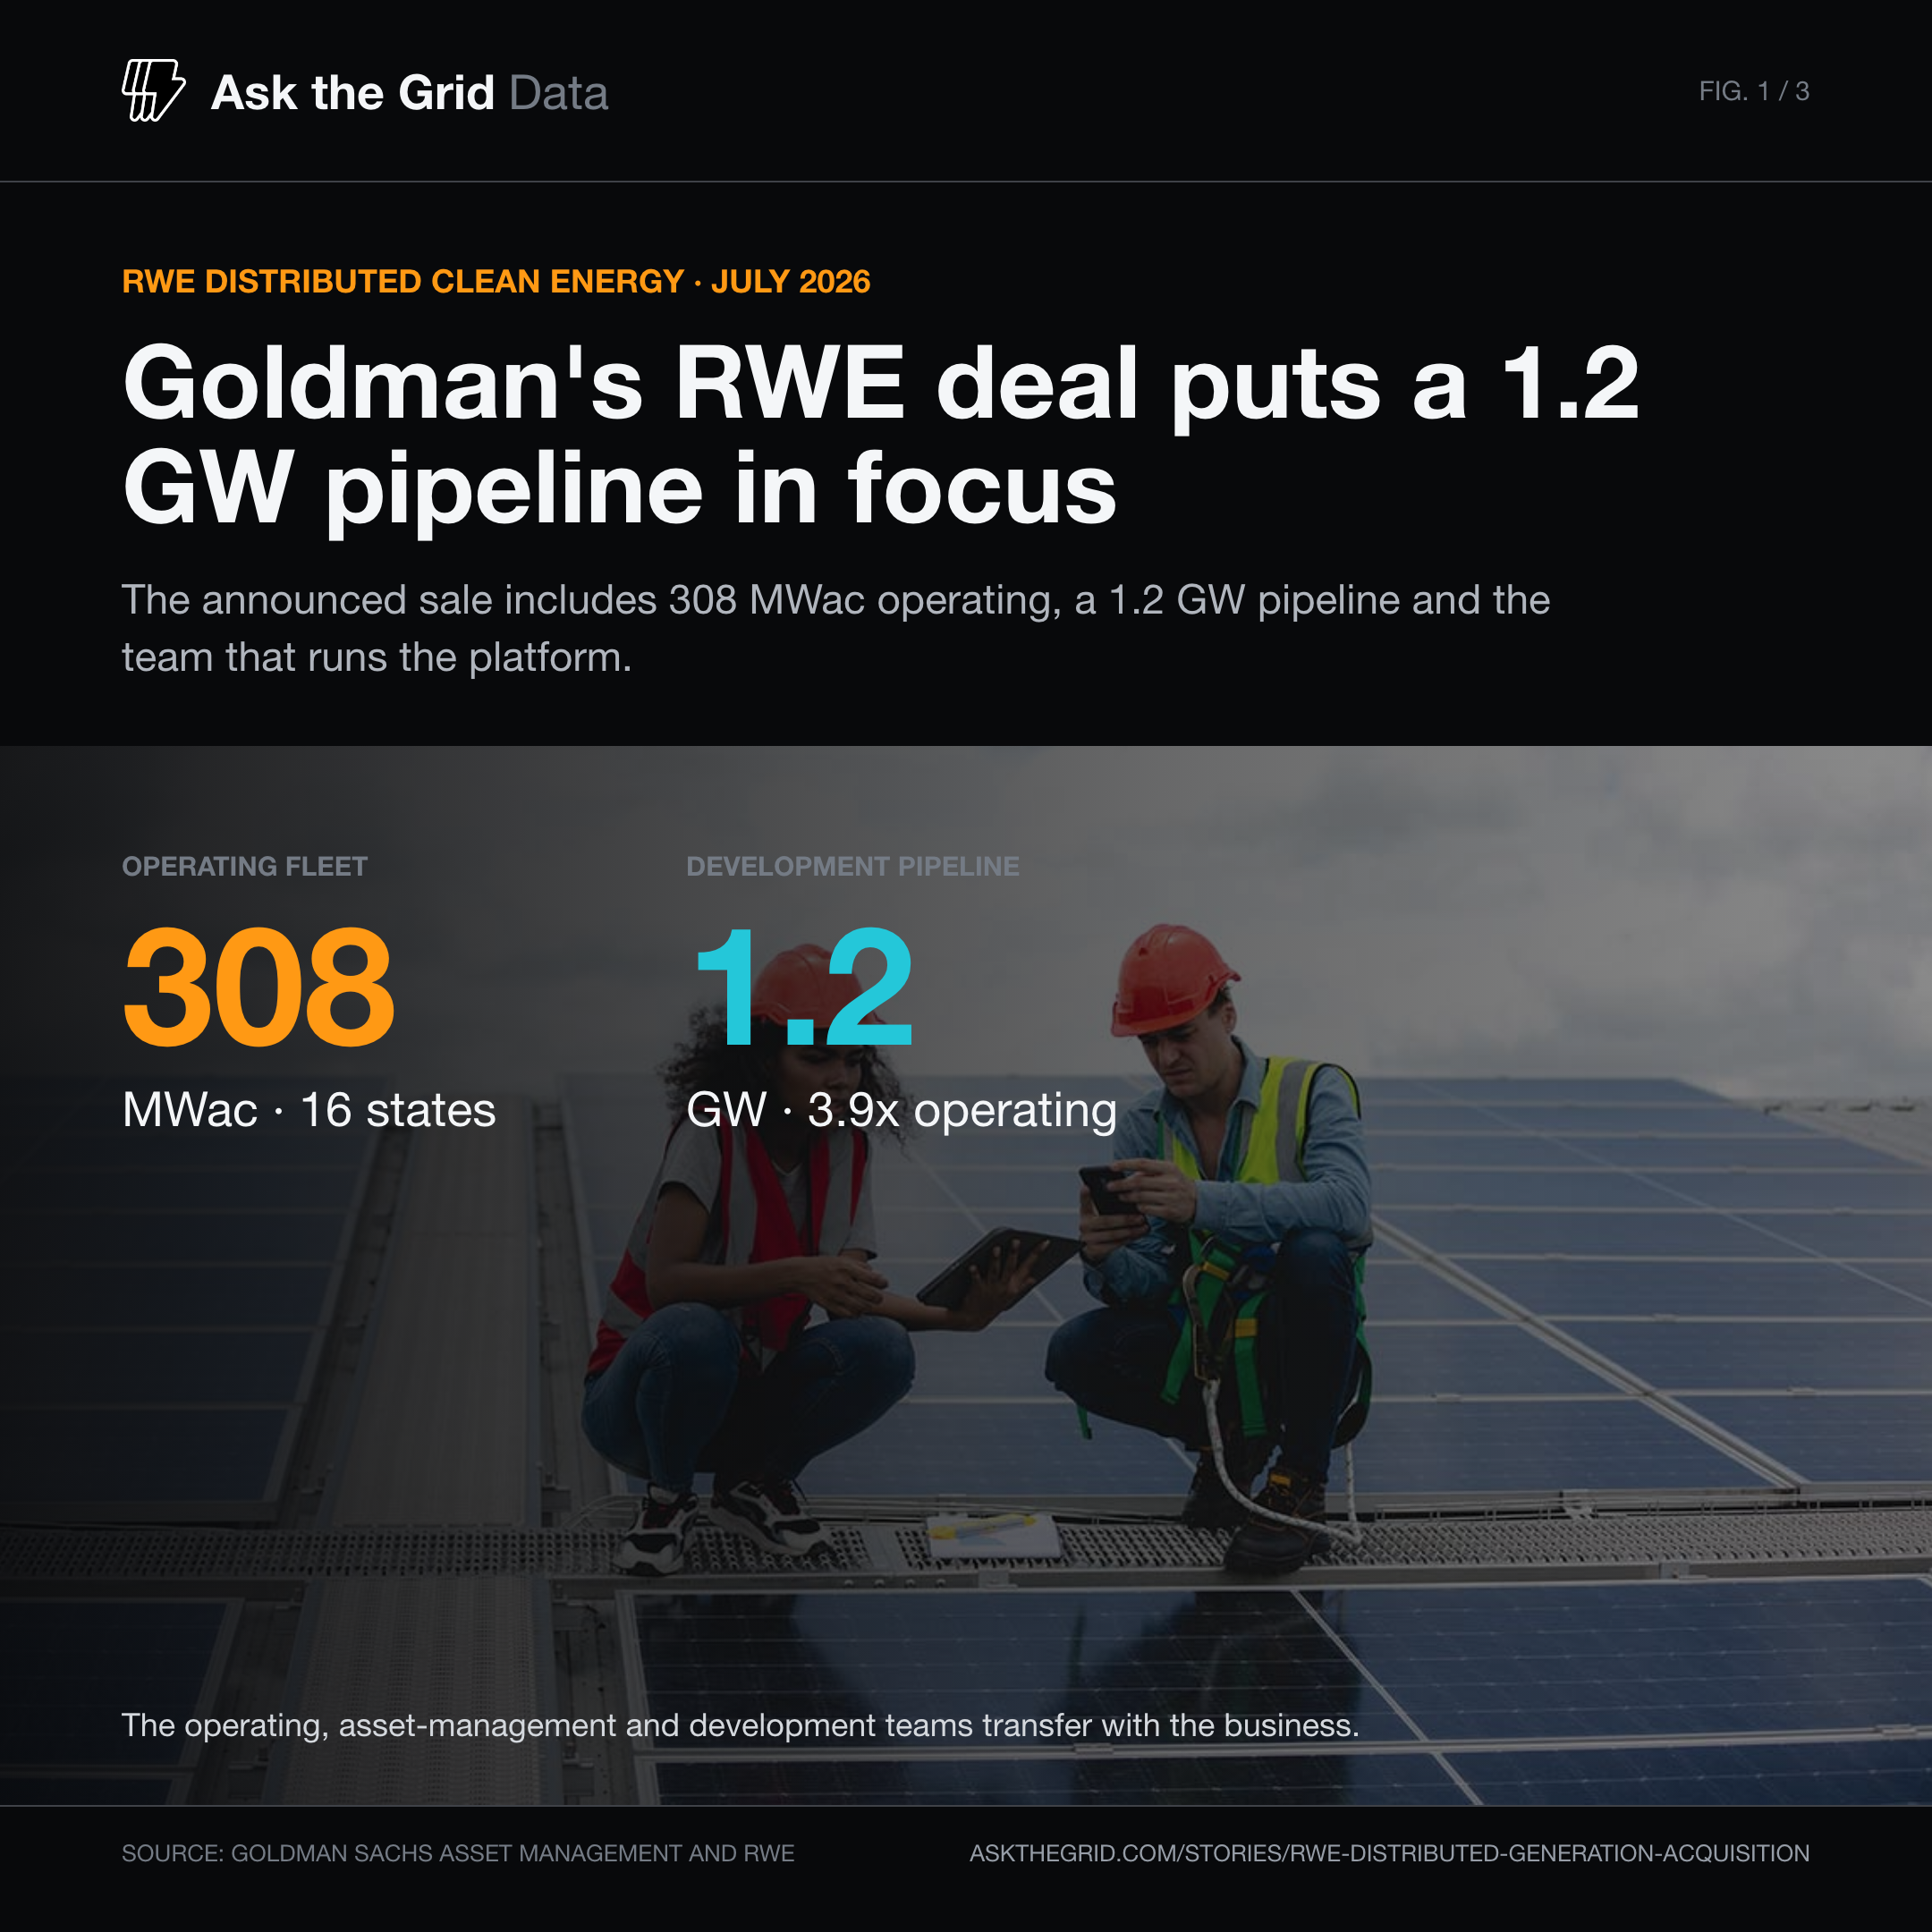
Goldman Sachs Alternatives agreed on July 29 to buy RWE's U.S. Distributed Clean Energy business. The announced perimeter is 348 MWdc / 308 MWac of operating renewable assets across 16 states, a 1.2 GW development pipeline, and the employees who develop, operate and manage the fleet. The price and plant schedule were not disclosed; closing is expected in the fourth quarter, subject to customary regulatory approvals and closing conditions.
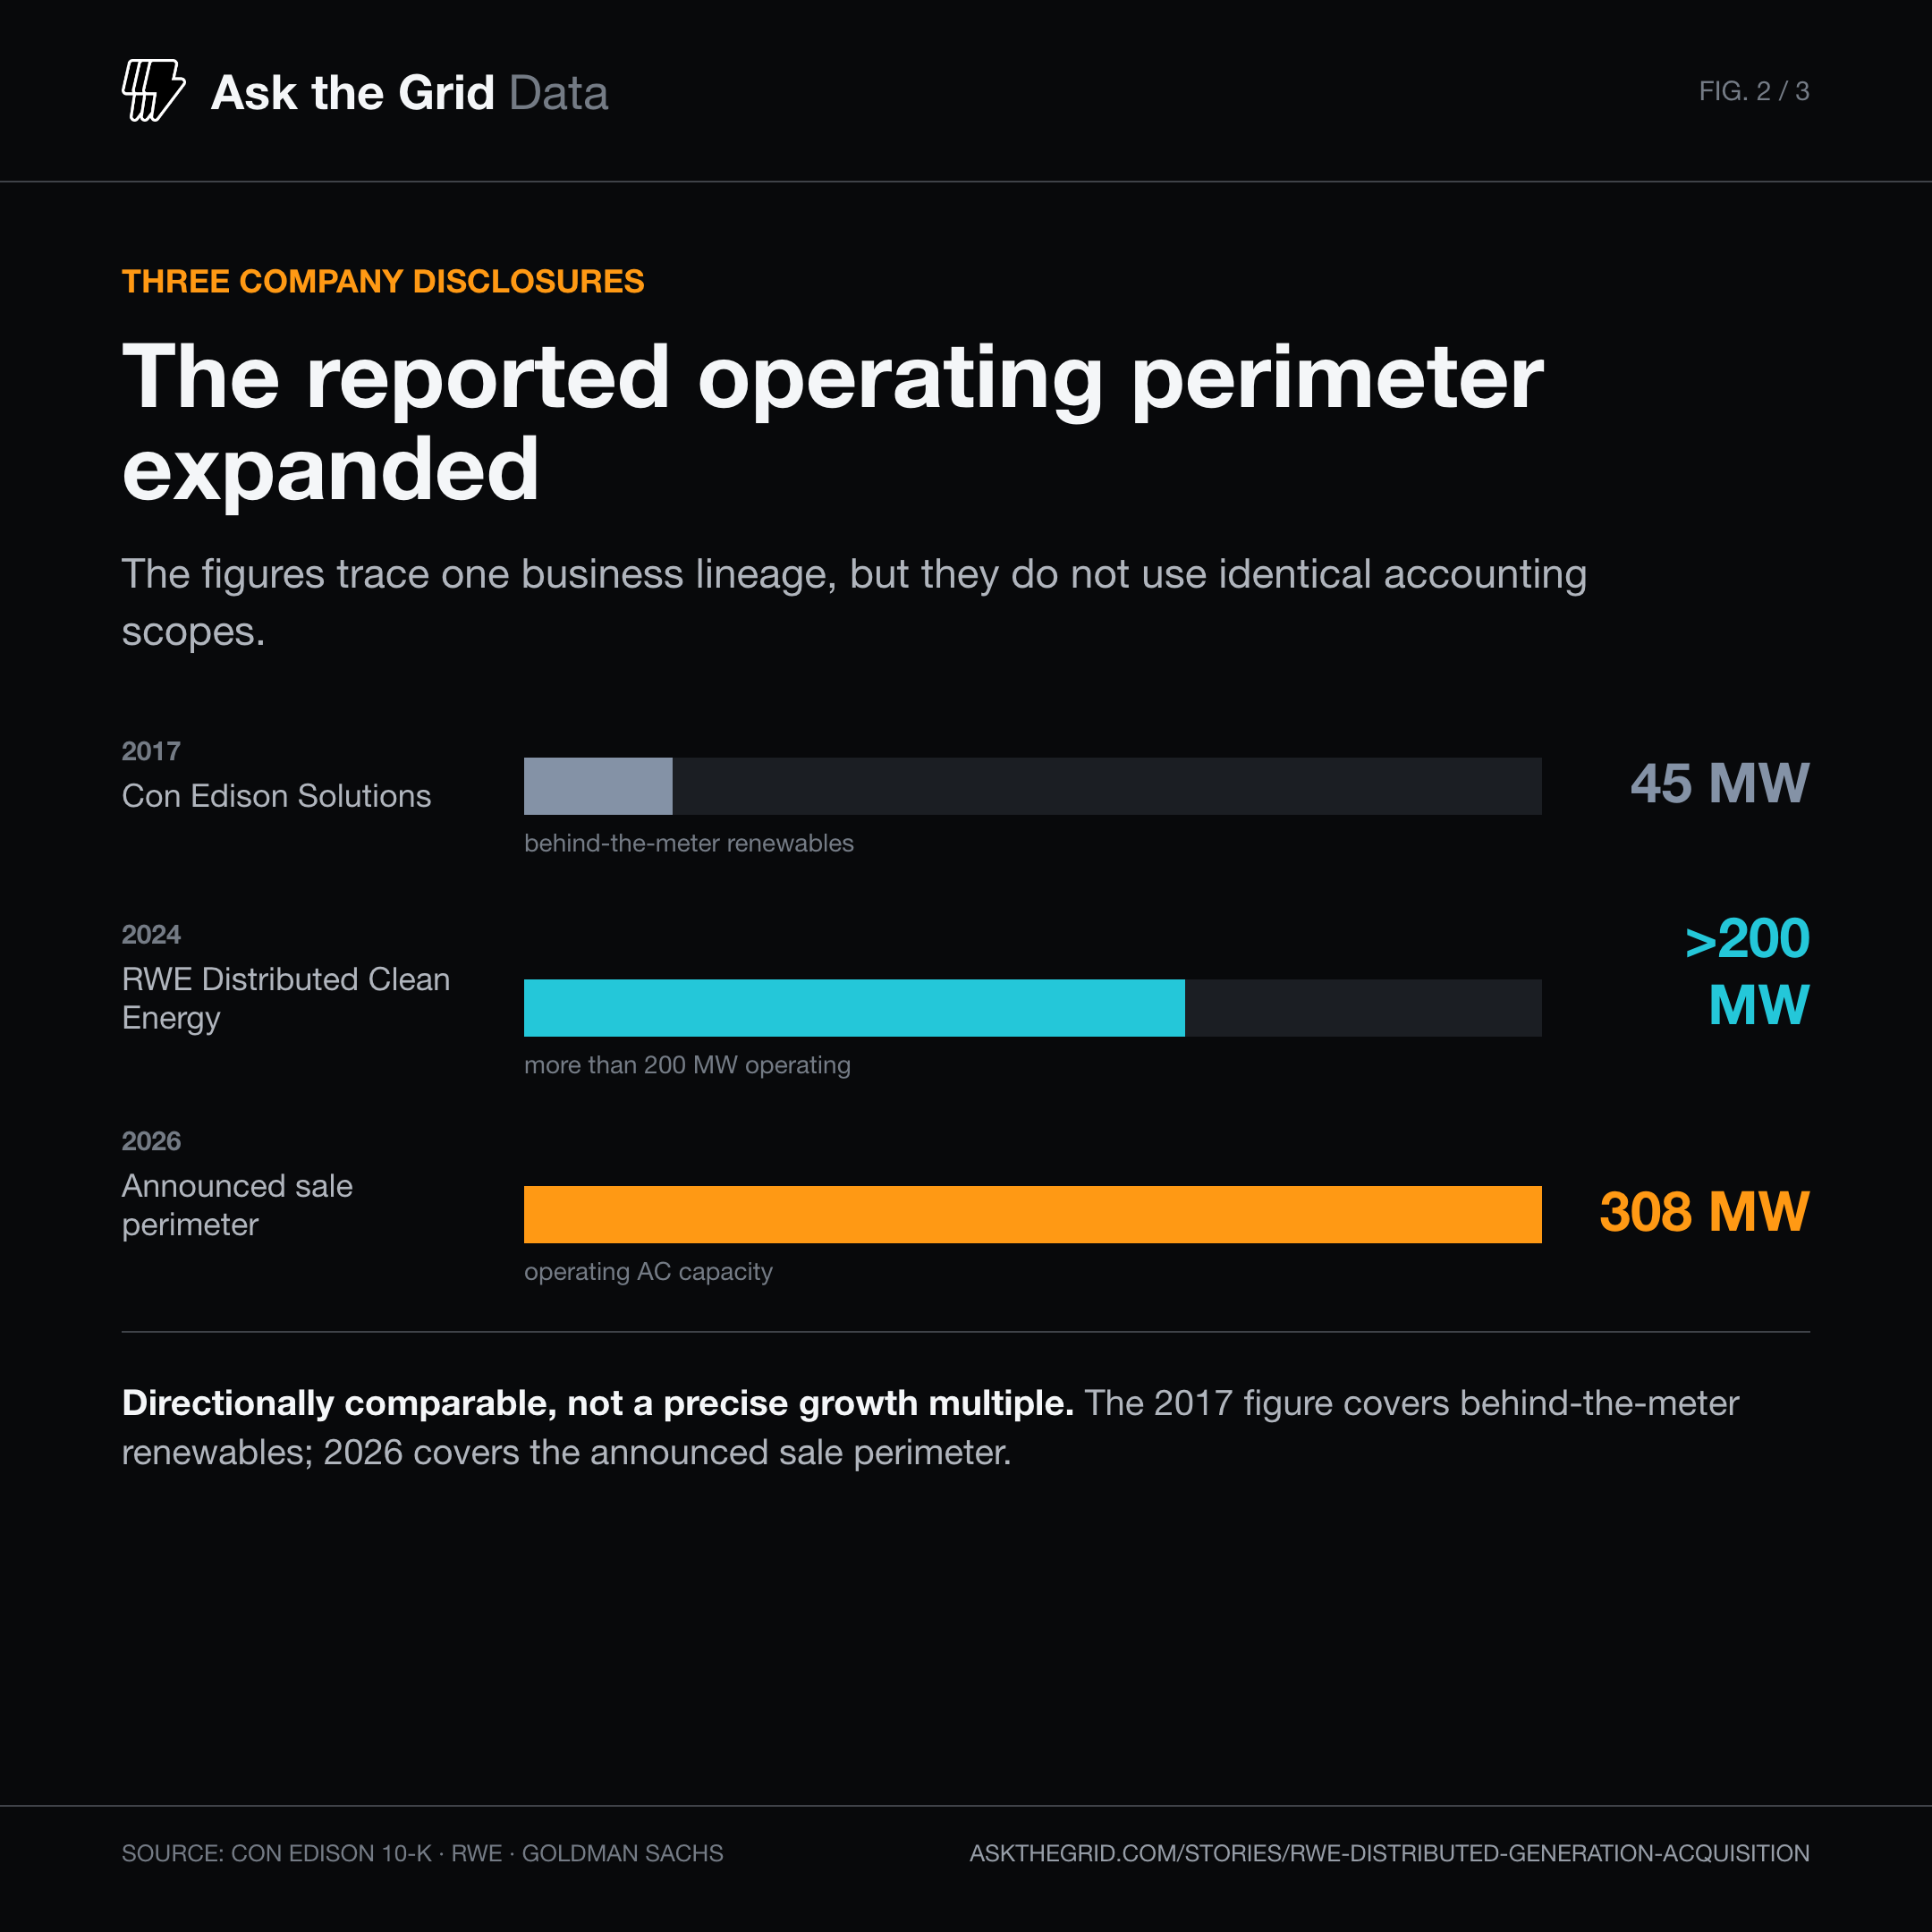
The deeper story is the platform attached to the assets. Con Edison Solutions, a business-line predecessor RWE acquired with Con Edison's Clean Energy Businesses in 2023, reported 45 MWac of behind-the-meter renewables in 2017. RWE described Distributed Clean Energy as more than 200 MW operating in April 2024. The announced sale perimeter is now 308 MWac, with a development book that runs roughly 3.4 to 3.9 times that operating base — the exact ratio depends on whether the pipeline is measured on a DC or AC basis, which neither company specified. The disclosures have different scopes, but together they show that the transaction is as much about the development and operating platform as the assets already in service.
16 states
Goldman calls the pipeline “safe-harbored”#
The announcement's most consequential word may not be a number. Goldman's release describes DCE as having "a strong foundation of contracted, diversified operating assets and a significant, safe-harbored development pipeline." In tax terms, "safe-harbored" means a project has done enough — under whichever test applies — to lock in its eligibility for federal clean-electricity tax credits before those credits phase out for its technology. For a 1.2 GW pipeline, that status can be worth more than the pipeline's raw size.
The safe-harbor test itself has been unusually unsettled in 2026. The One Big Beautiful Bill Act phases out the Section 45Y and 48E credits for wind and solar facilities that neither begin construction promptly nor reach service by the end of 2027. IRS Notice 2025-42, issued in August 2025, eliminated the traditional 5-percent cost safe harbor for wind projects and solar over 1.5 MW, forcing developers onto a stricter physical-work test with a hard beginning-of-construction deadline of July 4, 2026. A federal court then vacated that notice in full on June 6, 2026 — three weeks before Goldman and RWE announced this deal — calling it arbitrary and capricious and restoring the 5-percent cost safe harbor as a valid method. An appeal is expected, a reversal could apply retroactively, and the IRS remains free to issue new guidance on remand; developers were told not to treat the vacatur as final.
Neither company disclosed how much of the 1.2 GW pipeline is safe-harbored, under which method, in which technologies, or how close individual projects are to construction. Given the surrounding legal uncertainty, "safe-harbored" could mean different things for different projects in the same portfolio — physical work performed under a since-vacated test, cost commitments made under the now-restored one, or a mix with different exposure if the vacatur does not survive appeal. That distinction, not the pipeline's headline size, is the detail a buyer's diligence would need to price.
Three disclosures show a larger operating perimeter#
Those disclosures are not like-for-like accounting cuts, so they should not be reduced to a precise growth multiple. They do trace the same business lineage. The 2017 Con Edison filing described customer-sited renewables concentrated in Massachusetts and New York. After RWE bought Con Edison's Clean Energy Businesses, the renamed DCE team expanded into commercial and industrial solar, community solar, batteries, municipal work and energy-efficiency contracts. By 2024, RWE was reporting more than 200 MW operating and more than 1 GW in development.
A public-record proxy for part of the predecessor fleet#
The company totals say how large the business is. Asset history shows why it is operationally different. Ask the Grid screened current RWE Clean Energy plants at 10 MW or less, then retained only plants whose 2022 EIA operator was Consolidated Edison Solutions or Consolidated Edison Development. That produces a 49-plant, 187.9 MW cohort across 14 states that reveals the geographic and operating shape of part of the predecessor small-project business behind the announcement — not an estimate of the transaction's complete operating portfolio.
The cohort is not a reconstruction of the undisclosed sale schedule, and it is a lower-bound sample, not a census. It deliberately excludes larger projects and five small plants whose 2022 operator was already RWE Renewables Americas rather than a Con Edison predecessor. It also starts from RWE's current plant list, so any predecessor asset sold, retired or reorganized between the 2022 operator record and today would not appear here. EIA-860 also generally covers plants only when combined nameplate capacity reaches 1 MW, so smaller behind-the-meter systems that a distributed-generation portfolio typically contains are likely underrepresented. The result is a reproducible view of part of the predecessor fleet — skewed toward its larger, EIA-visible projects — while the announced 308 MWac remains the authoritative transaction total.
The geography is concentrated but not simple. Massachusetts, New Jersey, Iowa and Minnesota contain 76 percent of the cohort's capacity, yet the technology mix crosses solar, wind and solar-plus-storage. Massachusetts alone contains 20 plants. That dispersion changes the operating problem: more utility relationships, more site hosts, more local incentive regimes and more equipment vintages per megawatt than a utility-scale fleet.
The small-project fleet has a different production profile#
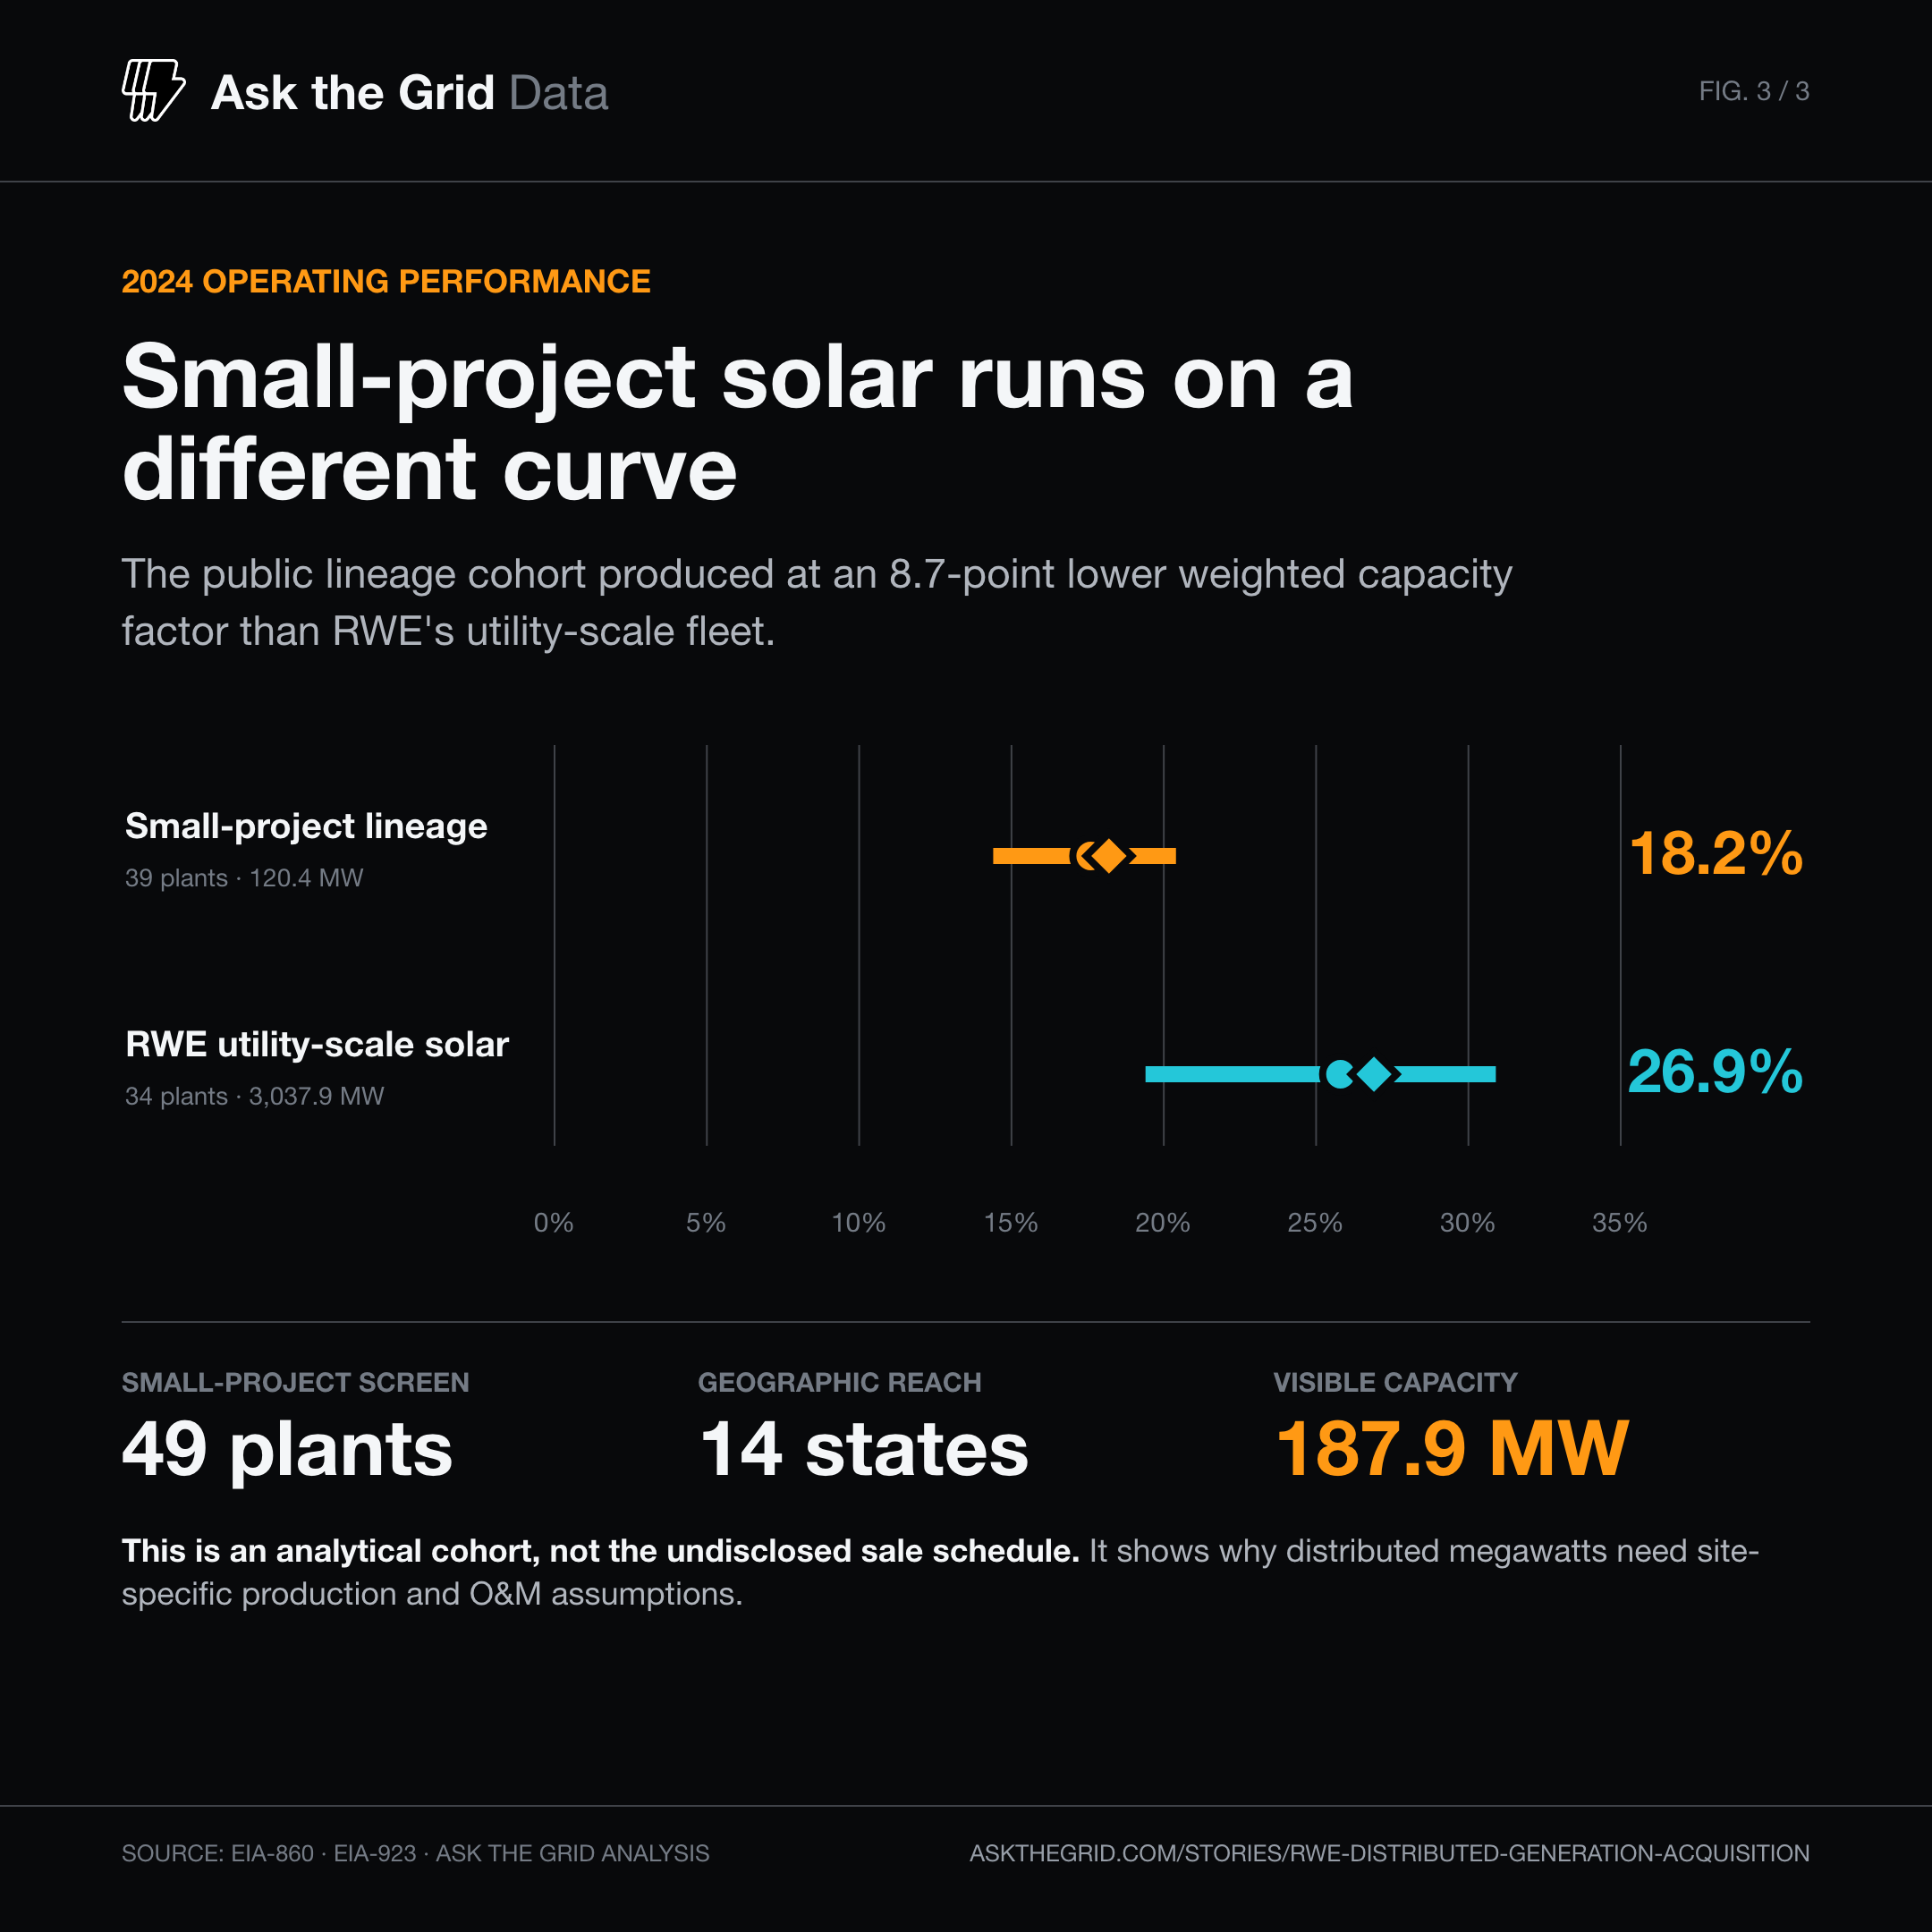
Ask the Grid then compared the solar-only plants in that lineage cohort — 39 of the 49, since the rest are wind or wind-hybrid — with a comparison cohort of RWE's own larger solar plants. For plants operating before 2024 with all 12 months reported and positive annual EIA generation, the small-project cohort covers 39 plants and 120.4 MW. It produced 192.2 GWh in 2024, equal to an 18.2 percent weighted capacity factor. RWE's 34-plant, 3.0 GW cohort of plants at 20 MW or more reached 26.9 percent.
This 8.7-percentage-point difference is descriptive, not a verdict on asset quality. The cohorts differ in geography, solar resource, tracking versus fixed-tilt design, interconnection constraints and equipment vintage; this analysis does not isolate project size or distributed-generation architecture from those other portfolio-composition effects. The relevant diligence signal is that distributed megawatts should not be valued with larger-plant production assumptions simply because both use photovoltaic modules.
What the announced perimeter implies#
The public record does not include a purchase price, asset-level contracts, customer credit profiles, pipeline-stage distribution, safe-harbor documentation, interconnection status or asset-level cash flows, so it cannot show what Goldman is actually underwriting. It can show what the announced perimeter implies a buyer would need to underwrite. The transaction announcement says the operating, asset-management and development teams transfer with the business, so the workforce is part of the transaction perimeter, not an incidental service agreement. The 1.2 GW pipeline is several times the operating fleet, so value creation depends on repeatedly winning customers, securing distribution interconnection, qualifying tax and state incentives, constructing at occupied sites and operating long contracts across many utilities. Neither company disclosed a technology breakdown for the operating fleet or the pipeline beyond describing both as renewable assets.
RWE's Greenburgh school project is one illustration of the underlying business model, not evidence about the economics of the full portfolio: a $20.5 million energy-savings performance contract across eight facilities, combining 600 kWac of carport solar, 775 kWac of battery capacity and building-efficiency measures. That single project is simultaneously a customer contract, a construction program, a distributed grid resource and a long-term service obligation. A conventional plant leaderboard captures only one of those layers.
The decision for operators and developers#
For an infrastructure buyer, the diligence list starts with the PPA and energy-savings contract register: customer concentration, escalators, credit exposure, production guarantees, renewable-credit ownership, tax-credit eligibility (including which projects are safe-harbored and under which test), inverter replacement assumptions and site-level telemetry. The Ask the Grid comparison adds a practical warning: small-project solar in this lineage produced on a materially lower curve than RWE's larger plants, so underwriting should be site-specific.
For distributed operators, the map shows where scale becomes complexity. Forty-nine public plants across 14 states already imply multiple weather regimes, utilities and maintenance routes, and the full 308 MWac business is larger still. Standardizing monitoring and field operations without flattening the local contract and interconnection details that determine each site's economics is an operating challenge specific to this kind of dispersed, small-project fleet.
For developers, the pipeline is the competitive signal. The buyer is acquiring 1.2 GW of reported future opportunities alongside the operating fleet and the team that develops it. The undisclosed purchase price prevents a conclusion about the valuation Goldman placed on that pipeline, but the transaction puts institutional capital behind a distributed-development platform whose projects are individually small and operationally dispersed.
The next public tests arrive with the expected fourth-quarter close: whether either party discloses price or an asset schedule, whether the 1.2 GW pipeline changes before closing, and how the predecessor cohort's operator records change in the next EIA release. Those facts will show what transferred; the announcement alone does not price the development book.
Methodology#
This story is frozen on July 29, 2026. The small-project cohort uses the April 2026 EIA-860M monthly update — a preliminary snapshot, subject to revision, not the final annual EIA-860 inventory — and includes current RWE Clean Energy plants with total nameplate capacity at or below 10 MW whose 2022 EIA-860 annual plant operator was Consolidated Edison Solutions or Consolidated Edison Development. It contains 49 plants, 14 states and 187.9 MW. The screen excludes five small current RWE plants whose 2022 operator was RWE Renewables Americas. The 10 MW cutoff defines the analytical cohort; it is not the transaction's undisclosed plant schedule.
For the performance comparison, Ask the Grid summed 2024 EIA-923 solar generation by plant and month, excluding plants that began operation during the year, lacked any of the 12 monthly reports or had nonpositive annual net generation. Some included plants have zero or negative net generation in one or two months. Capacity factor uses 8,784 hours because 2024 was a leap year, and its denominator is each plant's April-2026-vintage EIA-860M nameplate capacity rather than a capacity figure re-derived for 2024 specifically — a plant uprated, derated or partially retired between those dates would carry a mismatched denominator. We spot-checked this for every cohort plant under PJM's balancing authority (11 of 49 lineage plants; 4 of 34 comparison-cohort plants) against a December 2024 snapshot and found identical capacity at both vintages; the MISO- and ISONE-jurisdiction plants that make up most of the cohort by count could not be checked the same way. The small-project cohort contains 39 solar or solar-hybrid plants and 120.4 MW of solar; the ≥20 MW comparison cohort contains 34 RWE solar plants with at least 20 MW of total plant capacity and 3,037.9 MW of solar — an internal size cutoff for this comparison, not a claim that only ≥20 MW plants are "utility-scale." Percentile labels use exact inclusive percentiles. The analysis does not attribute the observed difference to a single cause, and does not isolate project size or distributed-generation architecture from geography, tracking, vintage and other portfolio-composition effects.